Abstract
Low-dose imaging protocols in chest CT are important in the screening and surveillance of suspicious and indeterminate lung nodules. Techniques that maintain nodule detectability yet permit dose reduction, particularly for large body habitus, were investigated. The objective of this study was to determine the extent to which radiation dose can be minimized while maintaining diagnostic performance through knowledgeable selection of reconstruction techniques. A 320-slice volumetric CT scanner (Aquilion ONE™, Toshiba Medical Systems) was used to scan an anthropomorphic phantom at doses ranging from ∼0.1 mGy up to that typical of low-dose CT (LDCT, ∼5 mGy) and diagnostic CT (∼10 mGy). Radiation dose was measured via Farmer chamber and MOSFET dosimetry. The phantom presented simulated nodules of varying size and contrast within a heterogeneous background, and chest thickness was varied through addition of tissue-equivalent bolus about the chest. Detectability of a small solid lung nodule (3.2 mm diameter, −37 HU, typically the smallest nodule of clinical significance in screening and surveillance) was evaluated as a function of dose, patient size, reconstruction filter, and slice thickness by means of nine-alternative forced-choice (9AFC) observer tests to quantify nodule detectability. For a given reconstruction filter, nodule detectability decreased sharply below a threshold dose level due to increased image noise, especially for large body size. However, nodule detectability could be maintained at lower doses through knowledgeable selection of (smoother) reconstruction filters. For large body habitus, optimal filter selection reduced the dose required for nodule detection by up to a factor of ∼3 (from ∼3.3 mGy for sharp filters to ∼1.0 mGy for the optimal filter). The results indicate that radiation dose can be reduced below the current low-dose (5 mGy) and ultralow-dose (1 mGy) levels with knowledgeable selection of reconstruction parameters. Image noise, not spatial resolution, was found to be the limiting factor in detection of small lung nodules. Therefore, the use of smoother reconstruction filters may permit lower-dose protocols without trade-off in diagnostic performance.
Keywords: low-dose CT, volumetric CT, chest CT, lung cancer screening, lung nodule surveillance, observer performance, detectability, reconstruction filter, MAFC
INTRODUCTION
Computed tomography (CT) is an effective imaging modality for the clinical detection and surveillance of lung nodules. Recent developments in CT scanner technology include the capability for volumetric scanning (i.e., 16 cm longitudinal coverage) in a single gantry rotation (∼0.35 s), offering sub-millimeter axial spatial resolution, faster scan times, and potentially reduced patient dose.1 Such capability offers immediate application in cardiac imaging as well as a host of other “whole-organ” imaging applications, ranging from brain or liver perfusion scans to thoracic imaging.
Early-stage lung cancer diagnosis relies on accurate detection and characterization of subtle lung nodules. Short-term follow-up is required for nodules of diameter greater than 5 mm, while sub-5-mm nodules without history of malignancy require annual follow-up.2 Surveillance imaging to monitor nodule growth is typically performed at 3–12 month intervals.3 In addition to providing a means of early-stage nodule detection, CT has increased the accuracy in monitoring nodule growth, which is particularly important at the low doses required to facilitate regular follow-up.4, 5 However, at low doses image quality is degraded significantly due to noise and image artifact, particularly for large patients. Reconstruction software offers a variety of options that can reduce such effects, including spatial frequency filters, slice thickness selection, artifact correction, and noise reduction algorithms. To delve the low-dose detectability limits without jeopardizing diagnostic accuracy, the relationships of dose, body size, and reconstruction parameters to diagnostic accuracy should be more fully investigated, particularly as new scanner technologies emerge.6
Previous studies of low-dose CT lung nodule detection have demonstrated that for small solid tumors, substantial dose reduction is possible given prior knowledge of nodule size and contrast (analogous to the task of nodule surveillance).3 The study reported here investigates the low-dose limits of lung nodule detectability in volume CT and identifies optimal low-dose reconstruction techniques particularly with regard to body habitus ranging from average to obese. A volume CT scanner and anthropomorphic phantom7 form the basis of the study. The experimental variables include factors related to imaging dose (kVp and mAs) and image reconstruction (slice thickness and reconstruction filter), and low-dose detectability limits are identified by means of multiple-alternative forced-choice (MAFC) human observer tests. The results help guide selection of technique factors appropriate to low-dose imaging protocols in a manner that accounts for body habitus and maintains diagnostic accuracy.
METHODS
Image acquisition
Volumetric CT scanner
Images were collected on a clinical multidetector CT scanner (320-slice Aquilion ONE™, Toshiba Medical Systems, Tokyo). Images were acquired in volume mode (16 cm z coverage per rotation). Consistent with the clinical protocol for chest scans on this CT system, four volumes were combined axially to effect a scan length of 32 cm from the lung apices to the diaphragm of an anthropomorphic chest phantom (described below). Gantry rotation speed was 0.35 s, with dose, slice thickness tslice, and reconstruction filter varied as detailed below.
Acquisition and reconstruction techniques
A total of 1134 volume CT images were acquired—the product of two phantom sizes, three kVp, nine mAs, three slice thicknesses, and seven reconstruction filters—as detailed in Table 1. Each combination of kVp and mAs in Table 1 was selected, yielding a dose range (CTDIvol.e as reported by the scanner) from 0.1 mGy (80 kVp, 3.5 mAs) to 12.5 mGy (120 kVp, 105 mAs). Images were reconstructed at slice thicknesses of 1 mm (with 1 mm slice interval), 3 mm (1.5 mm slice interval), and 5 mm (2.5 mm slice interval). Seven reconstruction filters available on the scanner were applied, including smooth soft-tissue filters (FC1–FC5), a smooth filter with proprietary noise reduction (FC11), and a sharp filter (FC50). All images were reconstructed using two additional image processing techniques (used in clinical protocol) available on the scanner–BOOST3D for beam-hardening artifact reduction and quantum denoising (QDS+) for edge-preserving noise reduction.
Table 1.
Summary of experimental parameters: Phantom size, image acquisition techniques (kVp and mAs), and reconstruction techniques (slice thickness and reconstruction filter).
| Experimental Parameters | ||||
|---|---|---|---|---|
| Phantom chest thickness | kVp | mAs | Slice thickness @ interval | Reconstruction filter |
| Average (22 cm) | 80 | 3.5 | 1 mm @ 1 mm | FC1 |
| Clinically obese (32 cm) | 100 | 7 | 3 mm @ 1.5 mm | FC2 |
| 120 | 10.5 | 5 mm @ 2.5 mm | FC3 | |
| 14 | FC4 | |||
| 17.5 | FC5 | |||
| 24.5 | FC11 | |||
| 35 | FC50 | |||
| 70 | ||||
| 105 | ||||
Modulation transfer function
The modulation transfer function (MTF) was measured to determine the spatial frequency response associated with the seven reconstruction filters. A 250 μm steel wire was suspended in a 5 cm diameter hollow acrylic cylinder and scanned at 100 kVp (105 mAs). Volume images (46 slices per image) were reconstructed using each reconstruction filter. In each slice, the line-spread function (LSF) of a 2.8×2.8 cm2 region of interest (ROI) containing the wire was obtained by Radon transform (summation along pixel columns). Each LSF was corrected by subtraction of a quadratic fit to the air-only region to remove background trends. To obtain an oversampled LSF analogous to that obtained in the Fujita8 angled-slit method, LSFs from each slice were interleaved by shifting such that the centroid of each LSF was coincident. The area under the resulting oversampled LSF was normalized to unity, and the MTF was obtained as the magnitude of the Fourier transform. This algorithm was implemented for each reconstruction filter to determine its spatial frequency response.
Measurement of dose
Dose reported by the scanner (CTDIvol.e and DLP.e)
For each image, the scanner reported dose in terms of CTDIvol.e (termed by the manufacturer as the “extended” CT dose index) and an associated dose length product (DLP.e) to estimate the multiple scan average dose (MSAD) in mGy and mGy⋅cm, respectively. According to the manufacturer, the CTDIvol.e is calculated as
| (1) |
where the numerator is the dose measured by a 10 cm pencil chamber moved along the z axis (at both the central and peripheral locations) in a beam of width 10 cm or greater. For narrower beams, the denominator is equal to the nominal beam width. CTDIvol.e varies as a function of beam energy, collimation, x-ray tube current, scan length, and phantom size (head or body). This extended dose metric is intended to account for the long tails of scatter associated with volumetric imaging.
Dose measured using Farmer chambers
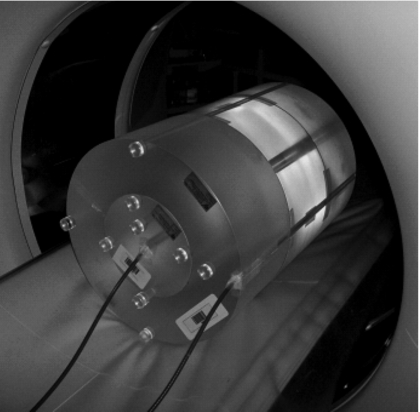
As a basis of comparison to the manufacturer-reported CTDIvol.e, the absolute dose was measured using Farmer chambers placed within three CTDI body phantoms (32 cm diameter acrylic; 48 cm total length; RTI Electronics, Mölndal, Sweden) stacked along the z axis of the scanner as shown in Fig. 1. The long phantom configuration is sufficient to include the wide cone angle (16 cm primary beam) as well as scatter tails. Two Farmer chambers (0.6 cc air ionization chambers, aluminum electrode, graphite tip; Thomson-Nielsen, Best Medical Canada, Ottawa, ON) were inserted to 24 cm depth at the center and periphery of the phantoms. Buildup caps and cable sleeves were not used and have been shown to have little effect on the charge measurement in the diagnostic energy range (0.6%–0.9%).9 The chambers were independently calibrated by an accredited calibration laboratory (National Research Council, Ottawa, ON). Dose measurements were performed at 80, 100, and 120 kVp, each at 100 mAs and reported in terms of mGy/mAs.
Figure 1.
Photograph of setup for dose measurements. Two Farmer chambers were inserted in the center and periphery of 32 cm diameter acrylic cylinders, stacked to 48 cm length.
The electrometers (Advanced Therapy Dosimeter, FLUKE Biomedical, Everett, WA) recorded the electrode charge, which was converted to absolute dose (mGy) by applying the calibration factor (mGy/nC) and temperature-pressure correction. For comparison to CTDIvol.e, the weighted CTDI (CTDIw) was calculated from the doses measured at the center and periphery (Dcenter and Dperiphery, respectively) as
| (2) |
Dose measured using MOSFETs
To measure the dose delivered inside the simulated lungs of the anthropomorphic phantom, metal-oxide semiconductor field-effect transistors (MOSFETs, Thomson-Nielsen MobileMOSFET, Best Medical Canada, Ottawa, ON) with an active region of 0.2×0.2 mm2 each were used as point dosimeters. To evaluate the accuracy of the MOSFETs relative to the Farmer chambers, MOSFETs were incorporated in the long (48 cm) CTDI phantom and scanned at the same conditions described above for the Farmer chambers. In the anthropomorphic phantom scans, three MOSFETs were mounted on a probe inserted in the empty cavity of the right lung [visible in Fig. 2b], each MOSFET encased in a thin layer (∼5 mm) of SuperFlab™ bolus material and separated by ∼15 mm. In addition, two MOSFETs were secured to the exterior of the phantom, one at the anterior and one at the left lateral chest, each encased in ∼5 mm bolus. MOSFET measurements were converted to Dlung (mGy) by a calibration factor (32.2 mV∕mGy) determined in an independent calibration within the diagnostic energy range (80–120 kVp).
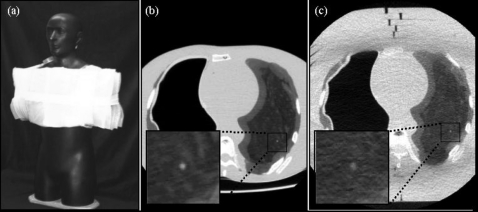
Figure 2.
Anthropomorphic phantom. (a) Photograph of the phantom with 10 cm SuperFlab™ secured to the torso to simulate an obese habitus. Axial images of the phantom in (b) the average habitus configuration (without SuperFlab™) and (c) the obese habitus configuration. Magnified views of a simulated 3.2 mm nodule are shown in each case. Imaging techniques for example images (b) and (c) were 100 kVp, 105 mAs (CTDIvol.e=6.7 mGy), FC3, and tslice=3 mm.
Anthropomorphic phantom
Simulated lung nodules in heterogeneous lung material
A custom anthropomorphic phantom7 based on the Rando™ chest phantom was used to collect all image data. The phantom contains a natural human skeleton and other tissue-simulating materials. The phantom is illustrated in Fig. 2. The right, air-filled lung was accessible via a hole in the shoulder and was used for MOSFET dosimetry. The left lung is composed of a heterogeneous microballoon-polyurethane mixture formulated to give electron density approximating that of the lung (−696±10 HU). A variety of spherical nodules ranging in diameter and contrast ∼1.6–12.7 mm and ∼−496 to +20 HU are incorporated within the left lung. Nodules selected for the current study were 3.2 mm in diameter and −37 HU (660 HU contrast to background), approximating the smallest nodule diameter likely to be followed up. Though larger nodules may also be difficult to detect,10 this selection facilitated the investigation of reconstruction techniques at the limits most relevant to nodule surveillance (small, suspicious lesions).
Obese body habitus
The anthropomorphic phantom presented an “average” body habitus with an AP thickness of ∼22 cm at the sternum. To simulate an “obese” habitus, 10 cm SuperFlab™ polymer (∼46.1±7.9 HU) was added (5 cm anterior+5 cm posterior) as shown in Fig. 2a. The associated body mass index (BMI) was approximated as
| (3) |
where weight and height were estimated by assuming the phantom to be of uniform density (1 g∕cm3) and extrapolating arms and legs of approximate cylindrical length and diameter. The estimated BMI for the average habitus was ∼22 kg∕m2, and that of the obese habitus ranged from ∼33 kg∕m2 (assuming fat on the torso only) to ∼46 kg∕m2 (assuming fat to cover the limbs as well). These BMI values correspond to clinically average (20–25 kg∕m2) and obese (>30 kg∕m2) body habitus, respectively, recognizing the upper BMI estimate on the obese habitus to be arguably “morbidly obese” (45–50 kg∕m2).
Observer tests and data analysis
Observer performance test
The detectability of simulated nodules in the phantom images was assessed in MAFC observer tests. Physicists (six total) were considered sufficiently expert readers for the fairly simple task of nodule detection (requiring no real knowledge of disease or anatomy). Observer tests were conducted on a 3 MP diagnostic-quality display monochrome LCD monitor (AM-QX21-A9300, National Display, San Jose, CA) calibrated to the DICOM standard in a dark-controlled radiology reading room [0.15 Cd∕m2 ambient light measured by a photometer (LumaColor Photometer, Tektronix, Beaverton, OR)]. Each test (2520 cases total) was completed in two 2 h sittings with three 5 min breaks per sitting to avoid observer fatigue. Each sitting included 1260 cases and was preceded by a 5 min training session in which the user was presented with 63 cases (∼5 min) representative of those in the test.
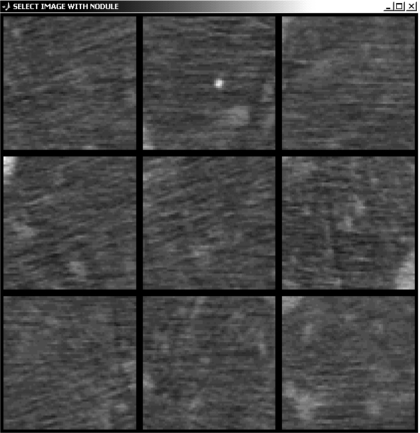
Tests were conducted using custom software (OPTEX) developed in MATLAB (The Mathworks, Inc., Natick, MA) for randomization of reading order, control of image display, and analysis of observer response. Each case was presented as a nine-alternative forced-choice (9AFC) detection task as illustrated in Fig. 3. Each of the nine subimages within a case involved a specific dose (kVp and mAs), reconstruction technique (slice thickness and filter), and phantom habitus (average or obese). Images were displayed using a fixed “lung” window [W(1800), L(−500)] and cropped to 3.25×3.25 cm2 (65×65 pixels). As illustrated in Fig. 3, one of the subimages contained a 3.2 mm nodule, and the others were “noise only.” The position of the stimulus was randomized in the 3×3 selection matrix, and the user was prompted to click on the subimage containing the nodule. To better emulate the clinical diagnostic task (and to dissuade observers from simply picking the subimage with the brightest central pixel), the position of the subimage centers was randomized by up to 10% of the subimage size to shift the nodule slightly from the center then flipped at random in x and y. A comfortable viewing distance of ∼50 cm was suggested to observers, but not strictly enforced. Observers were not allowed to adjust window-level settings or magnification.
Figure 3.
Illustration of 9AFC test for nodule detection. In this example [120 kVp, 14 mAs (CTDIvol.e=1.6 mGy), FC2 filter, tslice=3 mm, average body habitus] the stimulus is in the top-center subimage. The streaks in several ROIs are believed to be due to photon starvation and beam-hardening artifacts associated with the spine, ribs, sternum, and mediastinum (shown in Fig. 2).
Selection of the 2520 cases from the 1134 images was weighted preferentially toward lower-dose images, for which conspicuity decreased significantly. For all doses, at least one nodule was shown to each observer per parameter set. For the lower doses, one to three nodules were shown per parameter set with one to three repeats per nodule. The order in which various cases were presented was randomized.
Results were analyzed by grouping the observer responses and determining the proportion correct (Pcorr) for each set of phantom size, imaging, and reconstruction techniques. To estimate the corresponding area under the receiving operating characteristic (ROC) curve, a table of discrete Pcorr and Az values was used to fit a logarithmic quadratic equation of the form
| (4) |
where a, b, and c are fitting parameters. For M=9, a, b, and c were 1.00, −0.25, and 0.02, respectively. Values of Az∼0.95–1.0 represent conspicuity, while Az∼0.5 corresponds to pure guessing. The resulting Az were plotted as a function of dose for all reconstruction slice thicknesses and filters. Error bars were determined by specifying a 95% confidence interval on a discrete binomial distribution. Note that the nodule shown in Fig. 3 is fairly conspicuous (for purposes of illustration), while the images used throughout the observer tests ranged from conspicuous (Az∼1) to barely detectable (Az∼0.7) to undetectable (Az∼0.5).
Analysis
A logistic function was used to fit measurements of Az versus dose. A single-parameter sigmoid fit of the form
| (5) |
was used, where D corresponds to CTDIvol.e and a is a fit parameter determined by minimizing χ2 on the data. The fitting software (ORIGINPRO 8, OriginLab, Northampton, MA) returned an estimate and standard error on a. A metric (denoted Dthresh) was defined as the dose at which detectability (Az) decreased to a level of 0.95 (compared to 1.0 at arbitrarily high dose), determined from the inverse of the fit as
| (6) |
The standard deviation in Dthresh was estimated from the error in the fit parameter and the derivative:
| (7) |
Thus, low Dthresh values represent high observer performance (i.e., high detectability) at low-dose levels, and high Dthresh indicates poor performance at low dose. To evaluate the effects of reconstruction filter and slice thickness selection for average and obese body habitus, Dthresh values were compared. For each combination of reconstruction settings the calculated Dthresh was taken as the mean of a normal distribution with standard deviation σDthresh and compared to all other combinations via paired, unequal-variance, two-tailed student t-tests. For each comparison, this test returns the probability (p value) that the measured results correspond to the null hypothesis (no difference between two distributions), with p<0.05 taken to indicate a statistically significant difference.
RESULTS
Dosimetry
The reported CTDIvol.e and the measured dose (Farmer chamber and MOSFET) were compared for single volume scans of the CTDI phantom. Figure 4 shows the mean and standard deviation of the CTDIw measurements over five trials. The CTDIw determined from the Farmer chamber measurements were found to agree with CTDIvol.e only to within ∼30%. The source of systematic discrepancy (CTDIvol.e consistently less than Farmer chamber CTDIw) is under investigation and is likely associated with an inability of the pencil chamber method to completely integrate long tails of x-ray scatter. While the discrepancy is notable, the reported values of CTDIvol.e were taken as the abscissa in plots of Az versus dose, since it gives the most “portable” interpretation of results below (e.g., with respect to other scanners and other institutions). The resulting Dthresh values (i.e., the dose at which Az was reduced to 0.95) therefore correspond to CTDIvol.e (mGy); the relationship to Dcenter or CTDIw as determined by Farmer chambers in the long acrylic phantom is given in Fig. 4.
Figure 4.
Comparison of CTDIvol.e (as reported by the scanner) and Dcenter, or CTDIw (as measured by Farmer chambers and MOSFETs in a long 32 cm diameter CTDI phantom for one x-ray tube revolution). For Dcenter and CTDIw, the mean and standard deviation over five trials are shown.
Effect of body habitus on detectability
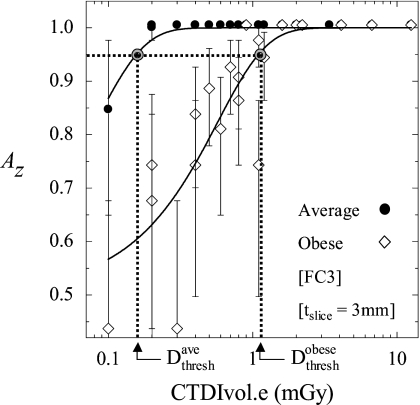
Figure 5 illustrates a fit of Az versus dose for both the average and obese body habitus. For the average habitus, we observe detectability maintained to a fairly low dose, below which detectability rapidly declines. For the obese habitus, the rapid decrease in detectability occurs at a significantly higher dose for a given set of reconstruction parameters.
Figure 5.
Observer performance plotted as a function of dose for average and obese body habitus. Logistic functions were used to fit the measurement to a sigmoid (solid curves). Calculation of Dthresh is illustrated graphically as the dose at which observer performance falls to 0.95. Examples shown are for fixed reconstruction filter (FC3) and slice thickness (tslice=3 mm).
To reduce the scope of experimental parameters investigated yet maintain the broad range of dose under consideration, results obtained at various kVp could be pooled without significantly affecting the resulting curve fits or Dthresh values. Of course, image quality in the range 80–120 kVp would be expected to vary somewhat with beam quality (e.g., due to beam-hardening effects), but the curve fits of Az versus dose were not significantly affected by the choice of kVp. Specifically, removal of data points of specific beam energies from the fit did not result in considerable shifts in the curve or in Dthresh. Therefore, data resulting from 80, 100, and 120 kVp were pooled in single curve fits of Az versus dose for a given body habitus, reconstruction filter, and slice thickness. In addition, two scans were rejected as outliers from the analysis–(80 kVp, 105 mAs) and (80 kVp, 35 mAs)—as they exhibited a significant ring-like artifact in the image that distorted the nodule.
At the dose level where Az for the average habitus is 0.95, is just 0.6, indicating an essentially undetectable nodule. is approximately seven times . Averaging over all reconstruction settings, for the obese habitus was found to be 8.6 times higher than , illustrating the significantly reduced observer performance at low doses for the obese habitus.
Effect of reconstruction technique
MTF
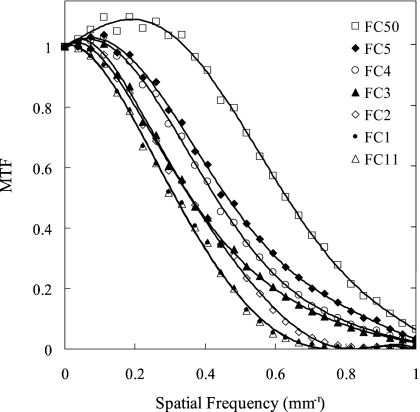
The MTFs corresponding to the seven reconstruction filters are plotted in Fig. 6. Filters FC1 and FC11 exhibit the smoothest (low-pass) characteristic, descending to 10% MTF at ∼0.55 mm−1. Filters FC2–FC5 exhibit increasingly higher frequency response, with FC4 and FC5 exhibiting a slight edge-enhancement effect (i.e., MTF slightly greater than 1.0). The FC50 filter displays the highest MTF, with a strong edge-enhancement effect and descending to 10% MTF at ∼0.94 mm−1.
Figure 6.
MTF corresponding to the seven reconstruction filters investigated in this work. The response is plotted up to the Nyquist frequency.
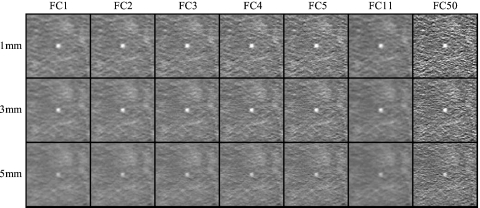
The blur associated with smoother filters suppresses noise, while the sharper filters amplify high-frequency noise. This is illustrated in Fig. 7, in which the ROIs for all reconstruction settings are displayed for the obese body habitus.
Figure 7.
Example images in a region about a 3.2 mm simulated lung nodule for all combinations of reconstruction filter and slice thickness investigated. Examples were acquired at 100 kVp, 105 mAs (CTDIvol.e=6.7 mGy) in the obese phantom configuration. For purposes of illustration, the nodule is shown at the center of each image.
As expected, for a given slice thickness, smoother filters produce images with less noise, and for a given filter, high-frequency fluctuations are reduced with slice thickness. Furthermore, at tslice=5 mm contrast is noticeably reduced due to partial volume averaging of the small (3.2 mm diameter) simulated nodule.
Effect of reconstruction filter on detectability
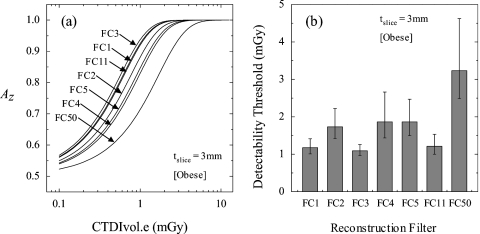
The effect of reconstruction filter on observer performance is shown in Fig. 8a, while Fig. 8b presents the corresponding Dthresh for each filter. Figure 8 suggests that for tslice=3 mm and obese habitus, images reconstructed at FC3 showed the best performance, followed closely by the smooth FC1 and FC11 filters. This suggests that at low dose, noise becomes the limiting factor in the detection of small nodules. The filters FC2, FC4, and FC5 differed only slightly in detection performance, whereas FC50 performed considerably worse than all other filters. These results demonstrate that knowledgeable selection of reconstruction filters can reduce the dose required to detect nodules in obese patients (e.g., by up to 2 mGy for the case in Fig. 8).
Figure 8.
Effect of reconstruction filter on Dthresh (tslice=3 mm; obese configuration). (a) Observer performance plotted as a function of dose for seven reconstruction filters. (b) Comparison of Dthresh across seven reconstruction filters.
Effect of reconstruction slice thickness
The value Dthresh was found to depend also on slice thickness. Figure 9 shows an increase in Dthresh with larger slice thickness for both the average and obese phantom configurations reconstructed with FC11. While such a clear trend was not evident for all filters, the 5 mm slice reconstructions generally resulted in poorer diagnostic performance (i.e., higher Dthresh), and the 1 and 3 mm slices exhibited comparable performance for the 3.2 mm nodule detection task.
Figure 9.
Effect of slice thickness on Dthresh for average and obese habitus. The cases shown correspond to the FC11 reconstruction filter.
Statistical comparison of reconstruction techniques
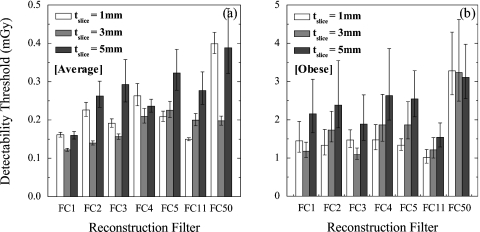
The effect of all reconstruction filters and slice thicknesses on observer performance is summarized in Fig. 10 for both the average and obese body habitus. To compare performance among various cases, two-tailed, unequal-variance paired t-tests were conducted across all filter and slice thickness combinations. Table 2 summarizes a subset of the p values from these tests, with italicized text indicating a statistically significant difference in performance at 95% confidence level.
Figure 10.
Effect of reconstruction techniques on Dthresh for (a) average and (b) obese body habitus. Note the order-of-magnitude scale factor between y axes of (a) and (b), discussed below.
Table 2.
Summary of p values from paired t-tests of distributions with mean Dthresh and standard deviation σDthresh. Each p value corresponds to the pair of conditions specified by the rows and columns of the table, and italicized values correspond to cases for which a statistically significant difference was observed (p value <0.05). Cases summarized here compare tslice=1 mm to tslice=1, 3, and 5 mm for all filters and for average and obese habitus. [Similar analysis of Dthresh for tslice=3 and 5 mm (not shown) was also conducted.]
| Average body habitus,1 mm | Obese body habitus,1 mm | ||||||||||||||
|---|---|---|---|---|---|---|---|---|---|---|---|---|---|---|---|
| FC1 | FC2 | FC3 | FC4 | FC5 | FC11 | FC50 | FC1 | FC2 | FC3 | FC4 | FC5 | FC11 | FC50 | ||
| 1 mm | FC1 | – | – | – | – | – | – | – | – | – | – | – | – | – | – |
| FC2 | 0.000 | – | – | – | – | – | – | 0.408 | – | – | – | – | – | – | |
| FC3 | 0.009 | 0.049 | – | – | – | – | – | 0.480 | 0.363 | – | – | – | – | – | |
| FC4 | 0.000 | 0.140 | 0.010 | – | – | – | – | 0.479 | 0.376 | 0.496 | – | – | – | – | |
| FC5 | 0.001 | 0.220 | 0.155 | 0.044 | – | – | – | 0.389 | 0.500 | 0.308 | 0.344 | – | – | – | |
| FC11 | 0.053 | 0.000 | 0.000 | 0.000 | 0.000 | – | – | 0.146 | 0.185 | 0.054 | 0.098 | 0.080 | – | – | |
| FC50 | 0.000 | 0.000 | 0.000 | 0.000 | 0.000 | 0.000 | – | 0.017 | 0.010 | 0.012 | 0.015 | 0.007 | 0.002 | – | |
| 3 mm | FC1 | 0.000 | 0.000 | 0.000 | 0.000 | 0.000 | 0.000 | 0.000 | 0.263 | 0.337 | 0.165 | 0.212 | 0.264 | 0.262 | 0.004 |
| FC2 | 0.004 | 0.000 | 0.000 | 0.000 | 0.000 | 0.075 | 0.000 | 0.298 | 0.210 | 0.276 | 0.300 | 0.166 | 0.043 | 0.036 | |
| FC3 | 0.292 | 0.000 | 0.004 | 0.000 | 0.000 | 0.197 | 0.000 | 0.190 | 0.244 | 0.080 | 0.135 | 0.125 | 0.357 | 0.003 | |
| FC4 | 0.008 | 0.260 | 0.201 | 0.059 | 0.489 | 0.001 | 0.000 | 0.267 | 0.203 | 0.255 | 0.270 | 0.178 | 0.072 | 0.069 | |
| FC5 | 0.002 | 0.491 | 0.074 | 0.148 | 0.251 | 0.000 | 0.000 | 0.240 | 0.169 | 0.218 | 0.239 | 0.134 | 0.040 | 0.058 | |
| FC11 | 0.012 | 0.135 | 0.330 | 0.027 | 0.330 | 0.001 | 0.000 | 0.301 | 0.381 | 0.224 | 0.258 | 0.339 | 0.258 | 0.006 | |
| FC50 | 0.003 | 0.093 | 0.344 | 0.018 | 0.265 | 0.000 | 0.000 | 0.043 | 0.031 | 0.038 | 0.042 | 0.026 | 0.012 | 0.486 | |
| 5 mm | FC1 | 0.434 | 0.001 | 0.016 | 0.000 | 0.001 | 0.174 | 0.000 | 0.171 | 0.125 | 0.157 | 0.170 | 0.106 | 0.042 | 0.131 |
| FC2 | 0.002 | 0.169 | 0.022 | 0.499 | 0.068 | 0.000 | 0.001 | 0.141 | 0.107 | 0.131 | 0.141 | 0.094 | 0.044 | 0.207 | |
| FC3 | 0.008 | 0.121 | 0.032 | 0.314 | 0.065 | 0.004 | 0.038 | 0.254 | 0.190 | 0.240 | 0.256 | 0.164 | 0.063 | 0.070 | |
| FC4 | 0.000 | 0.347 | 0.013 | 0.209 | 0.104 | 0.000 | 0.000 | 0.099 | 0.074 | 0.091 | 0.098 | 0.064 | 0.029 | 0.284 | |
| FC5 | 0.001 | 0.040 | 0.007 | 0.157 | 0.017 | 0.000 | 0.097 | 0.055 | 0.032 | 0.040 | 0.050 | 0.020 | 0.005 | 0.223 | |
| FC11 | 0.003 | 0.133 | 0.023 | 0.392 | 0.060 | 0.001 | 0.007 | 0.425 | 0.319 | 0.426 | 0.440 | 0.272 | 0.065 | 0.018 | |
| FC50 | 0.003 | 0.026 | 0.008 | 0.072 | 0.015 | 0.002 | 0.451 | 0.016 | 0.009 | 0.011 | 0.014 | 0.005 | 0.001 | 0.434 | |
The loss in detectability at larger body habitus is evidenced by an average increase in Dthresh by a factor of 8.6±2.8 for equivalent reconstruction settings. Even conditions yielding the worst Dthresh for the average body demonstrated significantly improved performance compared to the obese habitus (a factor of ∼2.5 in Dthresh, p=0.006). Thus, detectability is significantly reduced for the obese habitus, and the dose required to achieve Az∼0.95 differs by a factor of ∼6–16 (depending on reconstruction technique). The higher level of statistical significance observed for the average habitus results (i.e., lower p values in Table 2) are due to reduced observer variability in nodule detection. The high noise and low detectability conditions of the obese habitus increased the σDthresh and thus the p values of comparison.
In addition to the effects of body size, Fig. 10 and Table 2 reveal the effects of reconstruction slice thickness. For the average body habitus, tslice=5 mm yielded poorer detectability than tslice=3 mm for the FC3, FC5, and FC11 filters (p<0.042), and tslice=3 mm demonstrated improved detectability compared to tslice=1 mm for FC1, FC2, FC3, and FC50 (p<0.010). For the obese habitus, the Dthresh for tslice=1 mm and FC11 (second-to-last column of Table 2) is significantly lower than that of FC2, FC5, and FC50 at tslice=3 mm (p<0.043) but also filters FC1 and FC4 at tslice=5 mm (p<0.044). Though the results do not exhibit a statistically significant difference between Dthresh values for tslice=1 and 3 mm reconstructions for obese body habitus, the trends clearly demonstrate inferior performance for tslice=5 mm for both body types.
While results indicate improved performance for tslice=1 and 3 mm, they also demonstrate the effects of reconstruction filter on detectability for these slice thicknesses. FC50 clearly demonstrated poorer performance compared to other filters, as evident in Fig. 10 and throughout Table 2. For example, for the average body habitus at tslice=1 mm, FC50 exhibited a higher Dthresh than all other filters at both slice thicknesses (p<0.001). For tslice=3 mm, the smoother filters (FC1– FC3) performed better than the sharper ones (FC4, FC5, and FC50). For the average body habitus, optimal performance was obtained using the smooth filters: FC1 and FC2 at tslice=3 mm followed by FC1 and FC11 at tslice=1 mm. For the obese habitus, the FC50 filter at tslice=1 mm was significantly worse than FC1–FC3, and FC11 (p<0.036) for both tslice=1 and 3 mm reconstructions. At tslice=3 mm, FC3 demonstrated optimal performance, followed by FC1 and FC11. At tslice=1 mm, the smooth filters did not differ from one another significantly, although FC11 exhibited the lowest Dthresh.
DISCUSSION
Factors affecting image quality: Acquisition technique, reconstruction technique, and body habitus
To evaluate diagnostic performance, Az was plotted against CTDIvol.e, an estimation of dose to an acrylic 32 cm diameter CTDI phantom. However, this estimate does not account for body size. One reason the Dthresh values increase by nearly an order of magnitude (8.6-fold) for the obese habitus is illustrated in Figs. 11a, 11b. The obese habitus image in Fig. 11b is significantly degraded by high noise, blurred edges, and reduced contrast. These scans reported an identical CTDIvol.e but the actual dose measured in the lung (Dlung) varied by a factor of 2 (3.6 and 1.8 mGy for the average and obese configurations, respectively). The reduced dose to the lung (i.e., higher attenuation by surrounding fat) begins to explain the poor image quality. However, even at similar lung dose, as in Figs. 11c, 11d, we can see that this is not the only factor; when comparing detectability as a function of Dlung, [calculated analogous to Dthresh, but on a plot of Az versus Dlung (instead of CTDIvol.e)] was still 2.5±0.8 times higher for the obese habitus.
Figure 11.
Example images at similar CTDIvol.e [(a) and (b)] and measured dose Dlung [(c) and (d)] for average [(a) and (c)] and obese [(b) and (d)] configurations (reconstructed with the FC3 filter at tslice=3 mm). Images in (a) and (b) were acquired at (100 kVp, 35 mAs), giving CTDIvol.e=2.2 mGy and measured doses of (a) Dlung=3.6 mGy and (b) Dlung=1.8 mGy. By comparison, images (c) and (d) were acquired at (c) Dlung=1.4 mGy, CTDIvol.e=0.8 mGy (120 kVp, 7 mAs) and (d) Dlung=1.5 mGy, CTDIvol.e=2.0 mGy (120 kVp, 17.5 mAs).
Several factors contribute to lower detectability in large patients. The well-known relationship11
| (8) |
describes the dependence of image noise on the dose entering a cylindrical phantom (Do) and includes the attenuation of the object (eμd) as well as slice thickness (tslice) and reconstruction filter (contained in the bandwidth integral K). Even with all reconstruction parameters held fixed, the dose delivered to the patient (e.g., Dlung measured in the organ) does not determine the noise; rather, the noise depends on the dose to the detector, Ddetector, which depends on body habitus [related to d in Eq. 8] and is less than Dlung due to attenuation in the body. In a cylindrical phantom, the relationship can be considered as σ2∝1/Ddetector, where Ddetector=Dcentere−μd/2. For larger patients, Ddetector is significantly reduced, and the noise increases (even for equivalent Dlung),12 an effect evident in Fig. 11.
In addition, larger body habitus amplifies the effects of x-ray scatter, beam hardening, and electronics noise. The additional 10 cm simulated tissue (SuperFlab™) increases the scatter-to-primary ratio at detector, diminishing contrast and introducing cupping and streak artifacts. Similarly, beam hardening increases with the bulk of material presented to the x-ray beam, which may lead to cupping or streak artifacts, although such effects were not particularly evident in the small ROIs considered in this study. Finally, the reduced x-ray fluence at the detector increases the relative contribution of electronic noise at very low dose. Quantum and electronic noise are proportional to and 1/D, respectively,13 so whereas CT is typically quantum noise limited, at low technique settings (kVp and mAs) and large body habitus the relative effect of electronic noise rises.
In the results above, CTDIvol.e was used to analyze Dthresh, below which detectability rapidly declines. The correspondence of CTDIvol.e and the CTDIw and Dcenter measured using Farmer chambers in a long 32 cm diameter acrylic cylinder is given in Fig. 4. Results indicate that to achieve a high level of diagnostic accuracy (i.e., Az>0.95 as in current clinical techniques), the CTDIvol.e differed significantly–e.g., by a factor of ∼8.6 between the average and obese configurations modeled in this study. Results also demonstrate the potential for further dose reduction in average-sized patients given knowledgeable choice of reconstruction technique.
Optimal reconstruction technique selection
Radiologists consider numerous complex characteristics, including shape, size, and contrast, in searching for nodules. Small lung nodules of clinical consequence are characterized by spheres of minimum diameter 3 mm and contrast ∼600–700 HU to the background, as simulated in this phantom study. Proper selection of reconstruction techniques may preserve the ability to visualize these attributes, which become degraded by noise at low dose.
Selection of the reconstruction filter controls the spatial frequency response in the axial plane, with smooth filters suppressing noise at the cost of spatial resolution. The results above suggest that at very low doses, it is noise (rather than spatial resolution) that limits detectability. This is evidenced by the downward trend in Dthresh for progressively smoother filters. It explains the poor performance of the FC50 sharp filter and the superior performance of FC1 and FC11 in the obese and average configurations. For the obese habitus, FC3 also performed well, perhaps because it provided a balance between noise reduction and edge preservation. Although sharp filters have become increasingly popular due to their ability to enhance visualization of fine anatomical structure, in the dose conscious present it is important to recognize the limitations of sharp filters and focus on techniques that allow noise reduction for specific diagnostic tasks, such as small-nodule detection and surveillance.
Similarly, the effect of slice thickness should be carefully considered in identifying low-dose techniques. Reconstruction slice thickness affects not only the image noise but also the contrast of small nodules (due to partial volume averaging effects). As is evident in Fig. 7, large slice thicknesses smooth the noise but can also decrease nodule contrast to a significant degree. The results above suggest inferior performance for tslice=5 mm compared to 1 and 3 mm, likely due to this loss of contrast.
Results are consistent with the notion that to optimize detectability in lung CT, the slice thickness should be equal to or less than the minimum lesion size of interest. Results showed no significant loss in detectability when tslice=3 mm compared to when tslice=1 mm in the obese configuration. Combined with the higher performance of smoother reconstruction filters, this suggests a trade-off between the larger partial volume averaging effect and noise reduction for nodules smaller than the slice thickness. For other nonpulmonary thoracic imaging tasks, such as identification of lymphomas or metastases of the mediastinum, involving structures exceeding 3 mm, radiologists in clinical practice enjoy the efficiency of larger slice thickness as it reduces the total number of slices without sacrificing diagnostic performance. However, results indicate that to maintain nodule detectability in low-dose CT screening or surveillance, the slice thickness should be capped at 3 mm, that is, at the minimum nodule size of interest.
The optimal reconstruction factors identified above yielded Dthresh values lower than current clinical low-dose (5 mGy) and ultralow-dose (1 mGy) protocols. For average body habitus, Dthresh was 0.23±0.08 mGy. The highest (i.e., worst) value of Dthresh was 0.40 mGy for the sharp FC50 filter at tslice=1 mm, the noisiest combination of reconstruction techniques. These values are significantly below the lowest dose protocols at our institution. For the obese habitus, Dthresh was 1.90±0.71 mGy. The worst case gave Dthresh=3.28 mGy. While these values of Dthresh are within the range of clinical low-dose protocols, only the best reconstruction technique selections approached the ultralow-dose levels.
Limitations of the current study
No study is without its limitations, and those associated with the current study should be acknowledged. First and foremost, the study is based on a phantom lacking the rich anatomical complexity of the human lung. Second, the imaging task was specified and unvarying—detection of a simulated small solid nodule—analogous to surveillance of a known nodule but an oversimplification of complex diagnostic tasks. Studies have demonstrated that nodules larger than 3.2 mm in diameter may also be difficult to detect but such nodules were not considered here.10 Third, the 9AFC tests, though well suited to phantom studies involving a large number of cases, do not reproduce the complexity of a true diagnostic search in a real chest image. Furthermore, observers may have used different criteria to guide their 9AFC selections, such as edge detection, shape, or contrast, which may also be true in the clinic but hinders our ability to evaluate the effect of each criterion separately on detectability. Another difference from the clinical scenario is the absence of motion artifacts, which are reduced but not eliminated in volumetric CT with high gantry rotation speed. The cone-beam artifact may also affect the resolution of nodules differentially based on their location in the beam; however, the nodules in this study were in fairly close proximity (within a few cm in the z direction) to the central plane, so the effects of this artifact on detectability were probably small. Another limitation is the inability to scroll adjacent slices in viewing suspicious structures in the ROIs. These limitations considered together likely resulted in higher observer performance (i.e., lower Dthresh) than might be expected in the clinic; however, the overall trends observed are expected to hold—specifically, the reconstruction parameters (filter and slice thickness) leading to optimal performance and the significant difference in detectability limits (a factor of ∼8.6 in dose) between average and obese body habitus.
CONCLUSIONS
Knowledgeable selection of acquisition and reconstruction techniques can reduce the dose required for accurate detection of small lung nodules. The low-dose threshold Dthresh for nodule detection in the obese body size increased in comparison to the average body size by a factor of 8.6 (in terms of CTDIvol.e) and 2.5 (in terms of absolute dose measured in the lung). Results suggest that images are degraded in the larger habitus mainly due to increased noise (reduced fluence reaching the detector) rather than from scatter, beam hardening, or spatial resolution effects. To maintain a high level of detectability across a spectrum of patient sizes, it is necessary to knowledgeably adjust the dose and reconstruction parameters. The low-dose detectability limits identified in this study suggest that current clinical low-dose protocols [e.g., 120 kVp, 25 mAs, CTDIvol.e=1.0 mGy] are appropriate for large patients and suggest the potential for further dose reduction in average-sized patients.
Proper selection of reconstruction filter and slice thickness was found to maintain detectability at low doses. While sharp filters (e.g., FC50) demonstrated high MTF, performance in nodule detection was significantly degraded at low doses. Smoother filters (e.g., FC1, FC3, and FC11) performed best, reducing the threshold for detection by up to a factor of ∼3 (e.g., for the obese habitus and tslice=3 mm, Dthresh=1.1 mGy for FC3 compared to 3.2 mGy for FC50). Thicker slices also suppressed image noise, but for slice thickness exceeding the nodule diameter, detectability was degraded due to loss in nodule contrast (partial volume averaging effect). For a 3.2 mm diameter nodule, a slice thickness of 1 or 3 mm slices was superior to 5 mm by a factor of ∼2 in Dthresh (e.g., for the obese habitus and FC3 filter, Dthresh=1.1 mGy for tslice=3 mm, compared to 1.9 mGy for tslice=5 mm). An empirical and theoretical understanding of the dependence of lung nodule detectability on dose, reconstruction parameters, and patient size facilitates the implementation of ultralow-dose imaging protocols that are increasingly patient specific (particularly with respect to body habitus) and maintain a high level of diagnostic accuracy in the detection, characterization, and surveillance of early stage lung nodules.
ACKNOWLEDGMENTS
The contributions of Noe Hinojosa (Toshiba Medical Systems) and CT technologists and engineers at Toronto General Hospital (TGH) are gratefully acknowledged. Thanks also to volunteer observers from the Image Guided Therapy (IGTx) Laboratory at the Ontario Cancer Institute. This work was supported in part by the Radiology Research Fund at TGH, a scholarship from the Natural Sciences and Engineering Research Council (CGS M), the Division of Clinical Engineering in the Institute of Biomaterials and Biomedical Engineering at the University of Toronto, and the National Institute of Health (Grant No. R01-CA112163-03).
References
- Remy-Jardin M., Remy J., Giraud F., and Marquette C. H., “Pulmonary nodules: Detection with thick-section spiral CT versus conventional CT,” Radiology 187, 513–520 (1993). [DOI] [PubMed] [Google Scholar]
- Piyaviset N. et al. , “Small incidental pulmonary nodules: How useful is short term interval CT?,” J. Thorac. Imaging 20, 5–9 (2005). [DOI] [PubMed] [Google Scholar]
- Paul N. S., Siewerdsen J. H., Patsios D., and Chung T. B., “Investigating the low-dose limits of multidetector CT in lung nodule surveillance,” Med. Phys. 10.1118/1.2768866 34, 3587–3595 (2007). [DOI] [PubMed] [Google Scholar]
- Yankelevitz D. F. et al. , “Small pulmonary nodules: Evaluation with repeat CT—Preliminary experience,” Radiology 212, 561–566 (1999). [DOI] [PubMed] [Google Scholar]
- Revel M. P. et al. , “Pulmonary nodules: Preliminary experience with three-dimensional evaluation,” Radiology 10.1148/radiol.2312030241 231, 459–466 (2004). [DOI] [PubMed] [Google Scholar]
- Valentin J., “Managing patient dose in multi-detector computed tomography (MDCT),” Ann. ICRP 37, 1–79 (2007). [DOI] [PubMed] [Google Scholar]
- Chiarot C. B., Siewerdsen J. H., Haycocks T., Moseley D. J., and Jaffray D. A., “An innovative phantom for quantitative and qualitative investigation of advanced x-ray imaging technologies,” Phys. Med. Biol. 50, 297 (2005). [DOI] [PubMed] [Google Scholar]
- Fujita H., Tsia D., Itoh T., Doi K., Morishita J., Ueda K., and Ohtsuka A., “A simple method for determining the modulation transfer function in digital radiography,” IEEE Trans. Med. Imaging 10.1109/42.126908 11, 34–39 (1992). [DOI] [PubMed] [Google Scholar]
- Dixon R. L. and Ballard A. C., “Experimental validation of a versatile system of CT dosimetry using a conventional ion chamber: Beyond CTDI100,” Med. Phys. 10.1118/1.2757084 34, 3399–3413 (2007). [DOI] [PubMed] [Google Scholar]
- Burgess A. E., Jacobson F., and Judy P., “Mass discrimination in mammography: Experiments using hybrid images,” Acad. Radiol. 10, 1247–1256 (2003). [DOI] [PubMed] [Google Scholar]
- Barrett H. H., Gordon S. K., and Hershel R. S., “Statistical limitations in transaxial tomography,” Comput. Biol. Med. 10.1016/0010-4825(76)90068-8 6, 307–323 (1976). [DOI] [PubMed] [Google Scholar]
- Huda W., Scalzetti E. M., and Levin G., “Technique factors and image quality as functions of patient weight in abdominal CT,” Radiology 217, 430–435 (2000). [DOI] [PubMed] [Google Scholar]
- Tward D. J. and Siewerdsen J. H., “Cascaded systems analysis of the 3D noise transfer characteristics of flat-panel cone-beam CT,” Med. Phys. 10.1118/1.3002414 35, 5510–5529 (2008). [DOI] [PMC free article] [PubMed] [Google Scholar]


