Abstract
Burgess et al. [Med. Phys. 28, 419–437 (2001)] showed that the power spectrum of mammographic breast background follows a power law and that lesion detectability is affected by the power-law exponent β which measures the amount of structure in the background. Following the study of Burgess et al., the authors measured and compared the power-law exponent of mammographic backgrounds in tomosynthesis projections and reconstructed slices to investigate the effect of tomosynthesis imaging on background structure. Our data set consisted of 55 patient cases. For each case, regions of interest (ROIs) were extracted from both projection images and reconstructed slices. The periodogram of each ROI was computed by taking the squared modulus of the Fourier transform of the ROI. The power-law exponent was determined for each periodogram and averaged across all ROIs extracted from all projections or reconstructed slices for each patient data set. For the projections, the mean β averaged across the 55 cases was 3.06 (standard deviation of 0.21), while it was 2.87 (0.24) for the corresponding reconstructions. The difference in β for a given patient between the projection ROIs and the reconstructed ROIs averaged across the 55 cases was 0.194, which was statistically significant (p<0.001). The 95% CI for the difference between the mean value of β for the projections and reconstructions was [0.170, 0.218]. The results are consistent with the observation that the amount of breast structure in the tomosynthesis slice is reduced compared to projection mammography and that this may lead to improved lesion detectability.
INTRODUCTION
When determining the contrast threshold for lesion detection as a function of lesion size, Burgess et al.1 found a surprising result for mammographic backgrounds. Observer experiments (2-AFC) were performed using realistic or simulated mass lesions digitally added to normal mammographic structure. They found that the contrast threshold for detection increased with lesion size for lesions larger than 1 mm.
They also found that the power spectrum (PS) of normal mammographic tissue followed a power law with PS(f)=C∕fβ, where f is the frequency, C is the power spectrum magnitude, and β is the power spectrum exponent.2 For a collection of screen-film mammograms, mean β was found to be 2.83 (standard deviation of 0.35) and this explained the results of the observer studies: For a signal with increasing size and fixed amplitude, the energy spectrum is increasingly concentrated at lower frequencies. Hence for a larger lesion size, the ratio of signal energy and mammographic structure energy decreases. Qualitatively, this effect was observed for mammographic as well as filtered noise backgrounds when the filtered noise background had the same power spectrum as the mammograms. Subsequently, human and model observer performances were measured for signal detection in power-law backgrounds3 by determining the signal amplitude required to reach a given performance in backgrounds with different β. Contrast-detail diagrams were generated by plotting log-signal amplitude as a function of log-lesion size. For both human and model observers, a linear relationship between slope m in the CD diagram and β was found,m=(β−2)∕2. Therefore, for β>2, signal detectability (for constant amplitude) decreases as lesion size increases.
In mammography the anatomical information in the three-dimensional (3D) breast is projected into a two-dimensional (2D) image, resulting in overlapping breast structure. Particularly in dense breasts, lesions can be hidden under normal breast tissue. Digital breast tomosynthesis (DBT) takes multiple images of a breast from approximately ten angles, and a 3D image of the breast is reconstructed. DBT is believed to improve lesion detection by reducing the amount of overlapping breast structure in each slice of the reconstructed image.4
The purpose of this work was to compare the amount of background structure present in the tomosynthesis slice to the projection data and to investigate whether the amount of background structure in tomosynthesis slices is reduced. We will quantify background structure in terms of β.
A similar study has been carried out to characterize anatomic structure in breast CT. In CT, the geometry allows for approximate recovery of the imaged volume. The predicted relationship between β in the coronal breast CT slices and the projection data, βsl=βproj−1, was confirmed.5
In this paper we first examine how β changes between the projection images and the reconstructed slices. Our hypothesis for this study is that β should be lower in the reconstructed slices compared to the projection images.
MATERIALS AND METHODS
Image database
The tomosynthesis database was obtained from Massachusetts General Hospital and consisted of 78 full-field digital mediolateral oblique (MLO) view projections and their corresponding reconstructions. The breasts varied in thickness and breast density and had been diagnosed as lesion-free; however, the patients had a lesion in the other breast. For each case, 11 projections had been taken covering an angle of 50° with approximately uniform increments. The projection resolution was 100 μm. The acquisition geometry is described in detail in Ref. 6. The reconstructions were created with a standard maximum likelihood-expectation maximization algorithm7 with eight iterations. Each slice had a resolution of 100 μm in the plane parallel to the detector and 1 mm between the reconstructed slices. The number of reconstructed slices varied between 33 and 85 depending on the compressed breast thickness. The breast area touching the compression paddle was assumed to display constant thickness.
Cases that failed in the reconstruction had clusters of microcalcifications and displayed a large amount of dead pixels or peculiar features such as silicone, were excluded. The remaining 55 cases were used in the final evaluation.
Projection data were in units of log exposure (log E), since it was preprocessed for reconstruction throughP(x,y)=−log(I(x,y)∕I0) where I(x,y) is the original projection data in detector pixel values (PVs) and I0 is the detector PV corresponding to direct exposure. To our knowledge, units for tomosynthesis reconstructed slices have not been defined. However, voxel values of the reconstructed tomosynthesis volume represent an estimate of attenuation values such that the line integrals through the volume along the x-ray path L result in the projection data at x-ray source angle θ, . Due to the limited angular scan, scatter, and beam hardening, it may not be possible to obtain an accurate estimate of attenuation values in tomosynthesis.
Data preparation
Preprocessing
In order to remove nonbreast area, a histogram of the pixel values in each projection and reconstructed slice was calculated. The pixel value threshold was found between the two peaks in the histogram displaying, respectively, the breast and background pixels. A binary image of the breast was created according to this threshold. To remove the breast edges and parts of varying thickness this binary image was eroded with a disk of radius of 4.8 mm (48 pixels). The radius was chosen empirically. This operation also excluded some artifacts at the image edges.
The pectoralis muscle was removed by finding the triangle with corners in the upper anterior part of the breast, the upper posterior image corner, and a point across from the nipple on the posterior edge of the image. These image coordinates were found by taking the derivative of the specific rows and columns in the binary image and then recording the points where it was different from zero. The pixels in this triangle were given the value zero.
Artifacts at the top and bottom of the image were caused by the appearance of either the compression paddle in the projection or by breast tissue that were not imaged in all 11 projections. The artifact areas displayed a “staircase” effect across the top and bottom of the image. The positions of the staircase artifacts in the reconstructed slices were calculated and the corresponding pixel values were set to zero.
When the reconstructed images were displayed slice by slice for each case, it was found that the ten first and ten last slices tended to show little structure. Anatomically, the first 5 mm under the skin is primarily adipose tissue and does not contain fibroglandular tissue. Furthermore, the grid on which the breast volume is reconstructed was 5 mm thicker than the recorded breast thickness and therefore extended a few slices beyond the actual breast. Slices at depths where no actual structure is present in the object will merely contain blur from breast slices above (or below). We omitted these reconstructed slices from our analyses.
Generate regions of interest
In the remaining area, square patches with a side length of 12.8 mm (128 pixels) were generated. Patch size was chosen empirically while ensuring that it was large enough to allow for an accurate estimate of β but not too large so as to emphasize nonuniformities in the image. Furthermore, a smaller patch size allowed to more densely sample smaller breasts. Following the the study of Burgess on mammographic structure,2 the regions of interest (ROIs) had 50% overlap; it was asssumed that the correlation between patches was negligible.
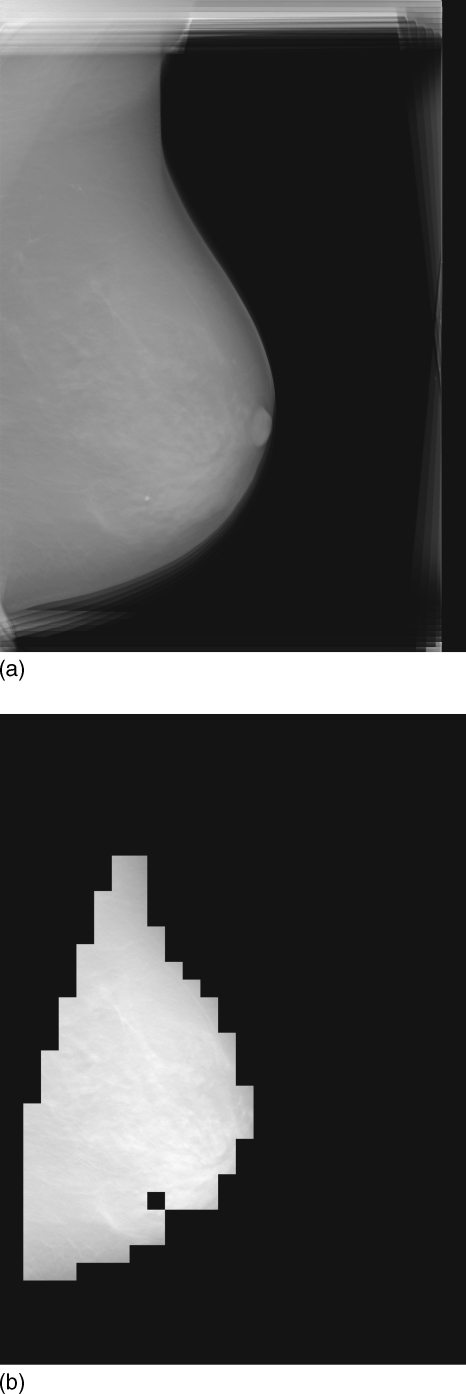
The histogram of pixel values of each ROI was calculated to define exclusion criteria. For example, if the mean of the leftmost bin in a two-bin histogram was less than 0.2 times the ROI maximum pixel value it was found to contain the background. The ROIs displaying the background, a benign microcalcification, or artifacts were excluded from the evaluated data set. Figure 1 shows an original reconstructed slice and the evaluated region for that slice.
Figure 1.
A typical tomosynthesis slice (top) and the region evaluated in this study (bottom). The single black box inside the evaluated region corresponds to a ROI that was rejected because it contains a high-contrast benign calcification, visible in the original slice.
Spectral analysis
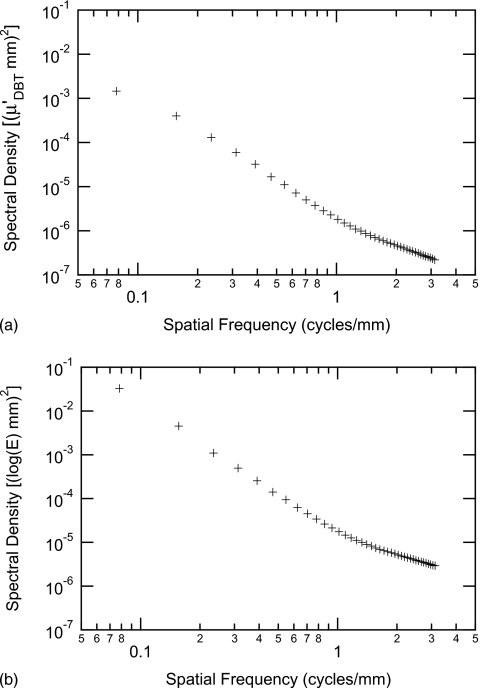
The spectral analysis of each ROI was done following the method of Burgess.2 A Hann data taper was used to reduce the impact of spectral leakage.8 The 1D spectral density was computed by radially averaging the squared modulus of the 2D Fourier transform of each ROI. No anisotropy was found in the ROIs, including those extracted from reconstructed slices. We attributed this to the rapid fall-off of the spectral density, which may overwhelm nonisotropies arising from tomosynthesis imaging. For the projection data, the spectral density unit was (log E×mm)2, while for reconstructed data, the spectral density unit was . The PS of the ensemble of ROIs was estimated by averaging the 1D spectral densities, where the ensemble included all image data for a given condition (projection or reconstructed data). From the PS, the region of constant slope in a log-log plot was determined to be in the range of [0.15,0.70] cycles∕mm. The PS for the projection data and reconstructed slices for one patient data set are shown in Fig. 2.
Figure 2.
Estimated power spectrum of all ROIs extracted from the reconstructed slices (a) and from the projection images (b) of one patient case. Note that the slope is approximately constant in the range of [0.15,0.70] cycles∕mm that was used for the fit.
Since each individual tomosynthesis projection is taken with a lower x-ray dose than a normal mammogram, the stochastic noise component (i.e., x-ray quantum and detector noise) is increased. For spatial frequencies less than approximately 1.0 cycles∕mm the increased stochastic noise has very little effect on the overall power spectrum which is dominated by breast structure at low frequencies. Nevertheless the spatial frequencies at which stochastic noise becomes important are shifted to a lower value compared to a conventional mammogram. The reliable range of the PS is therefore more narrow for tomosynthesis images than mammograms.
A first order polynomial fit between the log-spectral densities and the log frequencies in the chosen range was used to determine the magnitude and slope of the power spectrum. Since the frequency range was [0.15,0.70] cycles∕mm and the frequency components had the size 1∕(128 pixels×0.100 mm∕pixel)=0.078 cycles∕mm, seven data points were used in the polynomial fit. For each ROI, the slope of the log-spectral density in the chosen range, β, was recorded. The root mean squared error (rmse) was calculated for each polynomial fit to determine whether the assumption of a first order polynomial was appropriate.
The mean β (⟨β⟩) for an image was determined by averaging the β values from all ROIs extracted from that image. For the projection data of a given case, ⟨β⟩ was found by averaging all β values from ROIs extracted from the corresponding projection images. The mean β for the reconstructed slices was found by averaging β of all ROIs extracted from the reconstructed slices for a given patient case. In the following, the notation ⟨β⟩image will be used, where the subscript indicates the image data that β was extracted from.
To validate the method for calculating the spectral parameters, distributions of β were determined for a set of mammograms. The data set consisted of 66 digitized screen-film mammographic exams (MLO view) with 50 μm resolution. In total, 3589 ROIs of size of 12.8×12.8 mm2 were evaluated in the frequency range [0.15,1.00] cycles∕mm. The mean β was 2.74 (std. of 0.19), which corresponds well with the result of Burgess et al. of 2.83 (std. of 0.35) (Ref. 1) considering that different data sets were evaluated.
RESULTS
Tomosynthesis projections
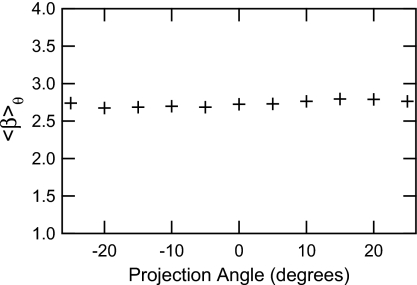
For each case, ⟨β⟩θ was calculated for each projection image taken at angle θ to ensure that ⟨β⟩θ was approximately the same for all angles (see Fig. 3). All projections display the projected information of almost the whole breast and the amount of breast structure is expected to be the same for all angles. The variation shown in the figure is representative for all cases. There was no exception. The coefficient of variation (mean divided by the standard deviation) for the 11 projections in a typical image is less than 2%, indicating the relatively stable nature of beta across projections.
Figure 3.
A typical case showing the dependence of ⟨β⟩θ on the projection angle. There are some fluctuations but no trend in the ⟨β⟩θ variation with projection angle could be found.
For each breast, ⟨β⟩proj was computed from the set of 11 projection images. Averaged across all 55 cases, was 3.06 (standard deviation of 0.21). The log magnitude of the power spectrum, , averaged across all 55 cases, was −5.08(log E×mm)2 (standard deviation of 0.2(log E×mm)2).
Tomosynthesis reconstructed images
We computed ⟨β⟩slice for each reconstructed slice to study how the breast structure varied within each breast. Since each slice displays a different part of the breast, ⟨β⟩slice was expected to vary.
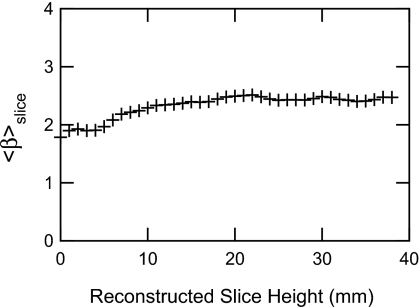
When displaying the ⟨β⟩slice as a function of slice height, no obvious relation could be established (Fig. 4). However, the central slices often had a higher ⟨β⟩slice than the outermost ones, which is natural since breast structure is focused around the nipple. For the case shown in Fig. 4, ⟨β⟩slice appears reduced for slices below 10 mm. The breast structure is thus not uniformly spread within a breast. This indicates that tomosynthesis is capable of reducing the amount of superposition of breast tissues and therefore examination of one particular slice may not be confounded by high breast density at some other (relatively remote) part of the breast. Averaging across all 55 cases, was 2.87 (standard deviation of 0.24), and was −6.04 (standard deviation of 0.31 ).
Figure 4.
⟨β⟩slice dependence on the reconstruction slice height. The first and last ten slices were removed when evaluating ⟨β⟩recon. The shape of this curve varied largely from case to case. A constant ⟨β⟩slice value for all slices was very rare.
Comparisons
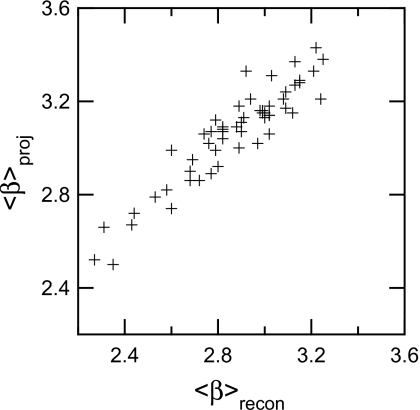
It was found that ⟨β⟩slice was lower than ⟨β⟩proj (Fig. 5). A two-tailed, paired Students t-test was done on the 55 tomosynthesis projection and reconstructed cases, where the average difference in ⟨β⟩ between the projection ROIs and the reconstructed ROIs across the 55 cases was 0.194, which was statistically significant (p<0.001). The 95% confidence interval for the difference between the value of ⟨β⟩ of the projections and reconstructions was [0.170, 0.218]. The hypothesis that they had the same ⟨β⟩ was rejected at the 95% level.
Figure 5.
⟨β⟩ distribution for projections and reconstructions. Note that ⟨β⟩recon is lowered for all but one case. This supports the theory that tomosynthesis reconstructions increase detection by lowering overlapping breast tissue.
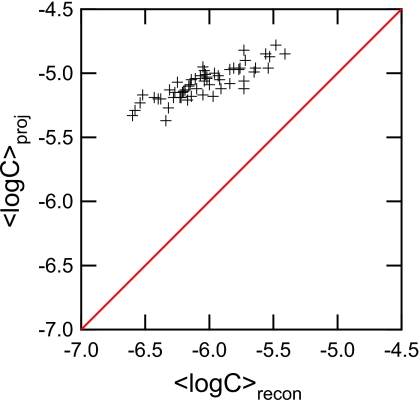
The magnitude of the power spectrum in the reconstructed slices was lower than in the projections (Fig. 6). The average difference in the log-power spectrum magnitude at 1 cycle∕mm was 0.96, which was statistically significant (p<0.001). The 95% confidence interval for the difference was [0.71, 1.21]. The hypothesis that they have the same mean is rejected at the 95% level.
Figure 6.
The magnitude of the spectral density for the projections and reconstructions. The magnitude is decreased for all cases.
DISCUSSION
We found that mean beta was lowered by 0.194 in the tomosynthesis slices compared to the projection images. This result has implications to the benefit of tomosynthesis over conventional projection mammography because the tomosynthesis projection data can be used as a surrogate for the conventional mammograms of each patient: Each tomosynthesis projection data set is taken in the same way one would acquire a projection mammogram, with two differences, namely, the x-ray source projection angle and the dose per projection. We showed that the projection angle has no effect on β. As for the dose, care was taken to ensure that the range of the fit, from which β was extracted, did not include any quantum noise.
Burgess and Judy showed that a lower power spectral exponent improves lesion detectability.3 They determined threshold amplitudes for human observers to obtain a given performance as a function of lesion size for lesion detectability in backgrounds with different power spectrum exponents. For exponents greater than 2, threshold amplitude increased with lesion size. In other words, in such backgrounds, larger lesions are harder to detect (at equal signal amplitude). The higher the power spectrum exponent, the more pronounced this effect. Therefore, in tomosynthesis, lesion detectability may be improved through reducing the power spectrum exponent in the reconstructed slices.
We further found that the magnitude of the power spectrum decreased by about an order of magnitude from projections to reconstructed slices. However, the numeric value of the power spectrum magnitude is difficult to compare because of the difference in scale: Pixel values in the projection views correspond to x-ray path integrals , where is the spatial distribution of energy-dependent attenuation coefficients in the volume being imaged. Voxel values in the tomosynthesis reconstruction represent an attenuation value , which unlikely represents the true attenuation coefficient in the original object. Recovery of the actual attenuation coefficient of objects in tomosynthesis is difficult if not impossible because of the limited angular range which causes objects to be blurred in the depth direction according to their extent in the detector plane. Scatter and beam hardening are additional sources of bias in the attenuation measurement.
For the same reason, namely, the ill-determined attenuation tomosynthesis voxel values, lesion contrast cannot be easily predicted for tomosynthesis and therefore the effect of the magnitude of the power spectrum on lesion detectability cannot be predicted from our results. However, it is clear that lesion contrast in the tomosynthesis slice is higher than it is in the projection image; the more so as the scan angle increases and tomosynthesis approaches CT.
The value of in the tomosynthesis projection images was higher than what was observed in screen-film mammograms both for the images used in our validation study, see Sec. 2C, as well as for those used by Burgess et al.1 This may be due to the characteristics of the evaluated data set. The breasts were taken from women diagnosed with a lesion in the other breast and the evaluated cases can therefore be considered high risk, indicating that the average breast density may be higher than in a normal population of women.9
The average ⟨β⟩recon is lowered for all but one case. In this case, the reconstructed breast displays a high density breast with a large amount of breast structure and high contrast in many slices (⟨β⟩recon=3.21), whereas the projections show large areas of tissue with low contrast. We are unsure why this occurred, but we believe that it is a rare event (1 in 55 cases). In the future, we will examine the detectability of lesions in the projections and reconstructed slices for this case.
A limitation of our study is that it is based on a limited-size database and that all cases were the contralateral breast of women with a known breast lesion. We do not know how well our patient sample represents the overall patient population. However, even if there were differences, it is not clear what effect, if any, this would have on the difference in beta between reconstructed slices and the projection images. We expect any effect to be small since Fig. 5 indicates that the difference in beta between slices and projections is relatively independent of the value of beta for the projections (or for the slices). Another important limitation of our study is that we have not established the relationship between beta in a reconstructed slice and lesion detectability. This is part of an ongoing study.
CONCLUSION
We have found that on average the β is lowered by 0.194 in the reconstructed cases compared to the projections. This result corresponds well with the assertion that tomosynthesis improves detection through reduced breast structure displayed in the reconstructed slices. In the future we will investigate how the difference in beta affects detectability between projections and reconstructed slices.
ACKNOWLEDGMENTS
This work was funded in part by the Wenner-Gren Foundation and the National Cancer Institute (R33 CA109963). R.N. is a shareholder in Hologic, Inc. He and the University of Chicago receive both royalties and research funding from Hologic. He is on the scientific advisor board of Dexela Ltd. He consults to Siemens, Carestream Health, and Fujifilm Medical Systems.
References
- Burgess A. E., Jacobson F. L., and Judy P. F., “Human observer detection experiments with mammograms and power-law noise,” Med. Phys. 28, 419–437 (2001). 10.1118/1.1355308 [DOI] [PubMed] [Google Scholar]
- Burgess A. E., “Mammographic structure: Data preparation and spatial statistics analysis,” Proc. SPIE 3663, 642–653 (1999). 10.1117/12.348620 [DOI] [Google Scholar]
- Burgess A. and Judy P., “Signal detection in power-law noise: Effect of spectrum exponents,” J. Opt. Soc. Am. A 24, B52–B60 (2007). 10.1364/JOSAA.24.000B52 [DOI] [PubMed] [Google Scholar]
- Wu T., Stewart A., Stanton M., McCauley T., Phillips W., Kopans D. B., Moore R. H., Eberhard J. W., Opsahl-Ong B., Niklason L., and Williams M. B., “Tomographic mammography using a limited number of low-dose cone-beam projection images,” Med. Phys. 30, 365–380 (2003). 10.1118/1.1543934 [DOI] [PubMed] [Google Scholar]
- Metheany K. G., Abbey C. K., Packard N., and Boone J. M., “Characterizing anatomical variability in breast CT images,” Med. Phys. 35, 4685–4694 (2008). 10.1118/1.2977772 [DOI] [PMC free article] [PubMed] [Google Scholar]
- Wu T., Moore R. H., Rafferty E. A., and Kopans D. B., “A comparison of reconstruction algorithms for breast tomosynthesis,” Med. Phys. 31, 2636–2647 (2004). 10.1118/1.1786692 [DOI] [PubMed] [Google Scholar]
- Barrett H. H. and Myers K. J., Foundations of Image Science (Wiley Interscience, Hoboken, NJ, 2004). [Google Scholar]
- Percival and Walden, Spectral Analysis for Physical Applications (Cambridge University Press, Cambridge, 1993). [Google Scholar]
- Li H., Giger M. L., Olopade O. L., and Chinander M. R., “Power spectral analysis of mammographic parenchymal patterns for breast cancer risk assessment,” J. Digit Imaging 21, 145–152 (2008). 10.1007/s10278-007-9093-9 [DOI] [PMC free article] [PubMed] [Google Scholar]


