Abstract
This study presents the application of the Presage∕optical-CT 3D dosimetry system for relative dosimetry in the Radiologic Physics Center (RPC) Head and Neck (H&N) IMRT phantom. Performance of the system was evaluated by comparison with the “gold-standard” RPC credentialing test. A modified Presage cylindrical insert was created that extended the capability of the RPC H&N phantom to 3D dosimetry. The RPC phantom was taken through the entire treatment planning procedure with both the standard RPC insert and the modified Presage insert. An IMRT plan was created to match the desired dose constraints of the credentialing test. This plan was delivered twice to the RPC phantom: first containing the standard insert, and then again containing the Presage insert. After irradiation, the standard insert was sent for routine credentialing analysis; including point dose measurements (TLD) and planar Gafchromic® EBT film measurement. The 3D dose distribution from Presage was read out at Duke using the OCTOPUS™ 5X optical-CT scanner. The Presage distribution was compared with gold-standard EBT measurement (determined by the RPC) and the calculated Eclipse distribution. The agreement between the normalized EBT, Presage, and Eclipse distributions, in the central axial plane was evaluated using profiles and gamma-map comparisons (4% dose difference and 3 mm distance to agreement). Profiles showed good agreement between EBT, Presage, and Eclipse distributions. 2D gamma-map comparisons between all three modalities showed at least 98% pass rate. The excellent agreement between Presage and EBT in the central plane established Presage as a standard against which to evaluate the accuracy of the 3D calculated Eclipse distribution. A gamma comparison between normalized Presage and Eclipse 3D distributions gave an overall pass rate of ∼94%. In conclusion, the Presage∕optical-CT system was found to be feasible for relative 3D dosimetry in the RPC IMRT H&N phantom. The potential to extend the RPC IMRT credentialing procedure to 3D may be feasible provided accurate calibration to dose (Gy) and robustness to shipping stress are demonstrated.
Keywords: 3D dosimetry, optical-CT, PRESAGE™, radiation, quality assurance, Radiological Physics Center, IMRT
INTRODUCTION
The RPC H&N credentialing test is routinely taken by institutions that wish to participate in the IMRT H&N clinical trial protocols of the radiation therapy oncology group (RTOG).1 This test comprises irradiation of an anthropomorphic H&N phantom with an IMRT treatment plan created by the participant institution to meet dose constraints defined in the respective protocol. Dosimetric credentialing is achieved using point dosimeters [thermoluminiscent detectors (TLDs)] and 2D dosimeters (Gafchromic® EBT film) contained in the phantom. A participating institution passes the credentialing test if the measured dose is within a gamma criteria of 7% dose difference and 4 mm distance to agreement (DTA) as compared to the treatment planning system (TPS) calculations at a limited number of points. It has been reported that, out of a total of 342 irradiations, ∼25% of participating institutions fail to meet the generous credentialing criteria at first attempt.2 The TLD and film measurements represent a sparse sampling of the 3D treatment volume, suggesting more errors would be detected if comprehensive 3D dosimetry was used. As a result, an urgent need for accurate and robust 3D dosimetry techniques (e.g., Presage∕optical-CT3, 4 and gel∕optical-CT5, 6, 7, 8, 9, 10) has been recognized to improve the standards of IMRT quality assurance.
Several publications have demonstrated the application of 3D dosimetry tools for IMRT quality assurance.9, 10, 11, 12, 13 Recently, Babic et al.5 demonstrated the feasibility of 3D dosimetry in the RPC H&N phantom using the ferrous xylenol-orange gel∕optical-CT dosimetry system. The authors have cited the postirradiation diffusion of active species in the gel as a current limitation, which would require immediate postirradiation scanning to minimize diffusion-related effects. Presage∕optical-CT is a relatively novel and promising 3D dosimetry system with no documented diffusion effects. The 3D dosimeter (PRESAGE™) has many favorable characteristics including linear radiochromic (light absorbing and not light scattering) response to radiation,14, 15, 16 temporal stability of response for >90 h postirradiation, excellent robustness and reproducibility characteristics in 3D such as intradosimeter uniformity of response to within 2%, and interdosimeter reproducibility to within 2%.17
To date, a step-by-step investigation into the feasibility of the Presage∕optical-CT dosimetry system has been reported by our group. In the first step, extensive characterization of the dosimetric properties was reported on small volumes.15 This was followed by dosimetric verifications on large volumes and for increasingly complex treatment plans. These include a coplanar open-beam treatment,3 a highly modulated IMRT treatment,4 and small field open-beam treatment, respectively.17 Each verification experiment demonstrated excellent (4% dose difference and 4 mm DTA) agreement of Presage dose measurement with independent planar EBT film measurements as well as 3D dose calculations from the TPS after normalization (i.e., relative dose measurement). The present work, investigating the feasibility of relative dosimetry in a credentialing phantom represents a natural extension of these efforts.
MATERIALS AND METHODS
The feasibility of achieving 3D dosimetry in the RPC H&N phantom, using the Presage∕optical-CT system, was investigated by comparison against routine RPC IMRT credentialing dosimetry. Section 2A describes the RPC credentialing test and dosimetry, and Sec. 2B describes the independent Presage∕optical-CT dose measurements.
Standard RPC IMRT credentialing test
The “gold-standard” RPC credentialing test comprises irradiation of an anthropomorphic head phantom containing the standard RPC insert with an IMRT treatment plan and comparing the measured dose with the planned dose.1
The phantom and standard RPC insert
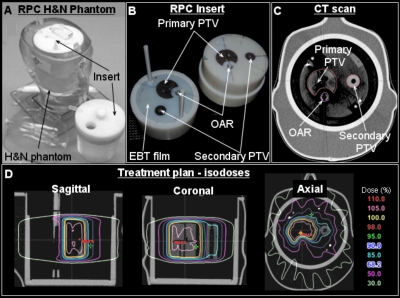
A picture of the RPC phantom with the removable imaging and dosimetry insert is shown in Fig. 1. The insert is designed such that three independent structures are visible in the x-ray CT scan because of different densities. The structures include a primary planning target volume (PTV), a secondary PTV, and an organ at risk (OAR). The OAR is representative of the spinal cord. In addition, the insert contains three pieces of radiochromic film and eight TLDs. The location of the central axial film is seen in Fig. 1b. Two other EBT films are placed (superior and inferior to axial EBT film) such that when the insert is assembled, the films form a single sagittal slice. In addition to EBT films, four TLDs are located in the primary PTV (superior anterior, superior posterior, inferior anterior, and inferior posterior relative to the axial EBT film plane), two TLDs are in the secondary PTV (superior and inferior) and two more are in the OAR (superior and inferior).
Figure 1.
Treatment planning for RPC phantom containing the imaging and dosimetry insert. (a) A photograph of the phantom. (b) A photograph of the standard RPC insert. (c) Central slice (EBT film plane) of the x-ray CT scan of the phantom with RPC insert showing the primary PTV, secondary PTV, and OAR. (d) Isodose distributions in sagittal, coronal, and axial planes.
IMRT treatment of standard RPC insert
The RPC phantom was taken through the entire treatment planning procedure by physicists as though it were an actual patient. An IMRT treatment plan was designed to conform to the desired dose constraints provided by the RPC. The treatment planning and delivery procedures are described below.
The phantom was filled with water and the water temperature was allowed to equilibrate to room temperature as recommended in the instruction sheet from RPC. The insert was carefully placed inside the phantom after ensuring that no air pockets were present. Coplanar surface markers were placed on the outside of the phantom to ensure consistent positioning during simulation and treatment delivery. An x-ray CT scan was taken using a four-slice GE Lightspeed CT scanner with a slice thickness of 1.25 mm to ensure that the TLDs could be seen. The CT scan was imported into the Eclipse® (Varian Medical Systems Inc., Palo Alto, CA) treatment planning workstation where the structures (primary PTV, secondary PTV, and OAR) and TLDs were manually contoured.
The desired dose prescription and constraints were as follows: 95% of primary PTV receives 6.6 Gy dose, <1% of primary PTV receives <93% of prescribed dose, 95% of secondary PTV receives 5.4 Gy, and <1% of secondary PTV receives <93% of prescribed dose and maximum dose to OAR is 4.5 Gy. The prescription dose of 6.6 Gy is higher than what is typically used for a fractionated H&N treatment (∼2 Gy) because of the relatively low sensitivity of the EBT film. The optimized IMRT treatment plan comprised nine coplanar beams placed every 40°. Plan optimization was done in Eclipse using a pencil beam dose calculation algorithm (grid size of 1.25 mm). The isodose profiles in the coronal, sagittal, and axial planes are shown in Fig. 1d. Prior to treatment, routine MapCheck IMRT QA procedures used at Duke were followed to check consistency of planned fluence with delivered fluence for individual beams.18 The MapCheck IMRT QA procedure included setting up a verification plan in Eclipse® on a water phantom [source-to-axis distance (SAD)=100 cm, depth=5 cm] with the couch, gantry, and collimator reset to zero position. For MapCheck measurement, the cross hair on the MapCheck was aligned with the collimator cross hair and solid water was placed on the surface such that the SAD is 100 cm and diodes are at a water equivalent depth of 5 cm to match the water phantom setup used in calculations. For each individual beam, the calculated dose was compared with the measured dose from MapCheck. After MapCheck IMRT QA, the phantom was transferred to the couch of a Varian 21 EX linac where the treatment was delivered to the phantom.
TLD and EBT film analysis
After irradiation, the insert was returned to the RPC for dose measurement and analysis. The Eclipse treatment plan including the dose calculation was also sent electronically for comparison with measurement. At RPC, the recorded dose in the TLDs and the EBT film (henceforth called EBT dose) was compared with the planned dose.1 The RPC analysis report and the EBT dose (scaled to TLDs) were included in the credentialing test report sent to Duke and were used as gold-standard measurements for comparison against the Presage dose measurement and Eclipse calculations.
3D dose measurement using Presage∕optical-CT
After the standard insert had been treated as described above, it was removed and replaced with a modified insert containing a Presage 3D dosimeter without disturbing the phantom alignment on the treatment machine. As a result, setup errors were expected to be minimal (e.g., <1 mm). Treatment planning and treatment delivery to the phantom with Presage dosimetry insert was similar to that of the standard RPC insert with only minor differences (see Sec. 2B2 below). Optical-CT was used for 3D dose readout from the irradiated Presage dosimeter.
The phantom with customized Presage insert
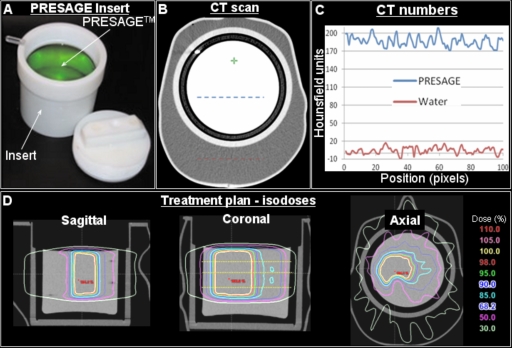
A solid, radiochromic leuco dye doped polyurethane plastic PRESAGE™ dosimeter (Heuris Pharma LLC, Skillman, NJ 08558) was molded to fit inside a plastic sleeve that was compatible with RPC H&N phantom as shown in Fig. 2. The Presage dosimeter along with the compatible sleeve is henceforth called the Presage insert. Radiochromic properties of Presage have been well characterized.15, 17 The formulation used in this study17 had an effective Z number of 8.3, a physical density of 1.07 g∕cm3, and a CT number of ∼180. The radiochromic response was determined spectrophotometrically using cuvette irradiations and was found to be linear with sensitivity of 0.045 OD change per cm per Gy. Using the cuvette sensitivity data, it was estimated that a dose of 4 Gy would result in an optimal OD change.19
Figure 2.
Treatment planning for the RPC phantom containing the customized Presage 3D dosimetry insert. (a) A photograph of the customized insert. (b) Central slice of the x-ray CT scan of the combined phantom. (c) A plot of CT numbers along dotted lines in B. (d) Isodose distribution in sagittal, coronal, and axial planes. The same treatment plan used to irradiate the RPC phantom with the standard insert was also used to irradiate the phantom with Presage insert with the exception that the prescription dose was reduced from 6.6 to 4 Gy to avoid over exposing the dosimeter.
IMRT treatment of Presage insert
The treatment planning and delivery for the phantom with Presage insert was similar to the procedures for an actual patient. A CT scan of the phantom with Presage insert was acquired by swapping with the RPC insert. The surface markers already present on the phantom were used to position the phantom in the same orientation as that for the CT scan with RPC insert. The CT scan of the phantom with the Presage insert was imported into the Eclipse TPS and registered with the CT scan of the phantom with the RPC insert using the autoregister tool, which uses the mutual information algorithm for registration.
The treatment plan that was designed for the RPC insert was also used for the Presage insert, with the only exception that the prescription dose was reduced from 6.6 to 4 Gy∕fraction. This was required because of the dose limit placed by the optimal OD change requirement of Presage. A dose of 6.6 Gy would have induced a suboptimal OD change (e.g., excessive attenuation) resulting in undesirable artefacts.20 Before treatment, MapCheck IMRT QA procedures at Duke were followed to verify consistency of planned fluence and delivered fluence for each beam (see Sec. 2A2 for details). After IMRT QA, the phantom with Presage insert was aligned on the treatment couch using surface markers and the new plan (4 Gy prescription dose) was delivered.
A concern with scaling the prescription dose was that it might cause differences in relative fluence, MLC leaf motion, and relative dose distribution. To evaluate the significance of changing prescription dose on the consistency of the “relative fluence” between the two plans, the MapCheck IMRT QA measurements from the two plans were analyzed. In addition, the Dynamic MLC log files (DynaLog file) that were generated after delivery of each field were analyzed to independently ascertain the relative consistency of MLC leaf motion for each field of the two plans. Analysis was done using the Varian DynaLog file viewer and an in-house MATLAB code to evaluate the root-mean-squared (rms) error in leaf position. Finally, the calculated dose distribution from the Eclipse TPS for the two plans were also analyzed to evaluate equivalence of normalized dose distribution.
Optical-CT scanning
After IMRT treatment, the Presage dosimeter was kept refrigerated (4 °C and away from room light) for 12 h and then the 3D dose distribution was read out using optical-CT. The OCTOPUS™ 5X optical-CT scanner (MGS Research Inc, Madison, CT), which is an upgrade over previously used apparatus,3 was used. The upgrade enabled five times faster scanning because of alterations including a new turntable with improved docking mechanism (enabled reproducible docking of phantoms), elimination of reference diode for higher sampling rate, and changes in motor axes configurations to facilitate synchronized linear projection and turntable rotation. The software alterations included new driver software including an interface to automatically∕manually optimize the speed and acceleration of the motors driving the linear projection and angular rotation such that the overall scan time is minimized. The manufacturer discontinued the use of the reference diode in the OCTOPUS™ 5X scanner for higher sampling rate but has accounted for the laser drift and output variation in the driver software, where each linear projection scan is normalized to the constant refractive index (RI) matched fluid signal. The fluid (mixture of octyl salicylate and octyl methoxy cinnamate) was filtered before optical-CT scanning to remove suspended impurities.
The Presage dosimeters were scanned before (prescan) and after (postscan) irradiation. The scanner was configured for a pixel size of 1 mm and a total of 168 pixels comprised a linear projection scan. Based on the image matrix and pixel size, 600 projections (0.6° separation) were acquired per slice to meet the Nyquist sampling criteria. The 3D scan consisted of 20 slices separated by an interslice spacing of 4 mm. The reason for the coarse slice thickness was that the dose distribution has little variation in the sup-inf direction as all structures are identical in successive axial slices. Scanning time for a single slice was about 8–9 min. The 3D distribution of radiochromic response [optical density (OD); units:∕meter] was reconstructed using in-house MATLAB software based on the filtered backprojection (FBP) algorithm (Mathworks, Natic, MA). The reconstructed slices had a spatial resolution of 1×1×1 mm3 with interslice spacing of 4 mm. The Presage dose distribution can be obtained by normalization of the OD distribution because of linear relationship of OD with dose.15
Data analysis
Comparison of measured dose (Presage and EBT) and calculated dose (Eclipse) was done in DoseQA (www.3cognition.com) where individual datasets were loaded, registered (possible using fiducial marks on scans), and normalized to convert to relative dose distributions. The normalization point was in a region of homogeneous high dose (primary PTV). Dose profiles and gamma maps21, 22 were used for quantitative comparisons of dose distribution after normalization of all datasets.
RESULTS AND DISCUSSION
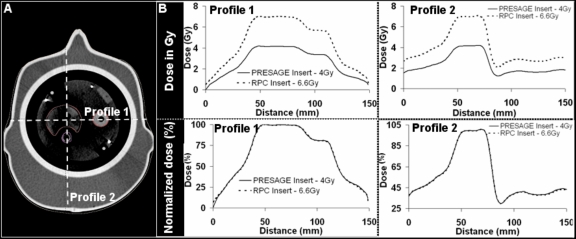
Prior to a direct comparison of Presage with the gold-standard EBT film, it was necessary to demonstrate that the relative dose distributions were identical in the standard RPC insert (containing EBT) and the Presage insert. Differences could arise from the scaling of the dose prescription between these two plans (6.6 Gy for EBT and 4 Gy for the Presage) and∕or the differences in CT numbers between the presage and EBT inserts. Comparison of relative fluence maps measured by MapCheck IMRT QA device showed that the relative fluences were essentially identical between these plans. With an extremely high tolerance criterion of 0.3% dose difference and 0.3 mm DTA, a greater than 99% gamma pass rate was achieved for all fields. An analysis of DynaLog files showed that the average rms error in leaf positions was ∼0.2 mm between the two treatments. Figure 3 shows a comparison of relative dose distributions from the two treatments, as calculated by the Eclipse TPS. Dose-difference maps confirmed that the distributions agreed to within 1%. Taken together, the close agreement of relative fluences, MLC leaf positions, and dose distributions enabled a direct relative comparison between the EBT, Presage, and Eclipse distributions.
Figure 3.
Changing prescription dose from 6.6 to 4 Gy did not change the relative dose distribution in the Presage insert based on Eclipse calculations. Dose profiles from Eclipse along the dotted lines in (a) are shown in (b) for both the standard RPC insert and the Presage insert. The normalized dose distributions were identical (as shown in the lower panels in (b)), thereby enabling a direct comparison of Presage dose measurement with EBT dose measurement and Eclipse dose calculations despite the different density of the Presage insert.
Intercomparison of Presage dose, EBT dose, and Eclipse calculation
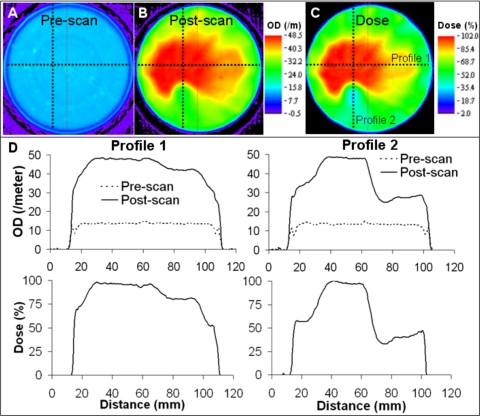
Central slice images of preirradiation scan, postirradiation scan, and normalized dose distribution from Presage∕optical-CT measurement are shown in Fig. 4. Improvements in scanner hardware and acquisition technique17 (improved fluid filtration and RI matching and improved acquisition parameters and prescan correction) reduced noise to ∼2% (root mean squared error) and edge artefacts (4 mm from edge) as compared to earlier reports.3 In optical-CT imaging, edge artifacts are a result of significant refraction and reflection at the interface of the fluid and the object, primarily due to differences in the RI. The low noise and significantly reduced edge artifact in the Presage measurement facilitated high precision dose measurement even at low dose levels and to within 4 mm of the edge. The noise in reconstruction and edge artifact in Presage dose measurement is expected to further improve with better fluid filtration techniques and better RI matching. The specs in the reconstructed prescan images [Fig. 4a] were caused by physical impurities inside the dosimeter.
Figure 4.
Presage/optical-CT dose measurement. (a) Prescan central slice. (b) Postscan central slice. (c) Relative dose distribution. (d) Profiles of OD and relative dose along dotted lines in (a)–(c) confirm low noise and reduced edge artifact.
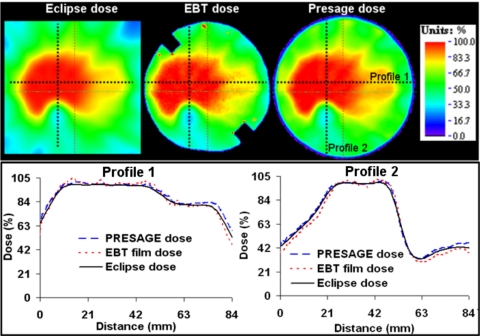
Comparison of normalized 2D dose maps and dose profiles from Presage, EBT, and Eclipse distributions in the central axial plane is shown in Fig. 5. Dose-profile comparisons showed close agreement of Presage with EBT and Eclipse. The agreement was good even in the dose-gradient regions between the primary PTV and secondary PTV and between the primary PTV and OAR, which can be major sources of dosimetric errors. The average displacement between the measured dose gradient (both Presage and EBT) and the calculated dose gradient (Eclipse) between the primary PTV and OAR was ∼1 mm and was compliant with the RPC threshold of 4 mm. In general, the measured dose and calculated dose agreed well (4% dose difference and 3 mm DTA) except within 4 mm of the edge because of edge artifacts in Presage and EBT distributions. At the normalization point, there was ∼7% difference between Presage (when calibrated to Gy) and Eclipse (also in Gy). This error does not affect the accuracy of relative 3D dosimetry because of the highly linear dose response of Presage. This difference represents an uncertainty arising from the present calibration procedure. The Presage dose in the experimental large-volume insert was determined using the calibration curve obtained from the irradiation of small-volume cuvettes. Part of the difference may be due to a volume sensitivity effect which needs further investigation. In addition, part of the difference might be attributed to the different sensitivities of the spectrophotometer (used to measure the OD for cuvette calibration) and the OCTOPUS 5X™ scanner (used to measure the OD in the much larger experimental insert).
Figure 5.
Dose profile comparison of measurement (Presage and EBT film) and calculation (Eclipse TPS) in the central axial plane, which contains the EBT film. Top panel shows color wash images of relative dose distributions. Dose profiles in the lower panel are along dotted lines in the upper panel.
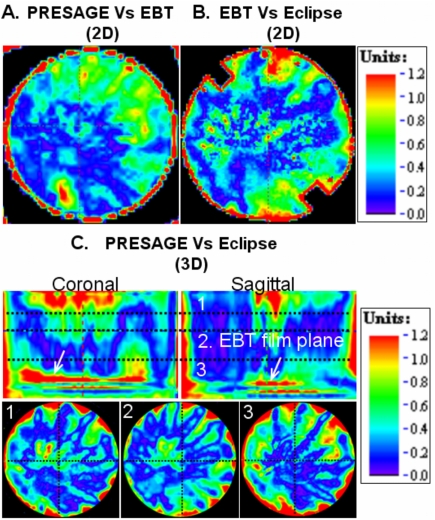
Gamma-map analysis was used for further comprehensive verification of the extent of agreement between Presage, EBT, and Eclipse in the central axial plane. The results are presented in Fig. 6. Gamma criteria of 4% dose difference and 3 mm DTA were used, substantially less than the 7%, 4 mm criteria used in the RPC credentialing test. A 2D gamma comparison between Presage and the gold-standard EBT distribution [Fig. 6a] yielded a high pass rate of ∼98% (this number excludes a 4 mm rim at the edge of the dosimeter, where edge artifacts occur). This result confirms the accuracy of the Presage distribution in the central plane and supports its use as a reliable 3D standard against which to compare the calculated Eclipse distribution. The routine credentialing analysis comparing Eclipse with EBT yielded a similar 98% agreement [Fig. 6b] confirming successful RPC credentialing.
Figure 6.
Gamma comparative analysis (4% dose difference and 3 mm DTA criteria) of Presage dose, EBT dose, and Eclipse dose shows agreement (98% pass rate) in the axial plane containing EBT film. A multislice comparison was possible between Presage dose and Eclipse dose (94% pass rate). The positions of the slices [1, 2, and 3 in (c)] correspond to the positions marked by horizontal dotted lines in the coronal view of Fig. 2d.
A slice-by-slice comparison between Presage and the Eclipse distributions [Fig. 6c] showed reasonable agreement in the 3D volume except near the edge and the high dose-gradient region in the sup-inf direction [see arrows in Fig. 6c]. The failure at the edge is caused by an edge artifact in the Presage measurement. The failures highlighted by arrows occur at the inferior field edge. The cause is difficult to determine, but may be due in part to penumbral blurring in the Eclipse calculation.3, 17 The pass rate for this multislice comparison was ∼94% excluding the edge artifact and the planes highlighted by arrows.
IMRT credentialing results from the RPC
The official RPC credentialing report confirmed that the credentialing test on the H&N phantom was successful, i.e., the measured dose agreed with dose calculations to within the criteria of 7% dose difference and 4 mm DTA. Results showed that the TLD dose measurements in primary PTV and secondary PTV were within 5% of the Eclipse calculations. In addition to TLD dose measurement, EBT dose measurement (scaled to the TLD dose) was used for relative 2D dosimetric verification in the central axial plane. The average displacement between the measured dose gradient and the calculated dose gradient in the region between the primary PTV and the OAR was 1 mm and easily passed the acceptable upper bound of 4 mm. The results from the credentialing test were consistent with the three-way intercomparison study between Presage, EBT, and Eclipse dose conducted at Duke.
CONCLUSIONS
An urgent need for comprehensive 3D dosimetry tools has been recognized to improve standards of IMRT quality assurance. This work demonstrates the implementation and feasibility of the Presage∕optical-CT 3D dosimetry system for relative dosimetry in the RPC IMRT H&N phantom. Results showed good agreement (98% pass rate with gamma criteria of 4% dose difference and 3 mm DTA) of Presage measurement with gold-standard EBT film measurement in a central plane. The Presage measurement was hence used as a 3D standard to compare the accuracy of Eclipse 3D dose calculations. The Eclipse dose calculations showed reasonable agreement (94% pass rate with gamma criteria of 4% dose difference and 3 mm DTA) with the Presage measurement, for this complex nine field IMRT credentialing plan. Overall, the Presage∕optical-CT system was found to be a feasible tool for relative dosimetry in RPC IMRT H&N phantom. Looking ahead, the potential of the Presage∕optical-CT system to provide accurate calibrated 3D dose distributions (i.e., Gy) and robustness to shipping stresses (required for remote dosimetry) remains to be demonstrated.
ACKNOWLEDGMENTS
This work was supported through NIH Grant No. RO1 CA 100835.
References
- Molineu A. et al. , “Design and implementation of an anthropomorphic quality assurance phantom for intensity-modulated radiation therapy for the Radiation Therapy Oncology Group,” Int. J. Radiat. Oncol., Biol., Phys. 63, 577–583 (2005). [DOI] [PubMed] [Google Scholar]
- Ibbott G. S. et al. , “Challenges in credentialing institutions and participants in advanced technology multi-institutional clinical trials,” Int. J. Radiat. Oncol., Biol., Phys. 71, S71–75 (2008). [DOI] [PMC free article] [PubMed] [Google Scholar]
- Guo P., Adamovics J., and Oldham M. A., “Practical three-dimensional dosimetry system for radiation therapy,” Med. Phys. 33, 3962–3972 (2006). 10.1118/1.2349686 [DOI] [PMC free article] [PubMed] [Google Scholar]
- Oldham M., Sakhalkar H., Guo P., and Adamovics J., “An investigation of the accuracy of an IMRT dose distribution using two- and three-dimensional dosimetry techniques,” Med. Phys. 35, 2072–2080 (2008). 10.1118/1.2899995 [DOI] [PMC free article] [PubMed] [Google Scholar]
- Babic S., Battista J., and Jordan K., “Three-dimensional dose verification for intensity-modulated radiation therapy in the radiological physics centre head-and-neck phantom using optical computed tomography scans of ferrous xylenol-orange gel dosimeters,” Int. J. Radiat. Oncol., Biol., Phys. 70, 1281–1291 (2008). [DOI] [PubMed] [Google Scholar]
- McJury M. et al. , “Radiation dosimetry using polymer gels: methods and applications,” Br. J. Radiol. 73, 919–929 (2000). [DOI] [PubMed] [Google Scholar]
- Oldham M., Siewerdsen J. H., Kumar S., Wong J., and Jaffray D. A., “Optical-CT gel-dosimetry I: basic investigations,” Med. Phys. 30, 623–634 (2003). 10.1118/1.1559835 [DOI] [PMC free article] [PubMed] [Google Scholar]
- Maryanski M. J., Zastavker Y. Z., and Gore J. C., “Radiation dose distributions in three dimensions from tomographic optical density scanning of polymer gels: II. Optical properties of the BANG polymer gel,” Phys. Med. Biol. 41, 2705–2717 (1996). 10.1088/0031-9155/41/12/010 [DOI] [PubMed] [Google Scholar]
- Wuu C. S. and Xu Y., “Three-dimensional dose verification for intensity modulated radiation therapy using optical CT based polymer gel dosimetry,” Med. Phys. 33, 1412–1419 (2006). 10.1118/1.2188820 [DOI] [PubMed] [Google Scholar]
- De Deene Y., “Gel dosimetry for the dose verification of intensity modulated radiotherapy treatments,” Z. Med. Phys. 12, 77–88 (2002). [DOI] [PubMed] [Google Scholar]
- Crescenti R. A., Scheib S. G., Schneider U., and Gianolini S., “Introducing gel dosimetry in a clinical environment: customization of polymer gel composition and magnetic resonance imaging parameters used for 3D dose verifications in radiosurgery and intensity modulated radiotherapy,” Med. Phys. 34, 1286–1297 (2007). 10.1118/1.2712042 [DOI] [PubMed] [Google Scholar]
- Sandilos P. et al. , “Dose verification in clinical IMRT prostate incidents,” Int. J. Radiat. Oncol., Biol., Phys. 59, 1540–1547 (2004). [DOI] [PubMed] [Google Scholar]
- Gum F. et al. , “Preliminary study on the use of an inhomogeneous anthropomorphic Fricke gel phantom and 3D magnetic resonance dosimetry for verification of IMRT treatment plans,” Phys. Med. Biol. 47, N67–77 (2002). 10.1088/0031-9155/47/7/401 [DOI] [PubMed] [Google Scholar]
- Adamovics J. and Maryanski M. J., “Characterisation of PRESAGE: A new 3-D radiochromic solid polymer dosemeter for ionising radiation,” Radiat. Prot. Dosim. 120, 107–112 (2006). 10.1093/rpd/nci555 [DOI] [PubMed] [Google Scholar]
- Guo P. Y., Adamovics J. A., and Oldham M., “Characterization of a new radiochromic three-dimensional dosimeter,” Med. Phys. 33, 1338–1345 (2006). 10.1118/1.2192888 [DOI] [PMC free article] [PubMed] [Google Scholar]
- Brown S. et al. , “Radiological properties of the PRESAGE and PAGAT polymer dosimeters,” Appl. Radiat. Isot. 66, 1970–1974 (2008). 10.1016/j.apradiso.2008.06.005 [DOI] [PubMed] [Google Scholar]
- Sakhalkar H., Adamovics J., Ibbott G., and Oldham M. A., “Comprehensive evaluation of the PRESAGE/optical-CT 3D dosimetry system,” Med. Phys. 36, 71–82 (2009). 10.1118/1.3005609 [DOI] [PMC free article] [PubMed] [Google Scholar]
- Letourneau D., Gulam M., Yan D., Oldham M., and Wong J. W., “Evaluation of a 2D diode array for IMRT quality assurance,” Radiother. Oncol. 70, 199–206 (2004). 10.1016/j.radonc.2003.10.014 [DOI] [PubMed] [Google Scholar]
- Xu Y., Wuu C. S., and Maryanski M. J., “Performance of a commercial optical CT scanner and polymer gel dosimeters for 3-D dose verification,” Med. Phys. 31, 3024–3033 (2004). 10.1118/1.1803674 [DOI] [PubMed] [Google Scholar]
- Oldham M. and Kim L., “Optical-CT gel-dosimetry. II: Optical artifacts and geometrical distortion,” Med. Phys. 31, 1093–1104 (2004). 10.1118/1.1655710 [DOI] [PMC free article] [PubMed] [Google Scholar]
- Low D. A. and Dempsey J. F., “Evaluation of the gamma dose distribution comparison method,” Med. Phys. 30, 2455–2464 (2003). 10.1118/1.1598711 [DOI] [PubMed] [Google Scholar]
- Low D. A., Harms W. B., Mutic S., and Purdy J. A., “A technique for the quantitative evaluation of dose distributions,” Med. Phys. 25, 656–661 (1998). 10.1118/1.598248 [DOI] [PubMed] [Google Scholar]


