Abstract
The global increase in asthma, chronic obstructive pulmonary disease, and other pulmonary diseases has stimulated interest in rat models of pulmonary disease. Imaging methods for study of these models is particularly appealing, since the results can be translated to the clinical setting. Comprehensive understanding of lung function can be achieved by performing registered pulmonary ventilation and perfusion imaging studies in the same animal. While ventilation imaging has been addressed for small animals, quantitative pulmonary perfusion imaging has not been feasible until recently with our proposed technique for quantitative perfusion imaging using multiple contrast agent injections and a view-sharing radial imaging technique. Here, we combine the method with registered ventilation imaging using hyperpolarized 3He in an airway obstruction rodent model. To our knowledge, this is the first comprehensive quantitative assessment of lung function in small animals at high spatial resolution. Standard deviation of the Log (V/Q) is used as a quantitative biomarker to differentiate heterogeneity between the control and treatment group. The estimated value of the biomarker lies with the normal range of values reported in the literature. The biomarker that was extracted using the imaging technique described in this work showed statistically significant differences between the control rats and those with airway obstruction.
Keywords: pulmonary ventilation, pulmonary perfusion, rodents, hypoxic vasoconstriction, airway obstruction, quantitative
1. INTRODUCTION
One of the critical functions of the lung is to oxygenate the arterial blood. This is accomplished by ensuring effective gas exchange which is indicated by matched ventilation and perfusion (1), typically measured as the ratio of the gas replacement rate and the blood flow rate (V/Q). Traditionally, nuclear imaging techniques have been used to study regional lung function (2). Quantitative analysis of combined ventilation and perfusion is typically performed using the dimensionless V/Q ratio. The V/Q ratio is a log normal distribution in healthy lungs with a mean of ~0.80 and a standard deviation (SD) of ~0.30 (3,4). More important than the value of V/Q is the heterogeneity of the value of V/Q, especially when studying a lung disease. It has been shown by Sando et al. (4) that SD of V/Q is a reliable differential biomarker that captures the heterogeneity of the V/Q ratio when studying pulmonary diseases.
While the nuclear imaging techniques have become a “gold standard” for clinical imaging, the spatial resolution offered by the technique is insufficient for imaging small animals. With a large number of genetic rodent models of pulmonary diseases available, a need exists to develop techniques that enable the quantitative assessment of regional functional morphology in small animals (5).
MRI has not been at the forefront of pulmonary imaging. However, with the development of lower TE imaging sequences (6) to overcome signal loss due to susceptibility, and the introduction of hyperpolarized (HP) signal sources (7,8), there has been a growing interest in lung imaging using MRI. While MRI is being developed as an alternative in the clinics using hyperpolarized 3He (9,10) or paramagnetic 15O (11) for ventilation, and dynamic contrast enhanced (DCE) MRI for perfusion (12); the technological barriers in developing these methods for small animal imaging have been significant.
Pulmonary imaging in the rat has been limited to ventilation (7,13) imaging using hyperpolarized (HP) 3He. There have been few studies of ventilation/perfusion imaging in rats. Researchers have attempted to study ventilation and perfusion in the same rat using HP gases and contrast agents (14,15); or very recently, using inert fluorinated gases (16). While the techniques demonstrated that it is feasible to image ventilation/perfusion in rats, extracting quantitative information at high spatial resolution has remained challenging.
Recently, we a proposed a technique for perfusion imaging at high spatial resolution using DCE-MRI (17). This was achieved by using a custom-built micro-injector that enables repeatable precise contrast injections controlled by the physiology of the animal. The imaging was performed using a dynamic interleaved radial imaging sequence combined with sliding-window keyhole reconstruction (IRIS) that enables perfusion imaging at a spatial resolution of 200 × 200 × 3000 μm3 and a temporal resolution of 200 ms. In this work, we propose a protocol for combined ventilation/perfusion imaging at high spatial resolution.
Ventilation imaging was performed using HP 3He (13) and perfusion imaging was carried out using the IRIS technique developed for DCE-MRI (17). A protocol for combined V/Q imaging was designed that enables the acquisition of ventilation and perfusion images before and after airway obstruction. Quantitative ventilation parameters were extracted by establishing a relationship between the HP signal and 3He volume. Quantitative perfusion parameters were extracted using a singular value decomposition technique developed for cerebral perfusion imaging (18). V/Q estimates were extracted from the ventilation rate and blood flow parameters. The standard deviation of V/Q before and after airway obstruction was calculated to demonstrate that the technique is sensitive in detecting statistically significant differences in the heterogeneity of the distribution of V/Q ratio.
2. METHODS
Animal Model
Several rat models of pulmonary diseases have been proposed by researchers, which include models of asthma (19), hypoxic pulmonary vasoconstriction (20), pulmonary embolism (21), emphysema (22), chronic obstructive pulmonary disease (23), and airway obstruction (24). The airway obstruction model proposed by Hedlund et al. (24) is an attractive model for testing imaging sequences. Some of the factors that make this model attractive are robustness, reliability, and availability of internal control. Internal control can be implemented in two ways: 1) the obstruction can be administered during imaging to allow pre- and post-airway obstruction imaging and, 2) the obstruction can be created selectively in one lung/lobe, which allows the contralateral lung to act as a control.
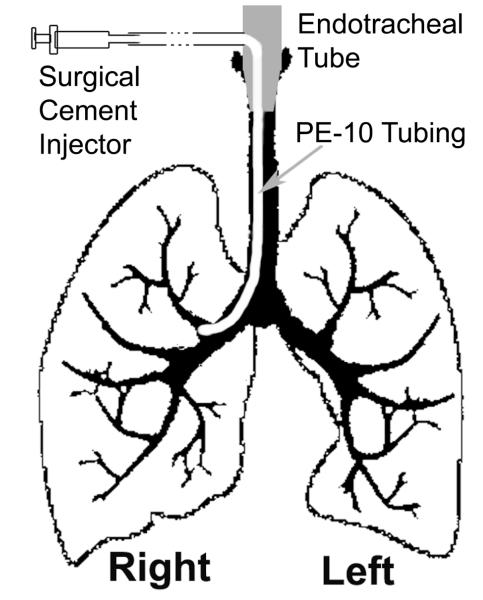
Airway obstruction is created by inserting a catheter through the endotracheal tube, as shown in Figure 1, followed by injection of fast-drying surgical cement to create the localized airway obstruction. The model was developed previously by Hedlund et al. (24) to demonstrate the sensitivity of HP 3He imaging of ventilation before and after airway obstruction. We used the same model to show the sensitivity of the V/Q imaging technique using HP 3He and DCE-MRI. Our hypothesis was that the localized airway obstruction would lead to significant reduction of ventilation, causing a lack of oxygenation to the region, which in turn, would cause hypoxic pulmonary vasoconstriction that leads to reduced pulmonary blood flow.
Figure 1.
Method of inserting a catheter through the side of the endotracheal tube into the left or right main stem bronchus selectively blocking one side of the lung.
Animal Procedures
All animal procedures were approved by the Duke Institutional Animal Care and Use Committee. A total of 6 Female Fischer 344 rats (Charles River Laboratories, Wilmington, MA) were perorally intubated and mechanically ventilated at 60 breaths/minute with a tidal volume of 2.0-2.2 ml. The ventilator is designed to automatically switch between the normal ventilation mode (mixture of 75% N2 and 25% O2) and the HP 3He delivery mode (mixture of 75% 3He and 25% O2) (25). Perfusion studies were carried out by injecting Gd-DTPA contrast agent (Magnevist®, Bayer Healthcare Pharmaceuticals Inc., Pittsburgh, PA) in the right jugular vein via a 3Fr catheter. Airway obstruction was created in situ in the magnet using a catheter (PE-10 tube) that was inserted through a small opening in the tracheal tube. The length of this tubing was such that approximately 100 μl of surgical cement could be injected followed by 500 μl of air to ensure that the cement would reach the tip of the catheter.
Anesthesia was maintained with 0.05 ml injections of Nembutal (50 mg/kg, IP, Abbott Laboratories, North Chicago, IL) about every 45 minutes. Body temperature was measured with a rectal thermistor and was maintained at 37°C with a PID feedback-controlled heat source (26). Solid-state transducers on the breathing valve measured airway pressure and flow. Pediatric electrodes were taped on the footpads for ECG. All physiologic signals were continuously collected (Coulbourn Instruments, Allentown, PA) and displayed on a computer using LabVIEW software (National Instruments, Austin, TX) for the duration of the experiment. These signals were also used to control the triggering for all the imaging sequences described. At the conclusion of the studies, the animals were euthanized with an overdose of anesthesia.
Imaging Protocol: General
Helium (~1.0 L) was polarized using the spin-exchange optical pumping technique (IGI.9600.He; Magnetic Imaging Technologies, Inc., Durham, NC) (8). Imaging was performed using a 2.0 T 18-cm horizontal bore magnet (Oxford Instruments, Oxford, UK) with shielded gradients (180 mT/m, GE NMR Instruments, Fremont, CA) interfaced to a GE EXCITE console running v. 12M4 (GE Healthcare, Milwaukee, WI). The console has been modified to operate at 64.8 MHz to image HP 3He, and at 85.5 MHz to image 1H. A dual-frequency birdcage coil (7 cm in diameter and 7 cm in length) was used for data acquisition. The animal was in a prone position on a support cradle during imaging. Coronal and axial proton images were acquired to localize the animal within the field of view (FOV).
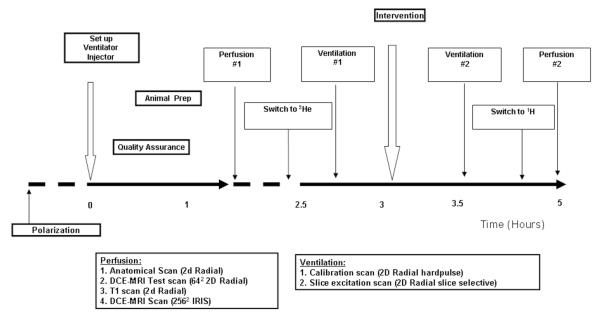
The protocol, shown in Figure 2, started with polarization, animal setup, ventilator and injection setup, and a series of quality assurance checks. This was followed by the perfusion imaging, which included: a) an anatomical scan to define the coronal slice of interest just behind the heart, b) a single injection DCE-MRI scan imaged using a dynamic radial acquisition (RA) sequence (17) to confirm the placement of the jugular catheter, c) a T1 series to estimate contrast agent concentration in the DCE-MRI images and, d) an IRIS image at high spatial and temporal resolution using 4 contrast injections to estimate perfusion. Perfusion imaging was followed by a hyperpolarized 3He ventilation imaging protocol that included: a) a calibration image acquired using non-slice selective static RA sequence and, b) a ventilation image acquired using a slice-selective static RA sequence. The animal was then administered the airway obstruction by injecting ~100 μl of surgical cement followed by ~500 μl of air through the catheter placed in the tracheal tube. The airway obstruction caused the airway pressure to increase, which was monitored using the physiological monitoring system. Ventilation and perfusion imaging was performed again following airway obstruction. The details of the techniques and the parameters used to acquire the anatomical, ventilation, and perfusion images are described next.
Figure 2.
Protocol for imaging pulmonary and perfusion airway obstruction.
The protocol for imaging ventilation and perfusion in each rat before and after airway obstruction ensured that there was enough time between two perfusion studies for the contrast agent to wash out from the first perfusion imaging experiment. The protocol also allowed sufficient time for hypoxic vasoconstriction to occur after airway obstruction. The protocol included imaging the anatomy, estimating a T1 map, imaging perfusion with DCE-MRI using IRIS (17), and imaging ventilation with HP 3He. These imaging procedures were performed both before and after airway obstruction.
The airway obstruction model is an instantaneous model that creates a localized block in ventilation; however, we do not know the effect of the model on perfusion. To understand the impact of the airway obstruction on the changes in blood flow, DCE-MRI studies of pulmonary perfusion were done before airway obstruction and 50 min after obstruction and 100 min after obstruction in one animal. This study was used to determine the time taken for hypoxic vasoconstriction to occur. Imaging of ventilation/perfusion was performed in N=6 rats with the described imaging protocol before and 100 min after airway obstruction. Care was taken during the imaging protocol to maintain the registration between the different images.
Imaging: Anatomical
Anatomical imaging was carried out using a radial sequence gated at end-expiration. A total of 1600 views of k-space are acquired to regrid the data on a 2562 matrix with 2X oversampling by acquiring 20 views per ventilatory trigger. Other scan parameters are as follows: TE/TR=0.7/20 ms, BW=62.5 kHz, FOV=55 mm, and slice thickness=3 mm. The flip angle is set to the Ernst angle given by
| 1 |
where, α is the flip angle, TR is the repetition rate, and T1 is the longitudinal relaxation time, for maximum signal-to-noise-ratio (SNR). The FOV, slice thickness and the resolutions are selected so that the datasets from all modalities (1H / 3He / DCE-MRI) are registered.
Imaging: Ventilation
Our protocol for ventilation imaging is carried out in two steps: 1) using a non-slice selective sequence for signal calibration and, 2) using a slice-selective sequence to acquire the slice of interest. The non-slice selective sequence is used for calibration of the signal intensity to the volume of 3He. The slice-selective sequence is used to image the same slice as acquired in the anatomical scan to maintain registration. The imaging is carried out at end-expiration using a variable flip angle technique (27). Since the acquisition is carried out over multiple breaths, the variable flip angle technique ensures that all of the magnetization is completely destroyed at the end of each breath so as to prevent corruption of signal from the previous breath. The scan parameters for 3He ventilation at end-expiration apnea are as follows: TE/TR=0.7/5 ms, BW=62.5 kHz, FOV=55 mm, slice thickness=3 mm, 20 views per trigger. A total of 800 views were acquired to reconstruct a 2562 matrix. The amount of HP gas used during the imaging is ~2 ml/breath, i.e. a total gas consumption of 80 ml.
Extracting ventilation changes for this study consisted of estimating the distribution of 3He volume in the slice of interest. The distribution of volume of 3He in each voxel of the slice was estimated by converting the signal intensity to volume of HP gas. The technique was originally proposed for quantitative analysis of ventilation in a mouse model of asthma (30). The quantification was carried out by selecting 2 rectangular regions of interest that span the width of the trachea, integrating the signal intensity within those regions and mapping it to the cylindrical volume contained in that region. The mapping of the signal intensity to volume of 3He is carried out by simply taking the ratio of the signal intensity in that voxel and the integrated signal intensity in the cylindrical region and multiplying this ratio with the cylindrical volume of the selected region. The underlying assumption is that the cylindrical region of the trachea consists of pure 3He. While this assumption is accurate for the inner regions in the trachea, voxels at the edges may contain only partial volume of 3He; however this does not significantly affect the estimation of volume of 3He. For slice-selective images however, we cannot guarantee that the trachea will be visible in the slice of interest. To overcome this problem, a non-slice selective image was acquired to estimate the calibration factor and this factor was then used to normalize the slice-selective images. By applying the calibration to the slice selective images, we could estimate the distribution of gas volume in each voxel. The quantitative estimation of gas volumes was performed by an in-house MATLAB (The MathWorks Inc., Natick, MA, USA) code.
Imaging: Perfusion
A single T1 map before the injection of the contrast agent enables the conversion of signal intensity from a DCE-MRI image into contrast concentration in each voxel, which is then used in the estimation of perfusion parameters. A voxel-by-voxel T1 map is estimated using a series of images at a constant TR and different flip angles. The details of the estimation of the T1 map are provided in the next section. The imaging parameters for the fast radial sequence used to capture the T1 series are as follows: TE/TR=0.7/4 ms, BW=62.5 kHz, FOV=55 mm, slice thickness=3 mm, number of views=1600. The images are acquired at suspended respiration for ~8 s using a fast fixed-flip angle radial sequence. Images are acquired at 12 different flip angles from 5° to 60° in steps of 5°. The image was acquired for a 128 × 128 reconstruction. The data was zero padded to a 2562 matrix and reconstructed to match the DCE-MRI data acquired using IRIS.
A test scan at low spatial and low temporal resolution is carried out using a single contrast injection with a dynamic RA sequence (17) that undersamples the k-space at each time-point. 2D radial acquisition sequence parameters were: TE/TR=0.8/4.0 ms, flip angle=40°, FOV=55 mm, and slice thickness=3 mm. Imaging is performed by suspending the respiration for ~8 s and waiting for the first detectable ECG pulse to trigger both the scanner and injector. The triggering of the injector is delayed by 2 s as compared to the scanner to allow the acquisition of pre-contrast arrival baseline images. Normal respiration is restored at the end of the injection. Dynamic images are reconstructed by regridding the acquired k-space lines on a 642 grid at a temporal resolution of 400 ms.
High spatio-temporal resolution perfusion imaging was carried out using IRIS (17), for the slice of interest. Imaging was triggered at suspended ventilation (~8 s) at the arrival of the first detectable ECG pulse. The process was repeated for 4 injections—between injections, the animal was normally ventilated for 5 s. During each injection, the sequence acquired a unique set of k-space lines such that a time-compressed dataset was super-sampled and formed a reference dataset. This reference dataset was used to fill the periphery of the k-space for each individual time-point using a sliding window-keyhole technique detailed in (17,28,29). The flip angle was chosen to be an angle higher than the Ernst angle. Pre-contrast images were acquired before the contrast injection study and after injection, to create a difference map. The difference map was primarily used to eliminate the view-view signal variations that might be caused due to factors other than the contrast injection. The scan parameters for the sequence were as follows: TE/TR=0.7/4 ms, BW=62.5 kHz, FOV=55 mm, slice thickness=3 mm. A total of 8000 views were acquired with 4 injections leading to 2000 views/injection. The 8000 views were divided into 20 individual samples of k-space leading to 400 views per image for a 2562 reconstruction, which is an undersampling factor of 2X. A more detailed description of the acquisition and reconstruction is provided in (17).
Quantitative methods for perfusion imaging using DCE-MRI have been developed extensively for cerebral blood flow imaging (18,31) and adapted for pulmonary imaging. The first step in the process was to estimate the T1 at each voxel in the image before injecting the contrast agent. The estimation of static T1 values in vivo is typically carried out by using fast imaging techniques such as GRASS (32), which uses a train of RF pulses resulting in a signal equation given by:
| 2 |
where α is the flip angle. The above equation can be rewritten as:
| 3 |
where , which allows us to estimate the T1 for each voxel by using a series of images acquired at different flip angles (α) (33).
Acquiring a series of these images at various flip angles, typically 5°-60° in steps of 5° at a fixed TR of around 4 ms, allows us to calculate a T1 image using TOPPCAT plugin (34), within ImageJ <http://rsbweb.nih.gov/ij/> (35), which was developed by the National Institutes of Health.
Blood flow, blood volume, and mean transit times were calculated by an in-house MATLAB code that uses the static T1 images and the signal intensity vs. time images captured using IRIS to generate contrast concentration vs. time images. The operator was prompted to select a region of interest in the pulmonary artery. The artery was used as the Arterial Input Function (AIF), which is then deconvolved using singular value decomposition from the contrast concentration vs. time images for each voxel to generate the pulmonary blood flow map (18,31). Integrating the concentration vs. time curves over time, generates the pulmonary blood volume maps. The ratio of the pulmonary blood flow and the blood volume estimates the mean transit time maps.
The images were analyzed using an in-house MATLAB script that calculates the ratio of HP gas distribution map (V) and the pulmonary blood flow map (Q). The calculations were carried out for both pre- and post-airway obstruction generating 2 sets of V/Q images. Histograms of the Log (V/Q) were generated for the obstructed lung and the contralateral lung to study the heterogeneity of the V/Q ratio before and after intervention resulting in 4 groups of data. The SD of the Log (V/Q) was extracted for these 4 groups and used as the quantitative biomarker to analyze the effect of the airway obstruction. The calculations were repeated for the N=6 rats and the data were pooled together to create the mean histogram of the V/Q ratio in the injured and contralateral lung before and after airway obstruction. The SD of Log (V/Q) was calculated for pre-contralateral lung, post-contralateral lung, pre-injury lung, post-injury lung, and were analyzed using a Student’s t-test to determine statistical differences within the groups.
3. RESULTS
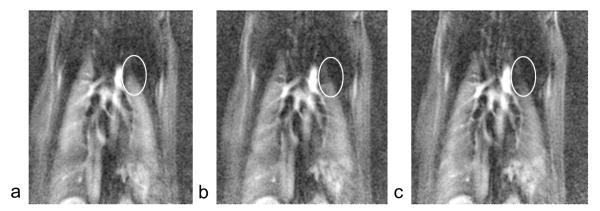
Figure 3 shows a selected timeframe at the peak of contrast agent wash-in/washout from the dynamic contrast enhanced datasets for a rat before airway obstruction, 50 min after airway obstruction, and 100 min after airway obstruction. Note the slight reduction in blood flow to the top-left lung (oval) at 50 min after airway obstruction, and higher reduction in blood flow at 100 min after airway obstruction compared to before airway obstruction. This study showed that airway obstruction caused hypoxic vasoconstriction that increased over time. The study also provided an estimate of the time it takes for the vasoconstriction to set in, which is helpful in determining the time between the intervention and post-intervention imaging.
Figure 3.
Selected time frame from DCE-MRI series a) before airway obstruction, b) 50 min after airway obstruction, and c) 100 min after airway obstruction. The images show reduction in contrast concentration on the top left lobe.
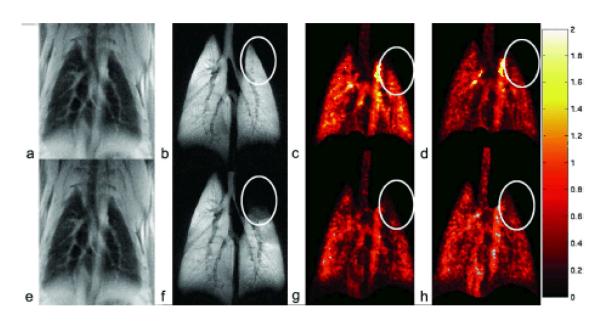
Figure 4 shows a complete study that includes the anatomical image, the ventilation image, the pulmonary blood flow image, and pulmonary blood volume images for one rat before and 100 min after airway obstruction. The airway obstruction is localized to the upper left lung, as shown by the oval selected in the ventilation image (Figure 4f). There are no detectable changes in the anatomical image (Figure 4e); however there are noticeable changes in the pulmonary blood flow and the pulmonary blood volume (Figure 4g, h) in the upper-left lung after airway obstruction compared to corresponding images before airway obstruction (Figure 4c, d). There are other changes in the blood flow throughout the lung; however, the changes in the upper-left lung can be easily picked up by an observer for qualitative analysis. Further quantitative analysis of the data was performed using the SD of Log (V/Q) in 6 rats, as shown next.
Figure 4.
Upper row (a-d) shows the anatomical, ventilation, pulmonary blood flow (μl/100 μl/s) and pulmonary blood volume (μl) image in a rat before airway obstruction. The lower row (e-h) shows the same set of images in the same animal after airway obstruction. There are visually detectable changes in the ventilation and pulmonary blood flow as shown by the ovals.
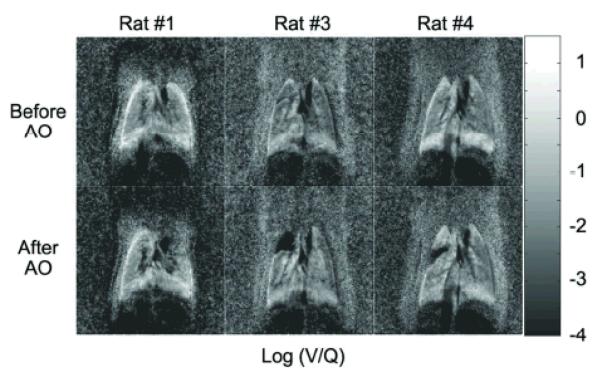
Figure 5 shows the Log (V/Q) images for 3 representative rats from the group of 6 before (top row) and after (bottom row) airway obstruction. The amount of localized airway obstruction created in each rat is <15% of the total lung volume. The bright boundaries of the lung observed in rat #1 and rat #4 are likely due to slight misregistration. The slight misregistration may be caused by the changes in the lung volumes between ventilation images that are acquired at end-expiration and perfusion images that are acquired at suspended respiration. We calculated the alignment mismatch to be ~ 500 microns, which corresponds to approximately 2 pixels. Care was taken to exclude those regions in our analysis.
Figure 5.
Top row shows the Log (V/Q) images created from 3 rats from N=6, before airway obstruction. Bottom row shows the Log (V/Q) images after airway obstruction for the corresponding rats. The region of airway obstruction is small (approx 15% of the lung) in all the rats.
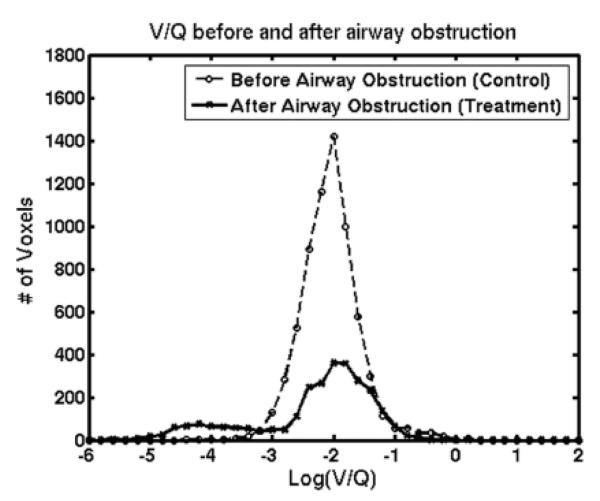
Figure 6 shows the histogram of Log (V/Q) created from 6 rats by combining the regions of interest in the injured and contralateral lung for before and after airway obstruction. The heterogeneity of the V/Q values in the lung before airway obstruction is low, as indicated by the standard deviation of 0.26, which lies within the range of values reported for normal rats using other imaging techniques (4). The heterogeneity of the V/Q values in the lung after airway obstruction is higher with a SD of 0.85, when compared to before airway obstruction.
Figure 6.
Histogram of Log (V/Q) created by combining data for N=6 animals before airway obstruction and after airway obstruction.
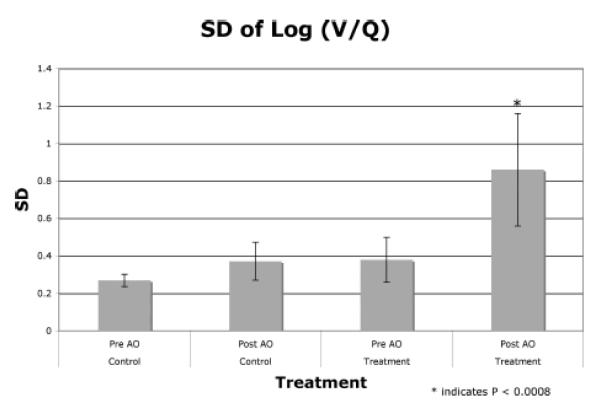
Figure 7 plots the mean of the SD of Log (V/Q) and the variability as shown by the error bars for 2 regions, namely the control lung (contralateral lung) and the treatment lung (injured lung) before and after airway obstruction for all the 6 animals. The injured lung shows a significantly (p < 0.008) higher heterogeneity as compared to the other groups. Even the variability of the response for the injured lung after airway obstruction is higher than the variability for the other groups as shown by the error bars. The mean of the SD for the 3 groups (Pre-AO–control, Post-AO–control, and Pre-AO–treatment) are within the normal values published in the literature (4).
Figure 7.
Comparative graphs for the 4 different groups in the contralateral and the injured lung before and after airway obstruction.
4. DISCUSSION
The proposed technique for combined studies of ventilation and perfusion in a disease model performed well in our initial evaluation. The work details the protocol for performing combined imaging of ventilation and perfusion in an animal and also applies the developed methods for quantitative ventilation and perfusion in a disease model of localized airway obstruction. The technique uses the standard deviation of the Log (V/Q) as a biomarker to study the heterogeneity of the V/Q distribution in normal and disease conditions. Although only a small portion of the lung is affected by the airway obstruction (typically 10-15%), the technique is sensitive to these changes. The technique is sensitive in detecting the changes that occur in ventilation and perfusion due to airway obstruction leading to hypoxic vasoconstriction.
The normalization method for ventilation provides reproducible measures across the population of animals studied. Using the signal intensity from the large airway in the projection (non-slice selective) image allows one to remove the majority of signal variations arising from day-to-day changes in polarization and polarization decay occurring during the study.
Several factors affect the calculations of pulmonary blood flow—regional vs. global arterial input function, dispersion, and delay of the bolus. The factor that affects our work most is the selection of the arterial input function (AIF). The imaging slice of interest, just behind the heart, contains the major pulmonary blood vessels such as the pulmonary artery, the pulmonary vein, and the descending aorta. By selecting the pulmonary artery as the AIF, we minimize the delay and the dispersion of the contrast bolus. However, partial volume effects may be associated with the selection of the slice, which in turn, affects the calculation of blood flow. But, the protocol we have defined includes a pre-injury measure that is used as a reference to measure the change in flow with greater confidence.
For combined imaging studies, one of the main concerns is the registration between the ventilation and the perfusion images. The ventilation images are acquired over multiple breaths using a respiratory-triggered sequence, which is triggered at end-expiration that is defined at 75% of the duty cycle of respiratory signal. Perfusion images are acquired at suspended respiration of approx 8 s, which means that the diaphragm of the animal is relaxing during this time. It has been observed that the location of the diaphragm in the chest wall is slightly different for these two states leading to a slight misregistration of ~500 microns (~ 2 pixels) in each dimension between the ventilation and perfusion images. Currently, analysis of V/Q is performed using regions that overlap between the two images. However, we can correct for the misregistration by using image registration techniques that use mutual information (36,37).
In this study, we used the SD of log (V/Q) as the biomarker to study the changes before and after airway obstruction. While an absolute change in ventilation and perfusion might be interesting to study, it is effective to directly report these values only if we can make an absolute measurement, as these values are bound to change from one scanner to another, and from one institute to another. However, the effect on the heterogeneity of the relative measures can still be compared across scanners and institutions, making the biomarker robust and reliable. Also, while with MRI we can visualize blood vessels as well as lung parenchyma, we have avoided selecting the larger blood vessels in our region of interest. The SD due to the presence of smaller blood vessels has been reported in the normal regions before and after the airway obstruction, and this accounts for the variability that might occur due to the presence of blood vessels in the region of interest in the affected lung. This variability is much smaller than the variability post-airway obstruction.
5. CONCLUSION
We have developed a protocol for combined quantitative ventilation and perfusion imaging in the rat lung. The technique provides consistent, reproducible biomarkers that are very sensitive to changes/mismatch in V/Q. The mean SD of Log (V/Q), which is typically the biomarker used in V/Q studies, was 0.26 prior to the injury for the 6 animals studied. This mean is well within the range of 0.16-0.30 reported by Sando et al. (4) and Rhodes et al. (3). The variation of this metric (STD of Log (V/Q)) was less than 13 % for all 6 animals. This shows statistically significant differences between the control and the treatment group of rats showing airway obstruction. The protocol described here provides a critical quantitative biomarker for image-based pulmonary function in the small animal. The measures are readily linked to clinical methods allowing direct comparison of preclinical and clinical results. Our expectation is that this will prove valuable in an ever-increasing number of preclinical applications.
Acknowledgements
All work was performed at the Duke Center for In Vivo Microscopy, an NIH/NCRR National Biomedical Research Center (P41 RR005959), with additional support from NCI Small Animal Imaging Resource Program (U24 CA092656). The authors would like to thank Dr. William M. Foster and Dr. Bastiaan Driehuys for helpful discussions on pulmonary physiology and hyperpolarized He imaging.
References
- 1.West JB. In: Respiratory physiology-the essentials. 5th ed Coryell PA, editor. Williams & Wilkins; Baltimore: 1995. p. 193. [Google Scholar]
- 2.Balogh L, Andoncs G, Thuroczy J, Nemeth T, Lang J, Bodoi K, Janoki GA. Veterinary nuclear medicine. Scintigraphical examinations - a review. Acta Vet Brno. 1999;68:231–239. [Google Scholar]
- 3.Rhodes CG, Valind SO, Brudin LH, Wollmer PE, Jones T, Buckingham PD, Hughes JMB. Quantification of regional V/Q ratios in humans by use of PET. 2. Procedure and normal values. J Appl Physiol. 1989;66(4):1905–1913. doi: 10.1152/jappl.1989.66.4.1905. [DOI] [PubMed] [Google Scholar]
- 4.Sando Y, Inoue T, Nagai R, Endo K. Ventilation/perfusion ratios and simultaneous dual-radionuclide single-photon emission tomography with krypton-81m and technetium-99m macroaggregated albumin. Eur J Nucl Med. 1997;24(10):1237–1244. doi: 10.1007/s002590050147. [DOI] [PubMed] [Google Scholar]
- 5.Schuster DP, Kovacs A, Garbow J, Piwnica-Worms D. Recent advances in imaging the lungs of intact small animals. Am J Respir Cell Mol Biol. 2004;30:129–138. doi: 10.1165/rcmb.2003-0213TR. [DOI] [PubMed] [Google Scholar]
- 6.Bergin CJ, Pauly JM, Macovski A. Lung parenchyma: projection reconstruction MR imaging. Radiology. 1991;179:777–781. doi: 10.1148/radiology.179.3.2027991. [DOI] [PubMed] [Google Scholar]
- 7.Black RD, Middleton H, Cates GD, Cofer GP, Driehuys B, Happer W, Hedlund LW, Johnson GA, Shattuck MD, Swartz J. In-vivo He-3 MR images of guinea pig lungs. Radiology. 1996;199:867–870. doi: 10.1148/radiology.199.3.8638019. [DOI] [PubMed] [Google Scholar]
- 8.Happer W, Miron E, Schaefer S, Schreiber D, Wijngaarden W, Zeng X. Polarization of the nuclear spins of noble-gas atoms by spin exchange with optically pumped alkali-metal atoms. Phys Rev A. 1984;29:3092–3110. [Google Scholar]
- 9.Ebert M, GroBmann T, Heil W, Otten WE, Surkau R, Leduc M, Bachert P, Knopp MV, Schad LR. Nuclear magnetic resonance imaging on humans using hyperpolarized 3He. Lancet. 1996;347:1297–1299. doi: 10.1016/s0140-6736(96)90940-x. [DOI] [PubMed] [Google Scholar]
- 10.MacFall JR, Charles HC, Black RD, Middleton H, Swartz JC, Saam B, Driehuys B, Erickson CJ, Happer W, Cates GD, Johnson GA, Ravin CE. Human lung air spaces: potential for MR imaging with hyperpolarized He-3. Radiology. 1996;200:553–558. doi: 10.1148/radiology.200.2.8685356. [DOI] [PubMed] [Google Scholar]
- 11.Mai VM, Liu B, Polzin JA, Li W, Kurucay S, Bankier AA, Knight-Scott J, Madhav P, Edelman R, Chen Q. Ventilation-perfusion ratio of signal intensity in human lung using oxygen-enhanced and arterial spin labeling techniques. Magn Reson Med. 2002;48:341–350. doi: 10.1002/mrm.10230. [DOI] [PubMed] [Google Scholar]
- 12.Hatabu H, Gaa J, Kim D, Li W, Prasad PV, Edelman RR. Pulmonary perfusion: qualitative assessment with dynamic contrast-enhanced MRI using ultra-short TE and inversion recovery turbo FLASH. Magn Reson Med. 1996;36:503–508. doi: 10.1002/mrm.1910360402. [DOI] [PubMed] [Google Scholar]
- 13.Johnson GA, Cofer GP, Hedlund LW, Maronpot RR, Suddarth SA. Registered 1H and 3He magnetic resonance microscopy of the lung. Magn Reson Med. 2001;45:365–370. doi: 10.1002/1522-2594(200103)45:3<365::aid-mrm1047>3.0.co;2-0. [DOI] [PubMed] [Google Scholar]
- 14.Berthezene Y, Vexler V, Clement O, Muhler A, Moseley ME, Brasch RC. Contrast-enhanced MR imaging of the lung: assessments of ventilation and perfusion. Radiology. 1992;183:667–672. doi: 10.1148/radiology.183.3.1584916. [DOI] [PubMed] [Google Scholar]
- 15.Cremillieux Y, Berthezene Y, Humblot H, Viallon M, Canet E, Bourgeois M, Albert T, Heil W, Briguet A. A combined 1H perfusion/3He ventilation NMR study in rat lungs. Magn Reson Med. 1999;41:645–648. doi: 10.1002/(sici)1522-2594(199904)41:4<645::aid-mrm1>3.0.co;2-v. [DOI] [PubMed] [Google Scholar]
- 16.Adolphi NL, Kuethe DO. Quantitative mapping of ventilation-perfusion ratios in lungs by F-19 MR imaging of T-1 of inert fluorinated gases. Magn Reson Med. 2008;59(4):739–746. doi: 10.1002/mrm.21579. [DOI] [PubMed] [Google Scholar]
- 17.Mistry NN, Pollaro J, Song JY, De Lin M, Johnson GA. Pulmonary perfusion imaging in the rodent lung using dynamic contrast-enhanced MRI. Magn Reson Med. 2008;59:289–297. doi: 10.1002/mrm.21353. [DOI] [PMC free article] [PubMed] [Google Scholar]
- 18.Ostergaard L, Sorensen AG, Kwong KK, Weisskoff RM, Gyldensted C, Rosen BR. High resolution measurement of cerebral blood flow using intravascular tracer bolus passages. Part II: Experimental comparison and preliminary results. Magn Reson Med. 1996;36:726–736. doi: 10.1002/mrm.1910360511. [DOI] [PubMed] [Google Scholar]
- 19.Elwood W, Lotvall JO, Barnes PJ, Chung KF. Characterization of allergen-induced bronchial hyperresponsiveness and airway inflammation in actively sensitized Brown-Norway rats. Journal of Allergy and Clinical Immunology. 1991;88(6):951–960. doi: 10.1016/0091-6749(91)90253-k. [DOI] [PubMed] [Google Scholar]
- 20.Waypa GB, Chandel NS, Schumacker PT. Model for hypoxic pulmonary vasoconstriction involving mitochondrial oxygen sensing. Circ Res. 2001;88(12):1259–1266. doi: 10.1161/hh1201.091960. [DOI] [PubMed] [Google Scholar]
- 21.Witt W, Baldus B, Bringmann P, Cashion L, Donner P, Schleuning WD. Thrombolytic properties of Desmodus-Rotundus (Vampire bat) salivary plasminogen-activator in experimental pulmonary-embolism in rats. Blood. 1992;79(5):1213–1217. [PubMed] [Google Scholar]
- 22.Kasahara Y, Tuder RM, Taraseviciene-Stewart L, Le Cras TD, Abman S, Hirth PK, Waltenberger J, Voelkel NF. Inhibition of VEGF receptors causes lung cell apoptosis and emphysema. J Clin Invest. 2000;106(11):1311–1319. doi: 10.1172/JCI10259. [DOI] [PMC free article] [PubMed] [Google Scholar]
- 23.Wright JL, Churg A. Animal models of cigarette smoke-induced COPD. Chest. 2002;122(6):301S–306S. doi: 10.1378/chest.122.6_suppl.301s. [DOI] [PubMed] [Google Scholar]
- 24.Hedlund LW, Chen XJ, Chawla MS, Cofer GP, Cates GD, Happer W, Wheeler CT, Johnson GA. Pulmonary airway obstruction in an animal model: MRI detection using hyperpolarized 3He. ISMRM 5th Scientific Meeting; Vancouver, British Columbia, Canada. April 12-18, 1997.p. 183. [Google Scholar]
- 25.Chen B, Yordanov A, Johnson G. Ventilation-synchronous MR microscopy of pulmonary structure and ventilation in mice. Magn Reson Med. 2005;53(1):69–75. doi: 10.1002/mrm.20307. [DOI] [PubMed] [Google Scholar]
- 26.Qui H, Cofer G, Hedlund L, Johnson G. Automated feedback control of body temperature for small animal studies with MR microscopy. IEEE Trans Biomed Eng. 1997;44:1107–1113. doi: 10.1109/10.641338. [DOI] [PubMed] [Google Scholar]
- 27.Zhao L, Mulkern R, Tseng C-H, Williamson D, Patz S, Kraft R, Walsworth RL, Jolesz FA, Albert MS. Gradient-Echo Imaging Considerations for Hyperpolarized129Xe MR. J Magn Reson, Series B. 1996;113(2):179–183. [PubMed] [Google Scholar]
- 28.Song HK, Dougherty L. k-Space weighted image contrast (KWIC) for contrast manipulation in projection reconstruction MRI. Magn Reson Med. 2000;44:825–832. doi: 10.1002/1522-2594(200012)44:6<825::aid-mrm2>3.0.co;2-d. [DOI] [PubMed] [Google Scholar]
- 29.Song HK, Dougherty L. Dynamic MRI with projection reconstruction and KWIC processing for simultaneous high spatial and temporal resolution. Magn Reson Med. 2004;52:815–824. doi: 10.1002/mrm.20237. [DOI] [PubMed] [Google Scholar]
- 30.Mistry NN, Driehuys B, Johnson GA. Quantitative analysis of MCh induced ventilation changes in mouse lungs. Joint ISMRM-ESMRMB 14th Scientific Meeting; Berlin, Germany. May 19-25, 2007. [Google Scholar]
- 31.Ostergaard L, Weisskoff RM, Chesler DA, Gyldensted C, Rosen BR. High resolution measurement of cerebral blood flow using intravascular tracer bolus passages. Part I: Mathematical approach and statistical analysis. Magn Reson Med. 1996;36:715–725. doi: 10.1002/mrm.1910360510. [DOI] [PubMed] [Google Scholar]
- 32.Sechtem U, Pflugfelder PW, White RD, Gould RG, Holt W, Lipton MJ, Higgins CB. CINE MR Imaging - potential for the evaluation of cardiovascular function. AJR Am J Roentgenol. 1987;148(2):239–246. doi: 10.2214/ajr.148.2.239. [DOI] [PubMed] [Google Scholar]
- 33.Deoni SCL, Rutt BK, Peters TM. Rapid combined T-1 and T-2 mapping using gradient recalled acquisition in the steady state. Magn Reson Med. 2003;49(3):515–526. doi: 10.1002/mrm.10407. [DOI] [PubMed] [Google Scholar]
- 34.Barboriak DP, MacFall JR, Padua AO, York GE, Viglianti BL, Dewhirst MW. Standardized software for calculation of Ktrans and vp from dynamic T1-weighted MR images. Presented at the International Society for Magnetic Resonance in Medicine Workshop on MR in Drug Development: From Discovery to Clinical Therapeutic Trials; McLean VA. 2004. [Google Scholar]
- 35.Rasband WS. ImageJ. U. S. National Institutes of Health; Bethesda, Maryland, USA: 1997. [Google Scholar]
- 36.Maes F, Collington A, Vandermuelen D, Marchal G, Suetens P. Multimodality image registration by mutual information. IEEE Trans Med Imag. 1997;16(2):187–198. doi: 10.1109/42.563664. [DOI] [PubMed] [Google Scholar]
- 37.Wells WM, 3rd, Viola P, Atsumi H, Nakajima S, Kikinis R. Multi-modal volume registration by maximization of mutual information. Med Image Anal. 1996;1(1):35–51. doi: 10.1016/s1361-8415(01)80004-9. [DOI] [PubMed] [Google Scholar]


