Abstract
Purpose
To investigate tissue dependence of the MRI-based thermometry in frozen tissue by quantification and comparison of signal intensity and T2* of ex vivo frozen tissue of three different types: heart muscle, kidney and liver.
Materials and Methods
Tissue samples were frozen and imaged on a 0.5T MRI scanner with ultrashort echo time (UTE) sequence. Signal intensity and T2* were determined as the temperature of the tissue samples was decreased from room temperature to approximately −40°C. Statistical analysis was performed for [−20°C, −5°C] temperature interval.
Results
The findings of this study demonstrate that signal intensity and T2* are consistent across three types of tissue for [−20°C, −5°C] temperature interval.
Conclusion
Both parameters can be used to calculate a single temperature calibration curve for all three types of tissue and potentially in the future serve as a foundation for tissue-independent MRI-based thermometry.
Keywords: cryoablation, T2*, hydration water, frozen tissue
INTRODUCTION
MR-guided cryoablation is a promising method for minimally invasive therapy of prostate, liver, and kidney tumors (1). It is also being developed for preventing the most common cardiac arrhythmias in both children and adults (2). MRI provides good 3D visualization of ice-ball formation and growth as well as an outstanding depiction of the anatomy surrounding the region of treatment. The recent review of MRI-guided cryoablation by Morrison et al. (3) reports good clinical results using this therapy for selected patients, in a range of organ systems. The review also reveals the technical feasibility and limitations of the method. One limitation of MRI guidance is the inability to visualize thermal variations across the frozen tissue. MRI imaging does not show if sufficiently cold end temperatures, which are necessary for successful treatment, were achieved throughout the ice-ball.
The latter limitation is true for conventional MRI, where the frozen tissue region appears as a signal void due to the shortening of the apparent spin-spin relaxation time T2* in frozen tissue. However, ultrashort echo time (UTE) magnetic resonance imaging methods allow the measurement of MR signal in frozen tissue (4, 5). According to the models for tissue water described by de Vre (6) and Fullerton (7), the source of this measurable MR signal in frozen tissue is the hydration and crystalline layers of macromolecules.
Provided there is sufficiently measurable MR signal from frozen tissue, an elegant temperature monitoring method can be developed for clinical therapy. Such a method would be based on the quantification of temperature-sensitive MR parameters in different tissue types. Previously, spin-spin and spin-lattice relaxation times were measured with NMR methods by Fung and Belton (8, 9) in frozen muscle. In more recent studies (4, 10, 11), using a clinical MRI scanner, the MR parameters were studied in frozen canine prostate tissue in vivo, and in muscle and liver tissue ex vivo. In those studies, signal intensity (SI), the apparent spin-spin relaxation time (T2*), and rate (R2*=1/T2*) were measured and correlated to temperature. They found that the signal intensity and T2* of frozen tissue decreased monotonically with decreasing temperature.
Although there are preliminary data demonstrating the behavior of SI, T2* and R2* in a few types of frozen tissue, as mentioned above, the consistency of these MR parameters between different types of frozen tissue has not yet been demonstrated. Without consistency, prior to each cryo treatment in a particular tissue type, a separate step quantifying the relationship between a temperature-sensitive MR parameter and temperature would be required. Therefore, the overall goal of our research is to develop a tissue-independent method for frozen tissue thermometry. The specific objective of this study was to explore the behavior of the two temperature-sensitive MR parameters in three types of ex vivo frozen tissue: heart muscle, kidney and liver.
MATERIALS AND METHODS
Freshly excised ex vivo porcine tissue samples (sample size n = 3 for each) were studied. The three samples of any particular tissue type came from separate animals. The samples were selected by gross inspection for homogeneity. The heart muscle samples were taken from the wall of the left ventricle. The kidney samples were taken from the kidney cortex. The liver samples were taken from the area of the liver with few visible blood vessels. Each of the tissue samples measured 10 mm × 10 mm × 25 mm.
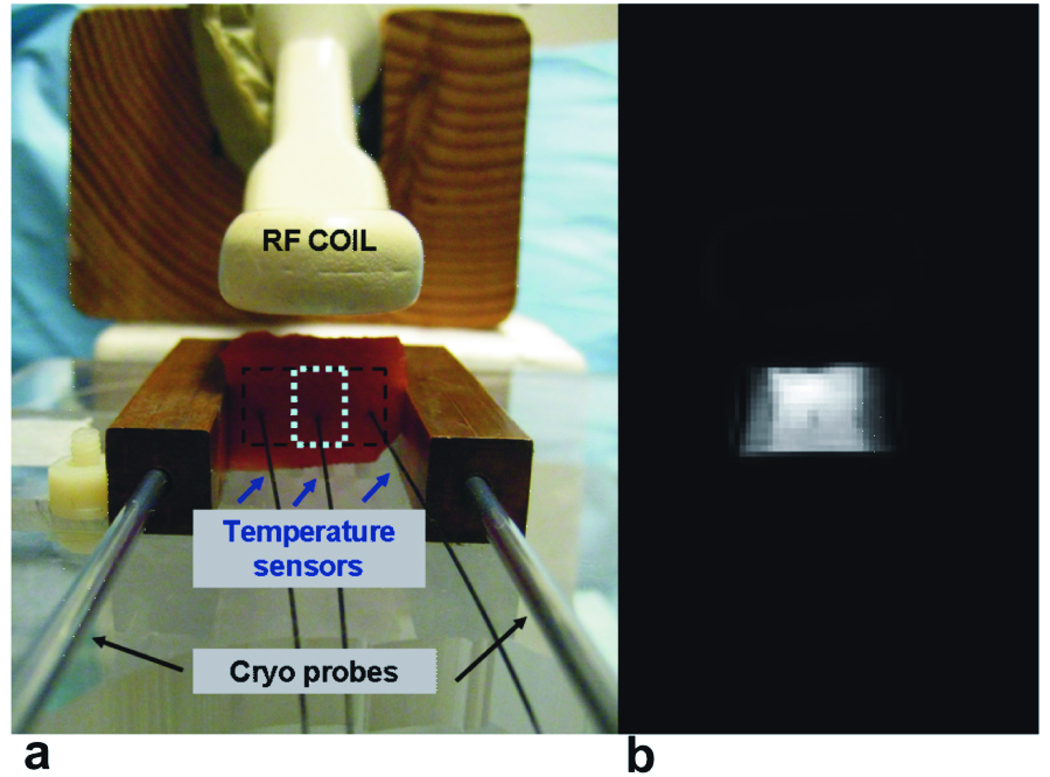
Imaging was performed with a 0.5T Signa SP interventional scanner (GE, Milwaukee, WI). A receive-only endorectal coil was placed adjacent to the tissue samples, as shown in Figure 1a. Figure 1a shows the setup for freezing and imaging the tissue samples. Two 12 mm × 12 mm × 65 mm copper blocks were placed in contact with the tissues, on either side of the sample, 25 mm apart. A cryo probe (Oncura Medical Ltd., Israel) was inserted into each copper block, and was used to freeze the tissue. The copper blocks were placed parallel to the main magnetic field. Three fiber-optic temperature sensors (Luxtron, Santa Clara, CA) were placed into the tissue: one in the middle of the sample and two others 5–8 mm away from the copper blocks. By simultaneous cooling of both cryoprobes, the temperature of the samples was decreased from room temperature to approximately −40°C in steps of 2–7 °C. Monitoring the readings of the sensors in the outer locations where the temperature varied faster allowed for better control of the cryoprobes in order to achieve a desired steady-state temperature in the center of the tissue sample. At each step the temperature in the center of the sample was held constant for a minimum of 3 minutes, in order to complete image acquisition.
Figure 1.
a. Experimental setup at 0.5T. An ER (endorectal) receive-only coil is placed on top of the tissue slab, which is fixed between two copper blocks 25mm apart. The tissue is cooled with cryo probes inserted into each copper block. The tissue temperature is measured with three temperature sensors inserted into the tissue. b. Example of a magnitude image of a tissue sample, acquired during cooling.
A UTE pulse sequence with radial ramp sampling was used for imaging. Although 2D imaging was performed, no slice select gradient was used during the RF pulse. This was done to minimize any eddy current effects from the slice select gradient, so that the imaging slice thickness was the same as the sample thickness = 10mm. Images were acquired in the x–y (axial) plane. Pulse sequence parameters included flip angle = 60°, TR = 200 ms, FOV = 200 mm, matrix size = 256×256 and readout bandwidth = 31.25 kHz. At each temperature step, three images were sequentially acquired at the following echo times: 210µs, 460µs, and 710µs. The echo time TE is defined here as the time interval between the end of the RF pulse and the start of data acquisition.
Signal Intensity Measurements
Signal intensity measurements were corrected for noise bias according to the method described in (12). To measure the standard deviation of the image noise, two images were acquired at room temperature with the same imaging parameters, for each of the 3 echo times. The noise power σ2N was calculated from the difference image in the ROI inside the sample (~8 × 20 pixels, dashed lines in Figure 1b). The corrected SI was calculated as a square root of a difference between the squared mean SI calculated in the ROI (~8 × 4 pixels, dotted lines in Figure 1b) around the middle temperature sensor and the noise power. To eliminate differences in the coil-to-sample distance and variability in tissue sample size among all the experiments, the SI data were then normalized to the baseline SI value at room temperature. The corrected and normalized SI data from the images acquired with TE = 210 µs were used for analysis of the signal intensity changes with respect to temperature.
T1 – compensation of Signal Intensity
Since the TR was equal to or shorter than the T1 of the unfrozen tissue, the baseline magnitude images had T1-weighting varying between different tissue types. Therefore, normalization of the SI data to the baseline SI at room temperature was biased by this T1-weighting. In an attempt to eliminate the baseline T1 weighting effect on the SI normalization, prior to the normalization step, the SI data were multiplied by the following T1 compensation factors (CF) calculated for each of the three tissue types:
| [1] |
where T1(T) was calculated in the following way. First, T1 values for T = 40°C and NMR frequency of 20 MHz were obtained from Bottomley et al. (13): pig heart muscle: 688 ms, kidney: 405 ms, and liver: 182 ms. Then, T1 values in unfrozen tissue were estimated as T1(T) = T1(40°C) – 0.01*(40°C – T), since T1 has been reported to decrease by approximately 1% per 1°C (14). For frozen tissue (T < 0°C), based on literature reports (15, 16), the T1 value for all three types of tissue was taken as 90ms. After SI data at each temperature point were compensated for the T1-weighting effects, the compensated data were normalized to the room temperature baseline SI value.
T2* measurements
At each echo time, the SI values were averaged over the ROI around the middle temperature sensor, and the mean value was corrected for noise bias as described above. The natural logarithm of the corrected values was taken, and T2* was estimated by a linear least square fit to the slope of the linear regression.
Statistical Analysis
Statistical analysis was performed for the temperature interval [−20°C; −5°C], where the lower limit was chosen based on the SNR for the longest echo time measurement, and the higher limit was chosen 5 degrees below 0°C to minimize the chance of any free water remaining unfrozen. To estimate the effects of independent variables, i.e. temperature and tissue type on the dependent variables of signal intensity and T2*, population-average generalized estimating equations (PA-GEE) GLM regressions with log link of the dependent variable on the independent variables were performed, with tissue sample as the clustering variable. P-values less than 0.05 were considered significant. Analysis was done using Stata Release 9.2 (StataCorp, College Station, TX).
RESULTS
Signal Intensity
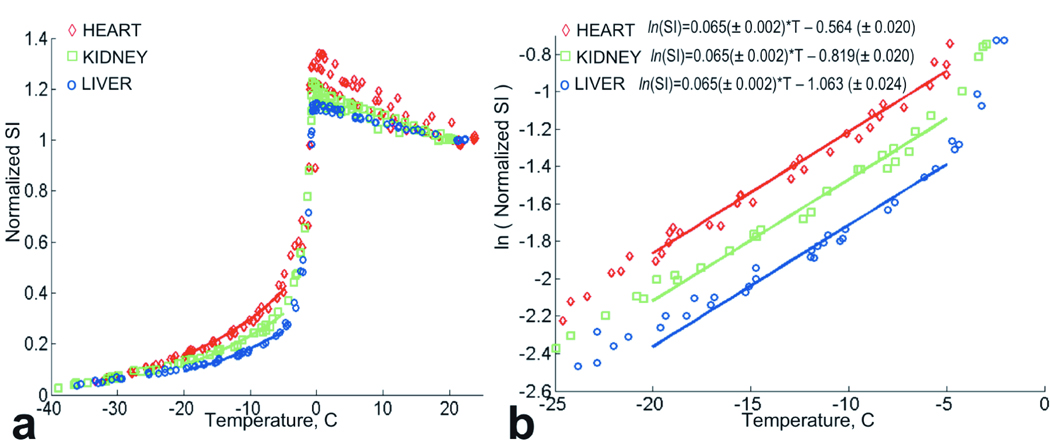
The normalized signal intensity data (without T1 compensation) for the three types of tissue are shown in Figure 2a. As the tissue temperature decreases, there is an increase in signal intensity initially. This increase is due to the T1 shortening with lower temperature and an increase in magnetization, as predicted by the Boltzman distribution. After reaching a maximum value at approximately 0°C, the signal intensity drops rapidly due to free water crystallization and T2* shortening. Below 0°C the normalized SI decreases exponentially. There was a significant difference found between normalized SI of the three types of tissue: all pair-wise p = 0.0001 (Figure 2a). However, comparing the natural logarithm of the normalized SI of the tissues (shown in Figure 2b) revealed that the linear fits for all three types of tissue had the same slope in the analyzed temperature interval. In other words, SI decreases with temperature T exponentially at the same rate for heart, kidney and liver tissue. The plot and the equations of Figure 2b show how the intercept values of the logarithm of the normalized SI fits vary for the different tissues.
Figure 2.
a. Normalized signal intensity data for heart, kidney and liver tissue. The three data sets for each tissue types are grouped together. Solid lines indicate exponential fits for temperature interval [−20°C ; −5°C]. b. Natural logarithm of the normalized signal intensity for heart, kidney and liver tissues. Three data sets for each tissue types are grouped. Solid lines indicate linear fits to the ln(normalized SI) for temperature interval [−20°C ; −5°C].
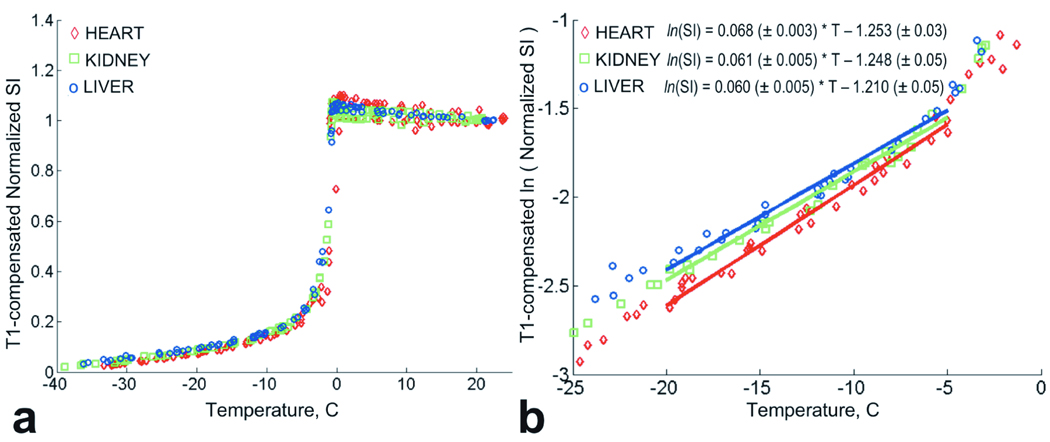
The results of the T1 compensated signal intensity analysis are shown in Figure 3a. The regression indicated no significant differences in T1 compensated normalized SI among heart, kidney and liver. There is also no significant difference in the rates of SI decrease with temperature between the tissues. A marginal difference was found between heart and liver (p=0.048). In comparison to the uncompensated SI results, the difference in the intercept values for the logarithm of the normalized SI was diminished as shown in Figure 3b.
Figure 3.
a. T1-compensated normalized signal intensity for heart, kidney and liver tissue grouped by tissue type. b. Natural logarithm of T1-compensated normalized signal intensity for heart, kidney and liver tissues grouped by tissue type. Solid lines indicate linear fits to the ln(normalized SI) for temperature interval [−20°C ; −5°C].
T2*
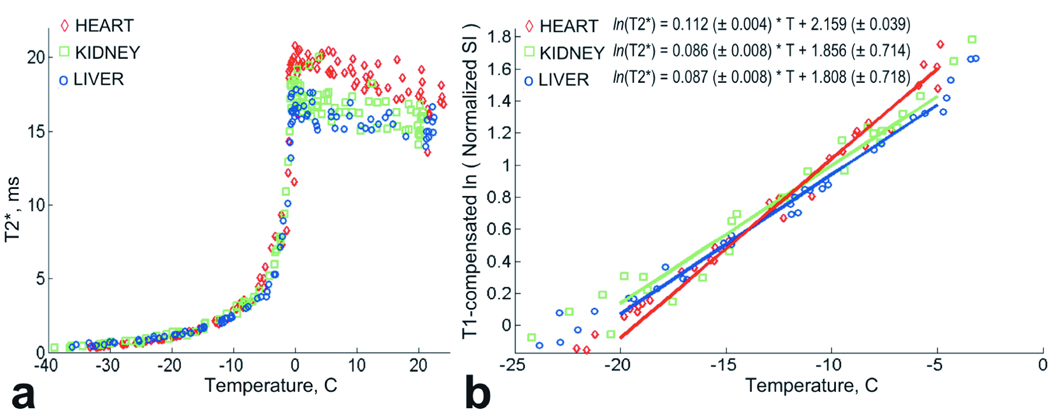
Calculated T2* values for the frozen tissue are shown in Figure 4a. From room temperature to T = 0°C, a slight increase of T2* values was observed. Below T = 0°C, T2* decreased rapidly from 18ms +/− 2ms to approximately 4ms at T = −5°C. For temperatures below −5°C, T2* decreased more slowly, and the T2* data were modeled with exponential functions.
Figure 4.
a. Plot of T2* data for heart, kidney and liver tissue grouped by tissue type. b. Plot of ln(T2*) data for heart, kidney and liver tissue grouped by tissue type. Solid lines indicate linear fits to the ln(T2*) for temperature interval [−20°C ; −5°C].
The regression indicated no difference in T2* between liver and kidney, but a significant difference between those two tissues and heart (heart vs. kidney, p = 0.0001; heart vs. liver, p = 0.0001). Also, the rate of T2* decrease with temperature differed between heart and the other two tissues (heart vs. kidney, p = 0.001; heart vs. liver, p = 0.001).
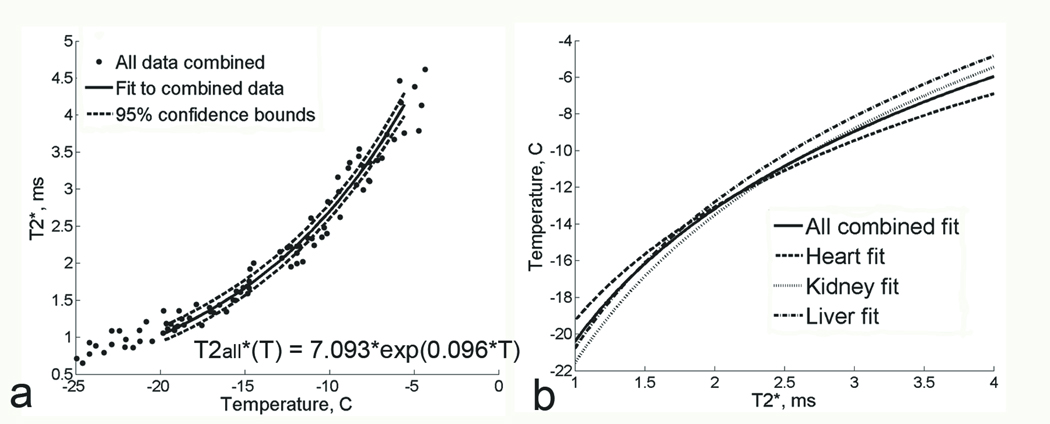
To determine the magnitude of the difference between the T2* of heart versus the other two tissues, data from all three tissue types were pooled to create a single regression fit for the combined data (Figure 5a). The fit for the combined data was compared with the fits for each kind of tissue in Figure 5b. This plot shows that if the temperature in frozen tissue was predicted based on the T2*(T) curve for all three tissue data combined (solid line), the error in temperature estimation between the “combined” curve and the individual tissue T2* curves (dotted line) would not exceed 1.5°C for each of the tissue types.
Figure 5.
a. Plot of T2* measurements as a function of temperature at 0.5T, for all tissue types combined together. Solid line represents the exponential fit to combined data;. 95% confidence bounds are shown with dashed lines. b. Plot of T2* fits for the individual tissue types (dashed lines) and for all tissue data combined (solid line). T2* is on the X axis and temperature is on the Y axis here to illustrate an example temperature calibration curve.
DISCUSSION
The results of our study show that both signal intensity and T2* decrease exponentially as temperature decreases in heart, kidney and liver tissue. After T1-compensation there is no significant difference in the normalized SI in frozen heart, kidney and liver tissues. T2* values in frozen liver and kidney are statistically indistinguishable. However, for the frozen heart tissue, T2* appears to decrease with temperature at a slightly greater rate than liver or kidney.
Analysis of the normalized SI data could be potentially simplified if T1-weighting was avoided by selecting a long enough TR. From a practical point of view, increasing the scan time may result in inaccurate estimation of rapidly changing temperature of the tissue. Therefore, it may be beneficial to estimate T1 in the region of interest prior to the cryo procedure, using one of the rapid Look-Locker based techniques (17), and then using the measured T1 for T1-compensation. In our experiments T1 values of tissue samples were not measured, but were estimated from existing literature. In the Methods section, estimation of T1 values for T > 0°C is described in detail. There is no T1 data for frozen heart, kidney and liver tissue measured at 0.5T, for T < 0°C, However, for tissue with very low water content, Inch et al. (16) reported that all tissues approach the same T1 value of 90 ms (measured at 30 MHz for dried mouse liver, kidney and spleen). Fung et al. (15) measured T1 values in frozen rat liver at 20 MHz, and reported T1 values of approximately 40–50 ms between −30°C < T < 0°C. Based on these reports we assigned the same T1 of 90ms for all three tissue types for all temperatures below 0°C.
Analysis of the T2* data from the 0.5T study showed that at T > 0°C, T2* was different for the three tissue types. For all tissue types, when the temperature was reduced from about 20°C to 0°C, T2* increased by approximately 2 ms reaching T2* ≈ 20ms. Such behavior of T2* appears consistent with previously reported by Belton et al. (9) increase in T2 values of striated muscle cooled from 25°C to 5°C. T2* is a function of both T2 and T2′. Therefore, similar to the increase in T2, the increase in T2* observed here can be explained by the slow down of the free water proton diffusion with decreasing temperature. The slow down of free water proton diffusion leads to a slower exchange between the free water and the crystalline water. For all tissue types, T2* dropped to 4–5ms between 0°C and −5°C when the fraction of unfrozen water reached approximately 30% – 40%. Similarly, summarizing the studies by Clifford et al. (18) on solutions of human erythrocyte membrane in water, in (7) Fullerton et al. described a significant decrease of T2 to approximately 5.5ms when the water content was 36% and no free water remained.
This study revealed that in all three tissue types, T2* decreased exponentially with temperature. Kuntz et al. and Fuller (19, 20) also observed exponential decrease of T2* with temperature in their spectroscopic studies on hydration of proteins. From the exponential model fit obtained for the T2* data for the three types of tissue in this study, it was found that T2* in the heart muscle was significantly different from T2* in liver and kidney. For the purpose of MRI-based thermometry this statistical difference may be of little practical value, as was shown by comparing the fit to the pooled T2* data with individual fits. Temperature estimation relying on pooled T2* data vs. tissue-specific T2* data may result in errors up to ±1.5°C, nevertheless, for the clinical procedures, where desired nadir temperatures are −20°C and lower, such method appears promising. In addition, estimated here ±1.5°C errors will have smaller effect on temperature prediction than variations in temperature readings due to minor position offsets of thermocouples (10°C – 15°C per 1mm offset) that are currently being used (21).
Comparing the results of this study with T2* values reported in frozen in vivo prostate tissue by Wansapura et al. (11), it was found that T2* measured in the in vivo prostate was much longer than T2* measured here. Longer T2* results may be explained by possible imperfections of the imaging process: contamination of the short T2* signal by the out-of-slice signal from warm tissue, which has a longer T2*, could have caused a lengthening of T2*. Better short T2* imaging methods (22–24) suitable for in vivo imaging have been recently proposed and may help improve the accuracy of T2* estimation in the future studies.
Based on our findings both SI and T2*, can be used in MR thermometry. However, there are certain tradeoffs related to each parameter. Using SI may require an additional step of T1 estimation in the beginning of the procedure, but it will save time throughout the procedure since only acquisition at one echo time is necessary. A potential disadvantage of using this parameter is its dependence on coil position, and inability to distinguish between SI change from temperature versus change from coil displacement. T2*, on the other hand, is not sensitive to coil position as long as sufficient SNR is provided. This parameter is also independent on T1-weighting, which can eliminate the T1 estimation step. However, the T2* based method needs to acquire images at several echo times to be able to estimate T2*, which can increase the scan time.
In addition to the primary target of the study, our results reflecting on the great similarity between three types of frozen tissue may expand our understanding of the macromolecular composition of different tissues. The results obtained here are potentially beneficial to our knowledge about tissue hydration water. In turn, more knowledge about hydration water and macromolecular environment of different tissues may improve the overall theoretical understanding of other effects based on interaction of the “free water” and hydration water, such as magnetization transfer (MT).
In conclusion, the findings of this study demonstrate that both signal intensity and T2* are consistent across the three different tissue types: heart, kidney and liver. Based on such consistent behavior of SI and T2*, a single temperature calibration curve may be created for all three types of tissue using either of these parameters. This could be an important step toward non-invasive temperature determination in frozen tissue and can potentially make MRI guidance more efficient and desirable during cryoablation procedures.
Acknowledgments
Grant support: NIH RO1 CA092061, P41 RR009784.
REFERENCES
- 1.Gage AA, Baust JG. Cryosurgery for tumors. J Am Coll Surg. 2007;205:342–356. doi: 10.1016/j.jamcollsurg.2007.03.007. [DOI] [PubMed] [Google Scholar]
- 2.Kirsh JA, Gross GJ, O'Connor S, Hamilton RM. Transcatheter cryoablation of tachyarrhythmias in children: initial experience from an international registry. J Am Coll Cardiol. 2005;45:133–136. doi: 10.1016/j.jacc.2004.10.049. [DOI] [PubMed] [Google Scholar]
- 3.Morrison PR, Silverman SG, Tuncali K, Tatli S. MRI-guided cryotherapy. J Magn Reson Imaging. 2008;27:410–420. doi: 10.1002/jmri.21260. [DOI] [PubMed] [Google Scholar]
- 4.Butts K, Sinclair J, Daniel BL, Wansapura J, Pauly JM. Temperature quantitation and mapping of frozen tissue. J Magn Reson Imaging. 2001;13:99–104. doi: 10.1002/1522-2586(200101)13:1<99::aid-jmri1015>3.0.co;2-o. [DOI] [PubMed] [Google Scholar]
- 5.Wansapura JP, Daniel BL, Pauly J, Butts K. Temperature mapping of frozen tissue using eddy current compensated half excitation RF pulses. Magn Reson Med. 2001;46:985–992. doi: 10.1002/mrm.1285. [DOI] [PubMed] [Google Scholar]
- 6.Mathur-De Vre R. The NMR studies of water in biological systems. Prog Biophys Mol Biol. 1979;35:103–134. doi: 10.1016/0079-6107(80)90004-8. [DOI] [PubMed] [Google Scholar]
- 7.Fullerton GD, Potter JL, Dornbluth NC. NMR relaxation of protons in tissues and other macromolecular water solutions. Magn Reson Imaging. 1982;1:209–226. doi: 10.1016/0730-725x(82)90172-2. [DOI] [PubMed] [Google Scholar]
- 8.Fung BM. Non-freezable water and spin-lattice relaxation time in muscle containing a growing tumor. Biochim Biophys Acta. 1974;362:209–214. doi: 10.1016/0304-4165(74)90042-7. [DOI] [PubMed] [Google Scholar]
- 9.Belton PS, Jackson RR, Packer KJ. Pulsed NMR studies of water in striated muscle. I. Transverse nuclear spin relaxation times and freezing effects. Biochim Biophys Acta. 1972;286:16–25. doi: 10.1016/0304-4165(72)90084-0. [DOI] [PubMed] [Google Scholar]
- 10.Daniel BL, Butts K, Block WF. Magnetic resonance imaging of frozen tissues: temperature-dependent MR signal characteristics and relevance for MR monitoring of cryosurgery. Magn Reson Med. 1999;41:627–630. doi: 10.1002/(sici)1522-2594(199903)41:3<627::aid-mrm28>3.0.co;2-q. [DOI] [PubMed] [Google Scholar]
- 11.Wansapura JP, Daniel BL, Vigen KK, Butts K. In vivo MR thermometry of frozen tissue using R2* and signal intensity. Acad Radiol. 2005;12:1080–1084. doi: 10.1016/j.acra.2005.06.006. [DOI] [PubMed] [Google Scholar]
- 12.Gudbjartsson H, Patz S. The Rician distribution of noisy MRI data. Magn Reson Med. 1995;34:910–914. doi: 10.1002/mrm.1910340618. [DOI] [PMC free article] [PubMed] [Google Scholar]
- 13.Bottomley PA, Foster TH, Argersinger RE, Pfeifer LM. A review of normal tissue hydrogen NMR relaxation times and relaxation mechanisms from 1–100 MHz: dependence on tissue type, NMR frequency, temperature, species, excision, and age. Med Phys. 1984;11:425–448. doi: 10.1118/1.595535. [DOI] [PubMed] [Google Scholar]
- 14.Lewa CJMZ. Temperature relationships of proton spin-lattice relaxation time T1 in biological tissues. Bulletin du cancer. 1980;67:525–530. [PubMed] [Google Scholar]
- 15.Fung BM, Durham DL, Wassil DA. The state of water in biological systems as studied by proton and deuterium relaxation. Biochim Biophys Acta. 1975;399:191–202. doi: 10.1016/0304-4165(75)90225-1. [DOI] [PubMed] [Google Scholar]
- 16.Inch WR, McCredie JA, Knispel RR, Thompson RT, Pintar MM. Water content and proton spin relaxation time for neoplastic and non-neoplastic tissues from mice and humans. J Natl Cancer Inst. 1974;52:353–356. doi: 10.1093/jnci/52.2.353. [DOI] [PubMed] [Google Scholar]
- 17.Crawley AP, Henkelman RM. A comparison of one-shot and recovery methods in T1 imaging. Magn Reson Med. 1988;7:23–34. doi: 10.1002/mrm.1910070104. [DOI] [PubMed] [Google Scholar]
- 18.Clifford J, Pethica BA, Smith EG. Physical state of membrane constituents. In: Bolis L, Pethica BA, editors. Membrane models and the formation of biological membranes. Amsterdam: Holland Publishing; 1968. pp. 19–51. [Google Scholar]
- 19.Kuntz IDBT, Jr, Law GD, Purcell GV. Hydration of macromolecules. Science. 1969;163:1329–1331. doi: 10.1126/science.163.3873.1329. [DOI] [PubMed] [Google Scholar]
- 20.Fuller ME, 2nd, Brey WS., Jr Nuclear magnetic resonance study of water sorbed on serum albumin. J Biol Chem. 1968;243:274–280. [PubMed] [Google Scholar]
- 21.Baust J, Gage AA, Ma H, Zhang CM. Minimally invasive cryosurgery--technological advances. Cryobiology. 1997;34:373–384. doi: 10.1006/cryo.1997.2017. [DOI] [PubMed] [Google Scholar]
- 22.Lu A, Daniel BL, Pauly JM, Pauly KB. Improved slice selection for R2* mapping during cryoablation with eddy current compensation. J Magn Reson Imaging. 2008;28:190–198. doi: 10.1002/jmri.21396. [DOI] [PMC free article] [PubMed] [Google Scholar]
- 23.Josan S, Kaye E, Pauly JM, Daniel BL, Pauly KB. Improved half RF slice selectivity in the presence of eddy currents with out-of-slice saturation. Magn Reson Med. 2009;61:1090–1095. doi: 10.1002/mrm.21914. [DOI] [PMC free article] [PubMed] [Google Scholar]
- 24.Josan S, Pauly JM, Daniel BL, Pauly KB. Double half RF pulses for reduced sensitivity to eddy currents in UTE imaging. Magn Reson Med. 2009;61:1083–1089. doi: 10.1002/mrm.21879. [DOI] [PubMed] [Google Scholar]


