

Abstract
Purpose
To evaluate and compare the ability of optical coherence tomography (OCT) retinal nerve fiber layer (RNFL), optic nerve head, and macular thickness parameters to detect progressive structural damage in glaucoma.
Methods
This observational cohort study included 253 eyes of 253 patients. Images were obtained annually with the Stratus OCT (Carl Zeiss Meditec, Inc., Dublin, CA) along with optic disc stereophotographs and standard automated perimetry (SAP) visual fields. The median follow-up time was 4.01 years. Progression was determined by the Guided Progression Analysis software for SAP (Carl Zeiss Meditec, Inc.) and by masked assessment of optic disc stereophotographs performed by expert graders. Random coefficient models and receiver operating characteristic (ROC) curves were used to evaluate the relationship between change in Stratus OCT parameters over time and progression as determined by SAP and/or stereophotographs.
Results
From the 253 eyes, 31 (13%) showed progression over time by stereophotographs and/or SAP. Mean rates of change in average RNFL thickness were significantly higher for progressors compared with nonprogressors (−0.72 μm/y vs. 0.14 μm/y; P = 0.004), with sensitivity of 77% for specificity of 80%. RNFL parameters performed significantly better than ONH and macular thickness measurements in discriminating progressors from nonprogressors. The parameters with the largest ROC curve areas for each scanning area were inferior RNFL thickness (0.84), cup area (0.66), and inferior inner macula thickness (0.64).
Conclusions
Stratus OCT RNFL parameters discriminated between eyes progressing by visual fields or optic disc photographs and eyes that remained stable by these methods and performed significantly better than ONH and macular thickness parameters in detecting change over time.
Detection of longitudinal change plays a central role in the diagnosis and management of glaucoma. For patients with established diagnosis, detection of progression over time indicates uncontrolled disease and possible need for therapy advancement. For patients who are suspected of having the disease, detection of change can be used to confirm the diagnosis. Although automated perimetry has been the standard method for detecting progressive glaucoma, it is known that many eyes show changes to the retinal nerve fiber layer (RNFL) and/or optic nerve head (ONH) as the only sign of disease deterioration.1–5 Therefore, there is a need for methods that can provide objective and reliable longitudinal evaluation of structural damage in glaucoma.
OCT is an imaging technique originally developed to provide objective and quantitative estimates of the thickness of the RNFL. OCT RNFL measurements are reproducible and have been shown in cross-sectional studies to be able to discriminate glaucomatous from healthy eyes.6–19 Although a previous investigation suggested a potential role for longitudinal OCT RNFL measurements for monitoring glaucoma progression, the study used a prototype version of the OCT instrument which had larger variability and lower resolution than the current commercially available Stratus OCT (Carl-Zeiss Meditec, Inc., Dublin, CA), which provides high-resolution retinal imaging with time-domain (TD)OCT technology.20 Even though spectral domain (SD)OCT technology with higher speed and better image resolution than TDOCT has become recently available, SDOCT instruments are still under development, and TDOCT is still widely used for structural evaluation in glaucoma.21–24
Although OCT has been used, for the most part, for assessment of the RNFL thickness, the Stratus OCT is also capable of providing measurements of ONH topography and macular thickness.25,26 These measurements have been shown to be reproducible14,27,28 and, although they do not appear to be particularly helpful for glaucoma diagnosis,29 their role in longitudinal evaluation in glaucoma has not yet been reported.
The purpose of this study was to evaluate and compare the ability of Stratus OCT RNFL, ONH, and macular thickness parameters to detect progressive structural damage in a cohort of patients with glaucoma and individuals with suspected disease observed over time. Longitudinal changes in Stratus OCT measurements were compared with changes detected by conventional methods, including standard automated perimetry (SAP) and color stereophotographs of the optic disc.
Methods
This was an observational cohort study. Participants from this study were included in a prospective longitudinal study designed to evaluate optic nerve structure and visual function in glaucoma (DIGS; Diagnostic Innovations in Glaucoma Study) conducted at the Hamilton Glaucoma Center (University of California, San Diego). Participants in the DIGS were longitudinally evaluated according to a pre-established protocol that included regular follow-up visits in which patients underwent clinical examination and several other imaging and functional tests. All the data were entered in a computer database. All participants from the DIGS study who met the inclusion criteria were enrolled in the present study. Informed consent was obtained from all participants. The University of California San Diego Human Subjects Committee approved all protocols, and the methods adhered to the tenets of the Declaration of Helsinki.
At each visit during follow-up, subjects underwent a comprehensive ophthalmic examination, including review of medical history, best-corrected visual acuity, slit-lamp biomicroscopy, intraocular pressure (IOP) measurement, gonioscopy, dilated fundoscopic examination, stereoscopic optic disc photography, and automated perimetry with 24-2 Swedish Interactive Threshold Algorithm (SITA). Only subjects with open angles on gonioscopy were included. Subjects were excluded if they presented best-corrected visual acuity less than 20/40, spherical refraction outside ±5.0 D and/or cylinder correction outside 3.0 D, or any other ocular or systemic disease that could affect the optic nerve or the visual field.
The study included patients with diagnosed glaucoma as well as patients with suspected disease, as determined on the baseline visit. Eyes were classified as glaucomatous if they had repeatable (two consecutive) abnormal visual field test results during the baseline visits, defined as a pattern standard deviation (PSD) outside the 95% normal confidence limits, or a Glaucoma Hemifield Test result outside normal limits, regardless of the appearance of the optic disc. Eyes were classified as having suspected glaucoma if they had a history of elevated intraocular pressure (>21 mm Hg) and/or suspicious or glaucomatous appearance of the optic nerve but normal and reliable visual field results on the baseline visits.
Stratus OCT images were obtained annually during follow-up, and a minimum of three separate visits and 2 years of follow-up were required for inclusion in the study. In some visits, more than one image was available for analysis. The existence of multiple images during the same visit was taken into account during statistical analysis and used to evaluate the variability of Stratus OCT measurements. Eligible subjects were required to have had a visual field examination and optic disc stereophotographs taken close (within 6 months) to the baseline and last Stratus OCT scans. Baseline was set at the first occurrence of this matching, and the Stratus OCT date was used as the baseline date. During the follow-up time, each patient was treated at the discretion of the attending ophthalmologist. Only one eye of each patient was randomly selected as the study eye and imaged during follow-up.
Standard Automated Perimetry
Only reliable tests (≤33% fixation losses and false negatives, and <15% false positives) were included. Glaucomatous visual field progression was assessed using the Humphrey Field Analyzer (HFA; Carl Zeiss Meditec) Guided Progression Analysis (GPA) software. Progression by SAP GPA was defined as a statistically significant decrease in the pattern deviation values from the average of two baseline exams. Change in three or more of the same test points on three follow-up consecutive tests were required for confirmed progression.30
Stereophotograph Grading
Simultaneous stereoscopic optic disc photographs (TRC-SS; Topcon Instrument Corporation of America, Paramus, NJ) were reviewed using a stereoscopic viewer (Asahi Pentax Stereo Viewer II; Asahi Optical Co., Tokyo, Japan). For progression assessment, each patient's most recent stereophotograph was compared with the baseline one. Definition of change was based on focal or diffuse thinning of the neuro-retinal rim, increased excavation, and appearance or enlargement of RNFL defects. Evidence of progression was based on masked (patient name, diagnosis, temporal order of photographs) comparison between the baseline and most recent photograph, by two observers. If these observers disagreed, a third observer served as an adjudicator.
Stratus OCT
The commercially available optical coherence tomograph Stratus OCT (Carl Zeiss Meditec, Dublin, CA) was used for ocular imaging in subjects with dilated pupils.29 All patients had optic nerve head, RNFL thickness and macular thickness scans obtained during the same visit. Quality assessment of Stratus OCT scans was evaluated by an experienced examiner masked to the subject's other test results. Good-quality scans had to have focused images from the ocular fundus, adequate signal strength (>6 for RNFL and macula scans), and the presence of a centered circular ring around the optic disc (for RNFL scans). For macula and ONH scans, the radial scans had to be centered on the fovea and optic disc, respectively. RNFL scans were also evaluated as to the adequacy of the algorithm for detection of the RNFL. Only scans without overt algorithm failure in detecting the retinal borders were included in the study.
RNFL Thickness Measurements
The fast RNFL algorithm was used to obtain RNFL thickness measurements with Stratus OCT. Three images were acquired from each subject, with each image consisting of 256 A-scans along a 3.4-mm-diameter circular ring around the optic disc. Parapapillary RNFL thickness parameters automatically calculated by existing Stratus OCT software (ver. 4.0) and evaluated in this study were average thickness (360° measure), temporal quadrant thickness (316°–45°), superior quadrant thickness (46°–135°), nasal quadrant thickness (136°–225°), and inferior quadrant thickness (226°–315°).
Optic Nerve Head Measurements
The Fast Optic Disc scanning protocol (software ver. 4.0) was used to obtain ONH measurements with Stratus OCT, as described elsewhere. In optic nerve head scans, the device automatically determines the disc margin as the end of the retinal pigment epithelium/choriocapillaris layer. One can manually adjust the demarcation of the edge of the retinal pigment epithelium to improve the outlining of the disc margin. However, the automatically determined default disc margin was used in this study to minimize subjectivity.
Macular Thickness Measurements
The Fast Macular Thickness protocol (software ver. 4.0) was used to obtain macular thickness measurements with Stratus OCT, as described in detail elsewhere.29 Three concentric circles divide the macular thickness map into three zones: fovea, inner macula, and outer macula. The inner and outer zones are further divided into four quadrants by two diagonal lines. Thus, a total of nine areas (fovea, superior outer, superior inner, inferior outer, inferior inner, temporal outer, temporal inner, nasal outer, and nasal inner) are available for analysis. For example, inner inferior macular thickness refers to the thickness of the macula in the inferior region in the inner ring around the fovea. For this study, concentric circles with default diameters of 1, 3, and 6 mm were used to divide the macular thickness map. Average macular thickness was calculated as the weighted average of the sectoral macular thickness measurements excluding the fovea.
Statistical Analysis
Random coefficient models were used to evaluate the relationship between Stratus OCT measurements and progression as determined by SAP or stereophotographs. We have used these models to investigate the rate of RNFL change in glaucoma by scanning laser polarimetry with variable and enhanced corneal compensation.31–33
Stratus OCT parameters were considered as the dependent variable. Progression as assessed by stereophotographs and SAP was included as a fixed-effect covariate (variable PROG in the model below) with a value of 1 if the eye progressed by stereophotographs and/or SAP and a value of 0 if the eye did not show progression with any of these methods. Time (variable TIME) was included as a continuous predictor. The significance of the coefficients associated with the variable TIME indicates whether there is a significant trend in Stratus OCT measurements over time, that is, whether Stratus OCT measurements tend to decrease or increase significantly over time. The two-way interaction between TIME and PROG was included in the model to evaluate whether there was a significant difference in longitudinal Stratus OCT measurements over time between progressors and non-progressors. The following random components were added to the model: random eye–specific effects associated with both the intercept and slope (i.e., the effect of time) for each eye and random effects associated with the intercept for each visit nested within the eye (due to the multiple images acquired on each visit for each eye). The general form of the model for an individual Stratus OCT measurement y at visit t (time during follow-up) on eye i (denoted by OCTyti) was as follows:
The parameters β0 through β3 represented the fixed effects associated with the intercept, time, progression, and the two-way interaction between progression and time; ζ0i and ζ1i were random eye effects associated with the intercept and time slope, respectively; ζ0t|i represented the random effects associated with multiple measures during the same visit or time t; and εyti represented the residual.
Estimates of rates of change for individual eyes were obtained by best linear unbiased prediction (BLUP). ROC curves of rates of change were used to describe the ability to differentiate progressors from nonprogressors for each Stratus OCT software-provided parameter. The ROC curve shows the tradeoff between sensitivity and 1 – specificity. An area under the ROC curve of 1.0 represents perfect discrimination, whereas an area of 0.5 represents chance discrimination. The method of DeLong et al.34 was used to compare areas under the ROC curve.
Statistical analyses were performed with an α level (type I error) set at 0.05 (Stata ver. 10.0; StataCorp, College Station, TX).
Results
The study included 253 eyes of 253 patients with a mean ± SD age at baseline of 63 ± 12 years. One hundred forty-five (57%) patients were women. Median follow-up time was 4.1 years (first quartile, 3.0 years; third quartile, 5.0 years). From the 253 eyes included in the study, 105 (42%) had a diagnosis of glaucoma, and 148 (58%) were considered to have suspected glaucoma. Median (first quartile, third quartile) MD and PSD of the visual field closest to the baseline imaging test date in glaucomatous eyes were −2.79 dB (−4.77, −1.80) and 3.13 dB (2.43, 5.67). Corresponding values for eyes with suspected glaucoma were −0.56 dB (−1.39, −0.06) and 1.59 dB (1.42, 1.86).
Of the 253 eyes, 31 (13%) showed progression over time by optic disc stereophotographs and/or visual fields. Of the 31 progressing eyes, 13 (42%) showed progression only by SAP GPA, 12 (39%) only by optic disc stereophotographs, and 6 (19%) by both methods. Table 1 shows baseline Stratus OCT measurements in progressing and nonprogressing eyes.
Table 1.
Baseline Stratus OCT Measurements
| Progressors (n = 31) |
Nonprogressors (n = 222) |
P | |
|---|---|---|---|
| Average thickness | 77.3 ± 17.6 | 90.1 ± 14.5 | <0.001 |
| Superior average | 97.1 ± 25.8 | 111.6 ± 20.8 | 0.005 |
| Inferior average | 86.5 ± 27.2 | 1130 ± 23.4 | <0.001 |
| Nasal average | 65.7 ± 14.8 | 70.5 ± 17.6 | 0.107 |
| Temporal average | 60.0 ± 17.1 | 65.4 ± 14.4 | 0.102 |
| VIRA | 0.15 ± 0.15 | 0.29 ± 0.22 | <0.001 |
| HIRW | 1.20 ± 0.28 | 1.50 ± 0.29 | <0.001 |
| Rim area | 0.97 ± 0.37 | 1.33 ± 0.49 | <0.001 |
| Cup area | 1.39 ± 0.62 | 1.05 ± 0.55 | 0.007 |
| Cup/disc area | 0.57 ± 0.17 | 0.43 ± 0.20 | <0.001 |
| Average macula | 232.3 ± 21.8 | 240.9 ± 154 | 0.043 |
| Superior outer macula | 219.9 ± 21.5 | 227.6 ± 16.4 | 0.063 |
| Inferior outer macula | 202.3 ± 17.7 | 217.7 ± 17.0 | <0.001 |
| Nasal outer macula | 234.7 ± 25.9 | 243.7 ± 18.5 | 0.069 |
| Temporal outer macula | 200.8 ± 18.0 | 212.3 ± 14.7 | 0.002 |
| Superior inner macula | 258.0 ± 26.6 | 265.0 ± 18.1 | 0.167 |
| Inferior inner macula | 250.5 ± 23.6 | 261.8 ± 17.1 | 0.015 |
| Nasal inner macula | 257.8 ± 28.0 | 267.1 ± 193 | 0.081 |
| Temporal inner macula | 243.5 ± 22.5 | 253.3 ± 16.8 | 0.026 |
| Fovea | 162.7 ± 25.4 | 164.7 ± 26.0 | 0.695 |
Data are shown for eyes with progression shown by visual fields and/or stereophotographs and in eyes that remained stable according to both methods
VIRA, vertically integrated rim area; HIRW, horizontally integrated rim width.
To illustrate the random coefficient models used in the study, we report in Table 2 the results of the model when applied to investigate changes in the Stratus OCT average RNFL thickness parameter. Mean baseline average RNFL thickness was significantly lower in progressors compared with nonprogressors (variable PROG; β1 = −12.5 μm; P < 0.001). The mean rate of change in RNFL thickness was −0.72 μm/y in progressors compared with 0.14 μm/y in nonprogressors. The significance (P = 0.004) of the interaction term (β3; PROG × TIME) indicates that the difference between rates of RNFL loss over time in the two groups was statistically significant. As the nonprogressor group was used as reference category (0 in the variable PROG), the coefficient of the variable TIME (β1) indicates the rate of loss in the nonprogressing group (as the interaction term PROG × TIME will be 0). The mean rate of change in nonprogressors was not significantly different from 0 (P = 0.179). To obtain the rate of loss in the progressing group, it is necessary to add the coefficient β1 (0.14 μm/y) to that of the interaction term β3 (−0.86 μm/y), which results in −0.72 μm/y. Figure 1 shows the rates of change versus baseline Stratus OCT average RNFL thickness measurements in progressors and nonprogressors. The area under the ROC curve for discriminating progressors versus nonprogressors with the Stratus OCT average RNFL thickness was 0.83 (95% CI, 0.74 – 0.92). Table 3 shows rates of change in the other Stratus OCT RNFL thickness parameters as well as the corresponding areas under the ROC curves, to discriminate progressors from nonprogressors. The parameter inferior average had the largest area under the ROC curve of 0.84 (95% CI, 0.77–0.92), although it was similar to the average thickness parameter.
Table 2.
Results of the Random Coefficients Model for the Stratus OCT Parameter Average Thickness
| Parameter | Coefficient | Estimate | 95% CI | P |
|---|---|---|---|---|
| Intercept | β0 | 90.3 | 88.4 to 92.2 | <0.001 |
| TIME | β1 | 0.14 | −0.06 to 0.34 | 0.179 |
| PROG | β2 | −12.5 | −18.1 to −7.00 | <0.001 |
| PROG × TIME | β3 | −0.86 | −1.45 to −0.27 | 0.004 |
Figure 1.
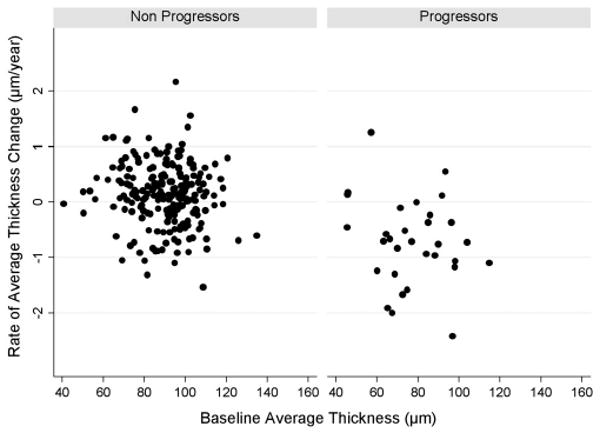
Rates of change versus baseline Stratus OCT average RNFL thickness measurements in progressors and nonprogressors.
Table 3.
Rates of Change in Stratus OCT RNFL Thickness Parameters
| Parameter | Nonprogressors | Progressors | P | ROC Curve Area (95% CI) |
|---|---|---|---|---|
| Average thickness | 0.14 (0.10) | −0.72 (0.28) | 0.004 | 0.83 (0.74–0.92) |
| Superior average | −0.62 (0.19) | −1.52 (0.52) | 0.099 | 0.81 (0.73–0.89) |
| Inferior average | 0.56 (0.18) | −0.55 (0.43) | 0.007 | 0.84 (0.77–0.92) |
| Nasal average | 0.40 (0.19) | −0.15 (0.53) | 0.327 | 0.58 (0.46–0.70) |
| Temporal average | 0.22 (0.13) | −0.21 (0.36) | 0.264 | 0.61 (0.50–0.71) |
Data are mean rate of change (SE) in progressors versus nonprogressors with corresponding areas under the ROC curves.
Table 4 shows mean rates of change in the Stratus OCT ONH topographic parameters in progressors versus nonprogressors, as well as the corresponding areas under the ROC curves. A statistically significant difference between mean rates of change in progressors versus nonprogressors was observed only for the parameter cup area. For this parameter, the mean rate of change in progressors was 0.035 mm2/y compared with 0.008 mm2/y in nonprogressors (P = 0.011). However, the ability to discriminate progressors from nonprogressors for this parameter was poor, with an ROC curve area of only 0.66. Figure 2 shows rates of change versus baseline Stratus OCT cup area measurements in progressors and nonprogressors.
Table 4.
Rates of Change in Stratus ONH Parameters
| Parameter | Nonprogressors | Progressors | P | ROC Curve Area (95% CI) |
|---|---|---|---|---|
| VIRA | −0.0002 (0.002) | −0.014 (0.014) | 0.327 | 0.51 (0.40–0.62) |
| HIRW | 0.003 (0.003) | 0.009 (0.010) | 0.631 | 0.44 (0.32–0.56) |
| Rim area | 0.007 (0.007) | 0.012 (0.014) | 0.753 | 0.48 (0.37–0.60) |
| Cup area | 0.008 (0.005) | 0.035 (0.009) | 0.011 | 0.66 (0.54–0.78) |
| Cup/disc area | −0.001 (0.002) | 0.004 (0.004) | 0.283 | 0.57 (0.43–0.70) |
| Vertical C/D ratio | 0.0004 (0.002) | 0.006 (0.004) | 0.223 | 0.57 (0.45–0.68) |
| Horizontal C/D ratio | −0.002 (0.002) | −0.001 (0.006) | 0.897 | 0.56 (0.44–0.68) |
Data are as described in Table 3.
VIRA, vertically integrated rim area; HIRW, horizontally integrated rim width.
Figure 2.

Rates of change versus baseline Stratus OCT cup area measurements in progressors and nonprogressors.
Table 5 shows mean rates of change in the Stratus OCT macular thickness parameters in progressors versus nonprogressors and the corresponding areas under the ROC curves. No statistically significant differences were found in mean rates of change between progressors and nonprogressors for any of the macular thickness parameters. Figure 3 shows rates of change versus baseline Stratus OCT average macular thickness in progressors and nonprogressors. None of the macular thickness measurements was able to successfully discriminate progressors from nonprogressors, as is evident from the ROC curve areas close to 0.5 for all parameters. The macular thickness parameter with largest ROC curve area was inferior inner macular thickness with an ROC curve area of 0.64 (95% CI, 0.51–0.76).
Table 5.
Rates of Change in Stratus OCT Macular Thickness Parameters
| Parameter | Nonprogressors | Progressors | P | ROC Curve Area (95% CI) |
|---|---|---|---|---|
| Average macula | −0.60 (0.13) | −0.75 (0.39) | 0.707 | 0.54 (0.41–0.66) |
| Superior outer macula | −0.68 (0.16) | −0.32 (0.59) | 0.560 | 0.51 (0.39–0.62) |
| Inferior outer macula | −0.09 (0.17) | −0.83 (0.43) | 0.116 | 0.60 (0.48–0.72) |
| Nasal outer macula | −0.09 (0.16) | −0.71 (0.52) | 0.269 | 0.62 (0.51–0.73) |
| Temporal outer macula | −0.51 (0.18) | −0.22 (0.43) | 0.538 | 0.50 (0.39–0.71) |
| Superior inner macula | −0.69 (0.16) | 0.03 (0.63) | 0.329 | 0.47 (0.35–0.59) |
| Inferior inner macula | −0.42 (0.16) | −1.50 (0.56) | 0.070 | 0.64 (0.51–0.76) |
| Nasal inner macula | −0.87 (0.19) | −0.56 (0.44) | 0.531 | 0.47 (0.35–0.58) |
| Temporal inner macula | −0.79 (0.18) | −1.43 (0.46) | 0.201 | 0.60 (0.49–0.72) |
| Fovea | 0.74 (0.30) | 0.83 (0.99) | 0.931 | 0.50 (0.38–0.72) |
Data are as described in Table 3.
Figure 3.

Rates of change versus baseline Stratus OCT average macular thickness measurements in progressors and nonprogressors.
Figure 4 shows the ROC curves for rates of change of the parameters with largest areas under the ROC curves to discriminate progressors versus nonprogressors for each scanning area: inferior RNFL thickness, cup area, and inferior inner macular thickness. The ROC curve area for inferior RNFL thickness was significantly higher than that for cup area (P = 0.003) and inferior inner macular thickness (P = 0.003). Figure 4 also shows the ROC curve for the parameter average RNFL thickness.
Figure 4.
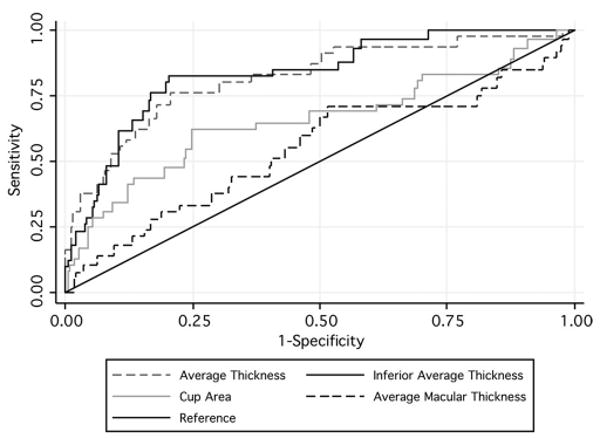
ROC curves of rates of change for discriminating progressors from nonprogressors of the three parameters with largest areas under the ROC curves in each scanning area and the average RNFL thickness.
Because of the differences in baseline measurements of Stratus OCT parameters between progressors and nonprogressors, we also built models for each parameter incorporating baseline measurements and their interactions with time as fixed-effects covariates. These models enabled the evaluation of rates of change in progressors and nonprogressors while adjusting for baseline differences and also the investigation of the effect of baseline measures on the ability to detect change over time. The results were similar to models without the baseline covariates. For average RNFL thickness, for example, the mean rates of change for progressors and nonprogressors were −0.77 μm/y versus 0.02 μm/y, respectively (P = 0.049), for an adjusted baseline average RNFL thickness of 90 μm. We were not able to find a statistically significant effect of baseline measurements on the rate of change over time (P = 0.979).
Discussion
In this study, we found that eyes that showed progression by standard methods (i.e., SAP visual fields and optic disc stereophotographs) had significantly higher rates of RNFL loss over time as measured by the Stratus OCT than did eyes that remained stable. Also, RNFL thickness parameters performed significantly better than ONH and macular thickness parameters for detection of change. To our knowledge, this is the first study to evaluate these three OCT scanning areas for monitoring progression and these findings may have significant implications for the use of this instrument to longitudinally evaluate glaucomatous eyes and those suspected of having disease.
Stratus OCT RNFL parameters performed well in discriminating eyes that progressed by visual fields and/or optic disc stereophotographs from eyes that did not, with areas under the ROC curves above 0.80 for clinically relevant parameters. The mean rate of change for the RNFL parameter average thickness in progressing eyes was −0.72 μm/y, which corresponds to approximately 0.8% per year, compared to 0.14 μm/y for nonprogressing eyes. However, there was a wide variation in the rates of change among the eyes included in the study, as seen in Figure 1. Some of the eyes that were not detected as progressing by visual fields or optic disc photographs had significantly negative rates of change by Stratus OCT RNFL assessment. This could represent progressive glaucomatous damage that was not detected by conventional methods. In fact, there is some evidence that there can be observed changes in the RNFL before detectable damage to the optic nerve or visual fields.3 In a longitudinal study of 64 eyes of 37 patients using a prototype OCT, Wollstein et al.20 found that 22% of the eyes had significant change in OCT measurements without apparent deterioration of visual fields. Alternatively, the decline in Stratus OCT measurements over time in nonprogressing eyes could also represent age-related loss of RNFL thickness. Further follow-up of these subjects should clarify whether these cases represent age-related loss of nerve fibers, early detection of glaucoma progression, or simply instrument-related false-positive results.
The parameter inferior average had the best performance in discriminating progressors from nonprogressors in our study, with an ROC curve area of 0.84. For a specificity of 95%, the sensitivity of this parameter was 39%. At a lower specificity of 80%, the sensitivity increased to 81%. Changes in the inferior RNFL are in agreement with the expected pattern of damage in glaucomatous optic neuropathy and, in fact, in several previous cross-sectional studies, this parameter has been found to be the best one that discriminates glaucomatous from healthy eyes.10,12,29,35,36 It should be noted, however, that changes may occur on different sectors of the optic disc and RNFL as glaucoma progresses, which could explain why a single parameter may not be able to detect all progressing eyes. Also, longitudinal evaluation of the RNFL with Stratus OCT may be affected by variations in the position of the circle of measurements around the optic nerve. These variations have been shown to result in decreased reproducibility37,38 and attempts have been made to develop tracking systems that could improve image registration and RNFL measurement reproducibility.39,40 The use of SDOCTs is likely to overcome this limitation and result in improved reproducibility of RNFL measurements.21,41,42 However, the ability of these instruments to detect progressive glaucomatous damage has not yet been evaluated.
Previous reports have found Stratus OCT ONH parameters to be reproducible14,28 and to perform well in discriminating eyes with glaucomatous visual field loss from healthy eyes. However, in the present study, we found that these parameters had poor ability to differentiate progressing from nonprogressing eyes in a longitudinal setting. Although rates of change in the parameter cup area were significantly different between the two groups, the area under the ROC curve was only 0.66. Stratus OCT ONH parameters are obtained from only six radial scans centered on the optic disc. Therefore, interpolation is performed between the scans to obtain estimates of topographic parameters such as rim area and cup area. The large amount of interpolation may explain the poor sensitivity of this instrument in detecting small localized changes in glaucoma. Calculation of Stratus OCT ONH parameters also depend on the identification of the margins of the retinal pigment epithelium. Therefore, changes in this layer such as those occurring from progressive parapapillary atrophy in glaucoma may also affect the ability of these parameters to identify longitudinal change.
None of the macular thickness parameters was able to successfully discriminate progressors from nonprogressors in our study, with areas under the ROC curves ranging from 0.47 to 0.64. Despite initial reports in the literature showing thin macular measurements in some glaucomatous eyes,43–46 subsequent larger cross-sectional studies have demonstrated that these parameters actually perform poorly in differentiating glaucomatous from healthy eyes.29,47 Similar to ONH measurements, calculation of Stratus OCT macular thickness parameters requires a significant amount of interpolation, as the instrument obtains only six radial scans centered on the fovea. This limitation may contribute to the low sensitivity of these parameters for detection of existing and progressive damage in glaucoma. It should be noted, however, that we investigated only the current macular thickness parameters provided by the standard Stratus OCT printout, and it is possible that advances in the software designed to extract data from the macular area would improve detection of retinal ganglion cell loss in the posterior pole. Also, the new SDOCTs are able to acquire a much larger number of scans with higher resolution than TDOCTs, therefore reducing the need for interpolation and perhaps improving the ability of this technology to detect longitudinal change in macular thickness measurements in glaucoma.48
Our study has limitations. We used SAP GPA and expert assessment of optic disc stereophotographs as reference standards to determine progression in our study. Estimates of Stratus OCT accuracy as performed in our study depend on the accuracy of these reference methods. Although widely accepted in clinical practice, visual fields and stereophotographs are imperfect reference standards,49,50 and it is possible that some of the eyes had true progression detected only by the Stratus OCT. This problem would underestimate the specificity of OCT in our cohort of glaucomatous and suspected glaucomatous eyes. To try to overcome this limitation, some studies have evaluated the specificity of imaging instruments in groups of “pure” healthy eyes observed over time. However, calculations of specificity in completely healthy eyes for detection of glaucomatous progression are not without problems. In clinical practice, imaging instruments are applied to detect and monitor disease in diseased eyes or eyes suspected of having glaucoma. By definition, healthy eyes have different characteristics from the eyes observed in clinical practice and, therefore, estimates of specificity obtained from healthy eyes do not necessarily apply to the clinically relevant population. Although SAP and optic disc photographs may be imperfect reference standards, they have been widely used in clinical practice and validated by major clinical trials in glaucoma.2,51,52 Also, it is unlikely that the imperfections in the reference standards used in our study would have directly affected the comparison of different OCT scanning areas as performed in our study.
We used statistical models to evaluate whether Stratus OCT parameters were able to detect longitudinal change in eyes with progressive disease by conventional methods. The positive findings of our study should be seen as an initial step toward validation of this technology for monitoring glaucoma. However, future research should evaluate methods of detecting progressive damage that can be incorporated into clinical practice. These methods should be able to detect progression in individual patients taking into account the expected variability over time. Several of these methods have been proposed for other imaging technologies, and similar methods are likely to be implemented for OCT.
In conclusion, Stratus OCT RNFL parameters were able to discriminate eyes with progressing disease by visual fields or optic disc photographs from eyes that remained stable according to these methods, and performed significantly better than ONH and macular thickness parameters in detecting change over time. These findings suggest that RNFL assessment with this technology could be useful in detecting and monitoring the progression of disease in patients with an established diagnosis of glaucoma or suspected glaucoma.
Acknowledgments
Supported in part by the National Eye Institute Grants EY11008 (LMZ) and EY08208 (PAS); and participant retention incentive grants in the form of glaucoma medication at no cost from Alcon Laboratories Ltd, Allergan, Inc., Pfizer Inc., and Santen, Inc.
Footnotes
Disclosure: F.A. Medeiros, Carl Zeiss Meditec, Inc. (F, R), Heidelberg Engineering (R); L.M. Zangwill, Carl-Zeiss Meditec, Inc. (F), Heidelberg Engineering (F); L.M. Alencar, None; C. Bowd, None; P.A. Sample, Carl Zeiss Meditec, Inc. (F); R. Susanna, Jr, None; R.N. Weinreb, Carl-Zeiss Meditec, Inc. (F, R) and Heidelberg Engineering (F, R)
References
- 1.Kass MA, Heuer DK, Higginbotham EJ, et al. The Ocular Hypertension Treatment Study: a randomized trial determines that topical ocular hypotensive medication delays or prevents the onset of primary open-angle glaucoma. Arch Ophthalmol. 2002;120(6):701–713. doi: 10.1001/archopht.120.6.701. discussion 829-830. [DOI] [PubMed] [Google Scholar]
- 2.Miglior S, Zeyen T, Pfeiffer N, et al. Results of the European Glaucoma Prevention Study. Ophthalmology. 2005;112(3):366–375. doi: 10.1016/j.ophtha.2004.11.030. [DOI] [PubMed] [Google Scholar]
- 3.Quigley HA, Katz J, Derick RJ, et al. An evaluation of optic disc and nerve fiber layer examinations in monitoring progression of early glaucoma damage. Ophthalmology. 1992;99(1):19–28. doi: 10.1016/s0161-6420(92)32018-4. [DOI] [PubMed] [Google Scholar]
- 4.Sommer A, Katz J, Quigley HA, et al. Clinically detectable nerve fiber atrophy precedes the onset of glaucomatous field loss. Arch Ophthalmol. 1991;109(1):77–83. doi: 10.1001/archopht.1991.01080010079037. [DOI] [PubMed] [Google Scholar]
- 5.Medeiros FA, Zangwill LM, Bowd C, et al. Use of progressive glaucomatous optic disk change as the reference standard for evaluation of diagnostic tests in glaucoma. Am J Ophthalmol. 2005;139(6):1010–1018. doi: 10.1016/j.ajo.2005.01.003. [DOI] [PubMed] [Google Scholar]
- 6.Medeiros FA, Zangwill LM, Bowd C, et al. Influence of disease severity and optic disc size on the diagnostic performance of imaging instruments in glaucoma. Invest Ophthalmol Vis Sci. 2006;47(3):1008–1015. doi: 10.1167/iovs.05-1133. [DOI] [PubMed] [Google Scholar]
- 7.Schuman JS, Pedut-Kloizman T, Hertzmark E, et al. Reproducibility of nerve fiber layer thickness measurements using optical coherence tomography. Ophthalmology. 1996;103(11):1889–1898. doi: 10.1016/s0161-6420(96)30410-7. [DOI] [PMC free article] [PubMed] [Google Scholar]
- 8.Schuman JS, Hee MR, Puliafito CA, et al. Quantification of nerve fiber layer thickness in normal and glaucomatous eyes using optical coherence tomography. Arch Ophthalmol. 1995;113(5):586–596. doi: 10.1001/archopht.1995.01100050054031. [DOI] [PubMed] [Google Scholar]
- 9.Bowd C, Weinreb RN, Williams JM, Zangwill LM. The retinal nerve fiber layer thickness in ocular hypertensive, normal, and glaucomatous eyes with optical coherence tomography. Arch Ophthalmol. 2000;118(1):22–26. doi: 10.1001/archopht.118.1.22. [DOI] [PubMed] [Google Scholar]
- 10.Zangwill LM, Bowd C, Berry CC, et al. Discriminating between normal and glaucomatous eyes using the Heidelberg Retina Tomograph, GDx Nerve Fiber Analyzer, and Optical Coherence Tomograph. Arch Ophthalmol. 2001;119(7):985–993. doi: 10.1001/archopht.119.7.985. [DOI] [PubMed] [Google Scholar]
- 11.Williams ZY, Schuman JS, Gamell L, et al. Optical coherence tomography measurement of nerve fiber layer thickness and the likelihood of a visual field defect. Am J Ophthalmol. 2002;134(4):538–546. doi: 10.1016/s0002-9394(02)01683-5. [DOI] [PubMed] [Google Scholar]
- 12.Bowd C, Zangwill LM, Berry CC, et al. Detecting early glaucoma by assessment of retinal nerve fiber layer thickness and visual function. Invest Ophthalmol Vis Sci. 2001;42(9):1993–2003. [PubMed] [Google Scholar]
- 13.Budenz DL, Fredette MJ, Feuer WJ, Anderson DR. Reproducibility of peripapillary retinal nerve fiber thickness measurements with stratus OCT in glaucomatous eyes. Ophthalmology. 2008;115(4):661–666. e4. doi: 10.1016/j.ophtha.2007.05.035. [DOI] [PubMed] [Google Scholar]
- 14.Paunescu LA, Schuman JS, Price LL, et al. Reproducibility of nerve fiber thickness, macular thickness, and optic nerve head measurements using StratusOCT. Invest Ophthalmol Vis Sci. 2004;45(6):1716–1724. doi: 10.1167/iovs.03-0514. [DOI] [PMC free article] [PubMed] [Google Scholar]
- 15.Gurses-Ozden R, Teng C, Vessani R, et al. Macular and retinal nerve fiber layer thickness measurement reproducibility using optical coherence tomography (OCT-3) J Glaucoma. 2004;13(3):238–244. doi: 10.1097/00061198-200406000-00012. [DOI] [PubMed] [Google Scholar]
- 16.DeLeon Ortega JE, Sakata LM, Kakati B, et al. Effect of glaucomatous damage on repeatability of confocal scanning laser ophthalmoscope, scanning laser polarimetry, and optical coherence tomography. Invest Ophthalmol Vis Sci. 2007;48(3):1156–1163. doi: 10.1167/iovs.06-0921. [DOI] [PMC free article] [PubMed] [Google Scholar]
- 17.Blumenthal EZ, Williams JM, Weinreb RN, et al. Reproducibility of nerve fiber layer thickness measurements by use of optical coherence tomography. Ophthalmology. 2000;107(12):2278–2282. doi: 10.1016/s0161-6420(00)00341-9. [DOI] [PubMed] [Google Scholar]
- 18.Medeiros FA, Zangwill LM, Bowd C, Weinreb RN. Comparison of the GDx VCC scanning laser polarimeter, HRT II confocal scanning laser ophthalmoscope, and stratus OCT optical coherence tomograph for the detection of glaucoma. Arch Ophthalmol. 2004;122(6):827–837. doi: 10.1001/archopht.122.6.827. [DOI] [PubMed] [Google Scholar]
- 19.Lu AT, Wang M, Varma R, et al. Combining nerve fiber layer parameters to optimize glaucoma diagnosis with optical coherence tomography. Ophthalmology. 2008;115(8):1352–1357. e1–2. doi: 10.1016/j.ophtha.2008.01.011. [DOI] [PMC free article] [PubMed] [Google Scholar]
- 20.Wollstein G, Schuman JS, Price LL, et al. Optical coherence tomography longitudinal evaluation of retinal nerve fiber layer thickness in glaucoma. Arch Ophthalmol. 2005;123(4):464–470. doi: 10.1001/archopht.123.4.464. [DOI] [PMC free article] [PubMed] [Google Scholar]
- 21.Schuman JS. Spectral domain optical coherence tomography for glaucoma: an AOS thesis. Trans Am Ophthalmol Soc. 2008;106:426–458. [PMC free article] [PubMed] [Google Scholar]
- 22.Vizzeri G, Balasubramanian M, Bowd C, et al. Spectral domain-optical coherence tomography to detect localized retinal nerve fiber layer defects in glaucomatous eyes. Opt Express. 2009;17(5):4004–4018. doi: 10.1364/oe.17.004004. [DOI] [PMC free article] [PubMed] [Google Scholar]
- 23.Horn FK, Mardin CY, Laemmer R, et al. Correlation between Local glaucomatous visual field defects and loss of nerve fiber layer thickness measured with scanning laser polarimetry and spectral domain optical coherence tomography. Invest Ophthalmol Vis Sci. 2009;50(5):1971–1977. doi: 10.1167/iovs.08-2405. [DOI] [PubMed] [Google Scholar]
- 24.van Velthoven ME, Faber DJ, Verbraak FD, et al. Recent developments in optical coherence tomography for imaging the retina. Prog Retin Eye Res. 2007;26(1):57–77. doi: 10.1016/j.preteyeres.2006.10.002. [DOI] [PubMed] [Google Scholar]
- 25.Schuman JS, Wollstein G, Farra T, et al. Comparison of optic nerve head measurements obtained by optical coherence tomography and confocal scanning laser ophthalmoscopy. Am J Ophthalmol. 2003;135(4):504–512. doi: 10.1016/s0002-9394(02)02093-7. [DOI] [PubMed] [Google Scholar]
- 26.Hoffmann EM, Bowd C, Medeiros FA, et al. Agreement among 3 optical imaging methods for the assessment of optic disc topography. Ophthalmology. 2005;112(12):2149–2156. doi: 10.1016/j.ophtha.2005.07.003. [DOI] [PubMed] [Google Scholar]
- 27.Lin D, Leung CK, Weinreb RN, et al. Longitudinal evaluation of optic disc measurement variability with optical coherence tomography and confocal scanning laser ophthalmoscopy. J Glaucoma. 2009;18(2):101–106. doi: 10.1097/IJG.0b013e318179f879. [DOI] [PubMed] [Google Scholar]
- 28.Leung CK, Cheung CY, Lin D, et al. Longitudinal variability of optic disc and retinal nerve fiber layer measurements. Invest Ophthalmol Vis Sci. 2008;49(11):4886–4892. doi: 10.1167/iovs.07-1187. [DOI] [PubMed] [Google Scholar]
- 29.Medeiros FA, Zangwill LM, Bowd C, et al. Evaluation of retinal nerve fiber layer, optic nerve head, and macular thickness measurements for glaucoma detection using optical coherence tomography. Am J Ophthalmol. 2005;139(1):44–55. doi: 10.1016/j.ajo.2004.08.069. [DOI] [PubMed] [Google Scholar]
- 30.Leske MC, Heijl A, Hussein M, et al. Factors for glaucoma progression and the effect of treatment: the early manifest glaucoma trial. Arch Ophthalmol. 2003;121(1):48–56. doi: 10.1001/archopht.121.1.48. [DOI] [PubMed] [Google Scholar]
- 31.Medeiros FA, Alencar LM, Zangwill LM, et al. Detection of progressive retinal nerve fiber layer loss in glaucoma using scanning laser polarimetry with variable corneal compensation. Invest Ophthalmol Vis Sci. 2009;50(4):1675–1681. doi: 10.1167/iovs.08-2712. [DOI] [PMC free article] [PubMed] [Google Scholar]
- 32.Cnaan A, Laird NM, Slasor P. Using the general linear mixed model to analyse unbalanced repeated measures and longitudinal data. Stat Med. 1997;16(20):2349–2380. doi: 10.1002/(sici)1097-0258(19971030)16:20<2349::aid-sim667>3.0.co;2-e. [DOI] [PubMed] [Google Scholar]
- 33.Feldman HA. Families of lines: random effects in linear regression analysis. J Appl Physiol. 1988;64(4):1721–1732. doi: 10.1152/jappl.1988.64.4.1721. [DOI] [PubMed] [Google Scholar]
- 34.DeLong ER, DeLong DM, Clarke-Pearson DL. Comparing the areas under two or more correlated receiver operating characteristic curves: a nonparametric approach. Biometrics. 1988;44(3):837–845. [PubMed] [Google Scholar]
- 35.Kanamori A, Nakamura M, Escano MF, et al. Evaluation of the glaucomatous damage on retinal nerve fiber layer thickness measured by optical coherence tomography. Am J Ophthalmol. 2003;135(4):513–520. doi: 10.1016/s0002-9394(02)02003-2. [DOI] [PubMed] [Google Scholar]
- 36.Parikh RS, Parikh S, Sekhar GC, et al. Diagnostic capability of optical coherence tomography (Stratus OCT 3) in early glaucoma. Ophthalmology. 2007;114(12):2238–2243. doi: 10.1016/j.ophtha.2007.03.005. [DOI] [PubMed] [Google Scholar]
- 37.Gabriele ML, Ishikawa H, Wollstein G, et al. Optical coherence tomography scan circle location and mean retinal nerve fiber layer measurement variability. Invest Ophthalmol Vis Sci. 2008;49(6):2315–2321. doi: 10.1167/iovs.07-0873. [DOI] [PMC free article] [PubMed] [Google Scholar]
- 38.Vizzeri G, Bowd C, Medeiros FA, et al. Effect of improper scan alignment on retinal nerve fiber layer thickness measurements using Stratus optical coherence tomograph. J Glaucoma. 2008;17(5):341–349. doi: 10.1097/IJG.0b013e31815c3aeb. [DOI] [PMC free article] [PubMed] [Google Scholar]
- 39.Ishikawa H, Gabriele ML, Wollstein G, et al. Retinal nerve fiber layer assessment using optical coherence tomography with active optic nerve head tracking. Invest Ophthalmol Vis Sci. 2006;47(3):964–967. doi: 10.1167/iovs.05-0748. [DOI] [PMC free article] [PubMed] [Google Scholar]
- 40.Vizzeri G, Bowd C, Medeiros FA, et al. Scan tracking coordinates for improved centering of Stratus OCT scan pattern. J Glaucoma. 2009;18(1):81–87. doi: 10.1097/IJG.0b013e31816b3063. [DOI] [PMC free article] [PubMed] [Google Scholar]
- 41.Gonzalez-Garcia AO, Vizzeri G, Bowd C, et al. Reproducibility of RTVue retinal nerve fiber layer thickness and optic disc measurements and agreement with stratus optical coherence tomography measurements. Am J Ophthalmol. 2009;147(6):1067–1074. e1. doi: 10.1016/j.ajo.2008.12.032. [DOI] [PMC free article] [PubMed] [Google Scholar]
- 42.Menke MN, Knecht P, Sturm V, et al. Reproducibility of nerve fiber layer thickness measurements using 3D Fourier-domain OCT. Invest Ophthalmol Vis Sci. 2008;49(12):5386–5391. doi: 10.1167/iovs.07-1435. [DOI] [PubMed] [Google Scholar]
- 43.Giovannini A, Amato G, Mariotti C. The macular thickness and volume in glaucoma: an analysis in normal and glaucomatous eyes using OCT. Acta Ophthalmol Scand Suppl. 2002;236:34–36. doi: 10.1034/j.1600-0420.80.s236.44.x. [DOI] [PubMed] [Google Scholar]
- 44.Lederer DE, Schuman JS, Hertzmark E, et al. Analysis of macular volume in normal and glaucomatous eyes using optical coherence tomography. Am J Ophthalmol. 2003;135(6):838–843. doi: 10.1016/s0002-9394(02)02277-8. [DOI] [PubMed] [Google Scholar]
- 45.Greenfield DS, Bagga H, Knighton RW. Macular thickness changes in glaucomatous optic neuropathy detected using optical coherence tomography. Arch Ophthalmol. 2003;121(1):41–46. doi: 10.1001/archopht.121.1.41. [DOI] [PubMed] [Google Scholar]
- 46.Guedes V, Schuman JS, Hertzmark E, et al. Optical coherence tomography measurement of macular and nerve fiber layer thickness in normal and glaucomatous human eyes. Ophthalmology. 2003;110(1):177–189. doi: 10.1016/s0161-6420(02)01564-6. [DOI] [PMC free article] [PubMed] [Google Scholar]
- 47.Wollstein G, Ishikawa H, Wang J, et al. Comparison of three optical coherence tomography scanning areas for detection of glaucomatous damage. Am J Ophthalmol. 2005;139(1):39–43. doi: 10.1016/j.ajo.2004.08.036. [DOI] [PubMed] [Google Scholar]
- 48.Legarreta JE, Gregori G, Punjabi OS, et al. Macular thickness measurements in normal eyes using spectral domain optical coherence tomography. Ophthalmic Surg Lasers Imaging. 2008;39(suppl 4):S43–S49. doi: 10.3928/15428877-20080715-02. [DOI] [PubMed] [Google Scholar]
- 49.Parrish RK, 2nd, Schiffman JC, Feuer WJ, et al. Test-retest reproducibility of optic disk deterioration detected from stereophotographs by masked graders. Am J Ophthalmol. 2005;140(4):762–764. doi: 10.1016/j.ajo.2005.04.044. [DOI] [PubMed] [Google Scholar]
- 50.Jampel HD, Friedman D, Quigley H, et al. Agreement among glaucoma specialists in assessing progressive disc changes from photographs in open-angle glaucoma patients. Am J Ophthalmol. 2009;147(1):39–44. e1. doi: 10.1016/j.ajo.2008.07.023. [DOI] [PMC free article] [PubMed] [Google Scholar]
- 51.Heijl A, Bengtsson B, Chauhan BC, et al. A comparison of visual field progression criteria of 3 major glaucoma trials in early manifest glaucoma trial patients. Ophthalmology. 2008;115(9):1557–1565. doi: 10.1016/j.ophtha.2008.02.005. [DOI] [PubMed] [Google Scholar]
- 52.Gordon MO, Beiser JA, Brandt JD, et al. The Ocular Hypertension Treatment Study: baseline factors that predict the onset of primary open-angle glaucoma. Arch Ophthalmol. 2002;120(6):714–720. doi: 10.1001/archopht.120.6.714. discussion 829-830. [DOI] [PubMed] [Google Scholar]