

Abstract
Metabolically healthy individuals effectively adapt to changes in nutritional state. Here, we focus on the effects of the adipocyte-derived secretory molecule adiponectin on adipose tissue in mouse models with genetically altered adiponectin levels. We found that higher adiponectin levels increased sensitivity to the lipolytic effects of adrenergic receptor agonists. In parallel, adiponectin-overexpressing mice also display enhanced clearance of circulating fatty acids and increased expansion of subcutaneous adipose tissue with chronic high fat diet (HFD) feeding. These adaptive changes to the HFD were associated with increased mitochondrial density in adipocytes, smaller adipocyte size, and a general transcriptional up-regulation of factors involved in lipid storage through efficient esterification of free fatty acids. The physiological response to adiponectin overexpression resembles in many ways the effects of chronic exposure to β3-adrenergic agonist treatment, which also results in improvements in insulin sensitivity. In addition, using a novel computed tomography-based method for measurements of hepatic lipids, we resolved the temporal events taking place in the liver in response to acute HFD exposure in both wild-type and adiponectin-overexpressing mice. Increased levels of adiponectin potently protect against HFD-induced hepatic lipid accumulation and preserve insulin sensitivity. Given these profound effects of adiponectin, we propose that adiponectin is a factor that increases the metabolic flexibility of adipose tissue, enhancing its ability to maintain proper function under metabolically challenging conditions.
Ectopic storage of lipids in nonadipose tissue is widely accepted as a cause of metabolic dysregulation and occurs at variable degrees in obese or lipodystrophic individuals.1 This phenomenon is commonly referred to as lipotoxicity, and a large body of literature has revealed a variety of mechanisms underlying fatty acid-induced metabolic dysregulation.2,3 Furthermore, reduction of ectopic lipid storage has been proven successful in the prevention or reversal of metabolic disease.4,5 For instance, treatment with peroxisome proliferator-activated receptor (PPAR)-γ agonists (eg, thiazolidinediones) has been shown to decrease lipotoxicity through facilitating deposition of fatty acids in the adipose tissue and thereby sequestering the fatty acids away from nonadipose tissues.6,7
Improved insulin sensitivity in rodents can also be achieved through chronic treatment with β3-adrenergic receptor (AR) agonists.8 The underlying mechanism behind the beneficial effects of β3-AR agonists probably involves reduction of circulating free fatty acids (FFAs) through increased capacity for fatty acid catabolism within the adipose tissue.9–12 Although human adipocytes have a negligible β3-adrenergic response,13 intact adrenergic signaling in adipose tissue may still be important for the maintenance of metabolic health. On the one hand, insulin resistance increases lipolysis, but on the other hand, it has also been reported that adipocytes from insulin-resistant subjects are less sensitive to catecholamine-induced lipolysis.14,15 Adrenergic signaling may also regulate adipose tissue biology through generation of cAMP, which is crucial for adipocyte differentiation.16 Thus, reduced sensitivity to both insulin and adrenergic stimuli may contribute significantly to the pathogenesis of the metabolic syndrome.
Adiponectin is a hormone that is secreted almost exclusively by adipose tissue.17 The circulating levels of adiponectin are suppressed in insulin-resistant states, whereas administration of insulin-sensitizing thiazolidinediones increases circulating adiponectin levels. Adiponectin is not only a marker for insulin sensitivity, but plays an active role in enhancing insulin sensitivity. Numerous studies suggest that adiponectin acts on the liver and suppresses glucose output.18,19 Moreover, adiponectin knockout (adipo−/−) mice have decreased hepatic insulin sensitivity and an impaired response to thiazolidinediones.20 In contrast, a mouse model with two- to threefold elevated adiponectin levels (adiponectin transgenic [adipo tg] mice) is protected against HFD-induced insulin resistance.21
Most studies on the effects of adiponectin have mainly explored the endocrine properties of adiponectin, ie, how circulating adiponectin improves insulin signaling in target tissues such as the liver and muscle. Little effort has been directed to the possibility that adiponectin is of importance for adipose tissue physiology directly. However, we have recently shown that overexpression of adiponectin enhances adiposity and protects against lipotoxicity in the metabolically compromised ob/ob mouse model.22 Given that complete leptin deficiency represents an extreme case, which may be less relevant for most cases of human obesity, we wanted to extend our studies of adiponectin in this regard.
We first established an experimental setting in which vulnerability to lipotoxicity can easily be assessed in vivo. In a second step, taking advantage of transgenic and knockout mice with altered adiponectin levels, we demonstrate that adiponectin protects against lipid deposition in the liver. Finally, we show that the underlying mechanism is likely to involve enhanced adrenergic sensitivity in the adipose tissue, resembling the effects of chronic β3-AR agonist treatment. Therefore, we suggest that the actions of adiponectin on metabolism are well beyond the previously demonstrated endocrine effects and involve remodeling of the adipose tissue into a more efficient “metabolic sink.” Given the profound effects on both FFA re-esterification as well as lipolysis, we propose that adiponectin confers metabolic flexibility to the system by balancing the ability to enhance expansion of adipose tissue while also enhancing the ability to respond to lipolytic stimuli.
Materials and Methods
Animals
Wild-type FVB and C57B6 mice were used to establish a computed tomography (CT)-based method for assessing liver lipids as well as for characterizing the acute metabolic effects of a HFD. Adiponectin-deficient mice (adipo−/−) on the FVB background and adipo tg on both FVB and C57B6 backgrounds were used to explore the actions of adiponectin.21 All mice were backcrossed more than 10 times to their respective background. Mice were maintained on a 12-hour dark/light cycle and housed in groups of two to four with unlimited access to water, chow (no. 5058, LabDiet, St. Louis, MO), or the HFD (D12492, Research Diets Inc., New Brunswick, NJ) as indicated for the individual experiments. The Institutional Animal Care and Use Committee of the University of Texas Southwestern Medical Center, Dallas approved all animal experiments.
Computed Tomography
Mice were anesthetized with isoflurane and a CT scan was performed at a resolution of 93 μm using the short scan mode (180°) on a eXplore Locus in vivo MicroCT scanner from GE Healthcare (Little Chalfont, Buckinghamshire, UK). The CT scanner was calibrated according to protocols provided by the manufacturer. Each scan took about 6 minutes, and the mice showed no sign of discomfort during the procedure. The images obtained were analyzed using Microview software (GE Healthcare). Adipose tissue distribution was assessed from the base of the lungs to the distal side of the hip joint. Histogram analysis of CT images obtained showed that voxels with CT values between −300 and −100 Hounsfield units (H.U.) may be defined as fat tissue. Visceral adipose tissue was analyzed by assessing the fat content within the peritoneal cavity using the clearly visible peritoneum as guidance. Liver lipid content was analyzed by obtaining the average CT value in multiple regions well within the liver. The average variability between analyses of the same liver was no higher than 1%. Because increased lipid content reduces the density, we assumed that an increased lipid content would result in a decreased average liver CT value. This assumption was tested and proven to be valid because a clearly significant correlation between average liver CT values and extracted liver triglycerides was obtained (Figure 1A). Thus, our CT-based method for estimation of hepatic lipid content is reproducible and accurate and greatly facilitates longitudinal measurements in response to metabolic challenges.
Figure 1.
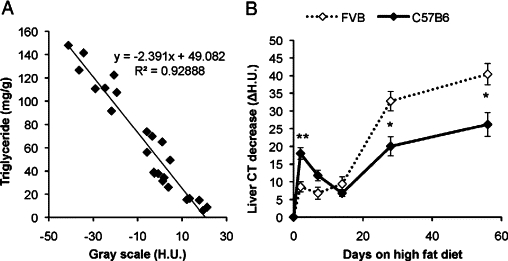
A: Liver lipid content was measured with CT analysis and with conventional biochemical extraction and analysis of triglycerides. There was a significant negative correlation between H.U. and extracted triglycerides (n = 24). B: Using our CT-based method, liver lipid content was followed in HFD-fed female FVB and C57B6 mice. Liver lipids are expressed as H.U. (baseline) − H.U. (HFD); thus, an increase in lipid content will result in a positive ΔH.U. value. n = 5 + 5. *P < 0.05; **P < 0.01 for C57B6 versus FVB mice.
Triglyceride Extraction
Mice were anesthetized with ketamine (100 mg/kg)/xylazine (10 mg/kg). Livers were harvested, and 100- to 200-mg pieces were snap-frozen in liquid nitrogen until analysis. Lipids were extracted according to the method of Folch et al.23 The chloroform phase was brought up to 5 ml, and triplicates of 50 ml together with standards were dried down by the addition of 10 ml of 2:1 chloroform-Triton X-100 mix. Triglyceride levels were measured with Infinity reagent (Thermo Fisher Scientific, Waltham, MA).
FFA Clearance
Tail vein serum samples were obtained before and 2 hours after an oral administration of olive oil (10 μl/g).
β3AR-Agonist Sensitivity Test
Tail vein serum samples were obtained before and 5, 15, and 60 minutes after an intraperitoneal injection of 1 mg/kg CL 316,243 (Sigma-Aldrich, St. Louis, MO).
Blood Chemistry
Insulin, leptin, and adiponectin levels were measured by commercial enzyme-linked immunosorbent assay kits (Linco Research, St. Charles, MO). Glucose and glycerol levels were determined by, respectively, Sigma Diagnostics glucose reagents and free glycerol reagent (Sigma-Aldrich). Triglycerides and cholesterol levels were measured with Infinity reagents (Thermo Fisher Scientific). Free fatty acid levels were measured with NEFA-HR(2) (Wako Pure Chemical Industries, Tokyo, Japan).
DNA Array Analysis and Quantitative Real-Time RT-PCR
Tissues were collected in RNAlater (Ambion, Austin, TX) and stored at −80°C until TRIzol reagent (Invitrogen, Carlsbad, CA) extraction followed by RNA purification using an RNeasy Mini Kit and RNase-Free DNase (Qiagen, Valencia, CA). The integrity of the RNA was estimated with an Agilent 2100 bioanalyzer instrument. All samples had an RNA integrity number score >8. The Mouse WG-6 v2.0 Illumina bead chip platform (Illumina, Inc., San Diego, CA) was used for DNA array analysis. RNA was reverse-transcribed to cDNA by an iScript cDNA synthesis kit (Bio-Rad Laboratories, Hercules, CA). Gene expression was subsequently measured for individual genes (β-ARs, ATP6, mDIC, GPD2, PPARα, and PPARγ) to confirm results obtained by DNA array. iQ SYBR Green Supermix (Bio-Rad) was used for the quantitative PCR reactions and HPRT was used as an endogenous control. The relative expression level was calculated by the comparative Ct method. Primer sequences are indicated in Table 1.
Table 1.
Primer Sequences for Quantitative Real-Time RT-PCR
| Forward primer | Reverse primer | |
|---|---|---|
| HPRT | 5’-AGCAGTACAGCCCCAAAA-3′ | 5′-TTTGGCTTTTCCAGTTTCA-3′ |
| PPARγ1 | 5′-GCGGCTGAGAAATCACGTTC-3′ | 5′-GAATATCAGTGGTTCACCGCTTC-3′ |
| PPARγ2 | 5′-AACTCTGGGAGATTCTCCTGTTGA-3′ | 5′-GAAGTGCTCATAGGCAGTGCAT-3′ |
| mDIC | 5′-ATGACTGGATTGGCACTG-3′ | 5′-TTGTAGAAGGGGAGAGGC-3′ |
| β1-AR | 5′-GCTGCAGACGCTCACCA-3′ | 5′-GCGAGGTAGCGGTCCAG-3′ |
| β2-AR | 5′-CACAGCCATTGCCAAGTTCG-3′ | 5′-CGGGCCTTATTCTTGGTCAGC-3′ |
| β3-AR | 5′-CCACTCCGGGAACACCG-3′ | 5′-GGCAGTAGATGACCGGGTTG-3′ |
| PPARα | 5′-ACGATGCTGTCCTCCTTGATG-3′ | 5′-GTGTGATAAAGCCATTGCCGT-3′ |
| GPD2 | 5′-GCAGCTGATGAGCGCAGTT-3′ | 5′-TCCAAGTTCTCCTCGGCAGTT-3′ |
| ATP6 | 5′-ACTTGCCCACTTCCTTCCACAA-3′ | 5′-TAAGCCGGACTGCTAATGCCA-3′ |
Histology and Electron Transport Activity
Adipose tissue was collected in Histochoice and embedded in paraffin, and sections were stained with H&E. Fresh adipose tissue minces was incubated in Dulbecco's modified Eagle's medium containing 100 nmol/L MitoTracker Orange CMXRos (Invitrogen, Carlsbad, CA) for 30 minutes at 37°C. The tissue was then washed in Dulbecco's modified Eagle's medium before fixation with 4% paraformaldehyde and confocal fluorescence microscopy (TCS SP5, Leica, Wetzlar, Germany).
Electron transport chain activity was assessed by incubating whole fat pads in 1% 2,3,5-triphenyltetrazoliumchloride (Sigma-Aldrich) in PBS at 37°C for 15 minutes. The tissues were then fixed in 4% paraformaldehyde.9
Western Blot Analysis
Adipose tissue samples were homogenized on ice in detergent-free lysis buffer containing 20 mmol/L Tris, pH 7.4, 150 mmol/L NaCl, 10% glycerol, 1 mmol/L EDTA, pH 8, 20 mmol/L NaF, and 30 mmol/L sodium pyrophosphate, supplemented with complete protease inhibitor cocktail (Calbiochem, San Diego, CA), 1 mmol/L phenylmethylsulfonyl fluoride, 1 mmol/L dithiothreitol, and 1 mmol/L sodium vanadate. This was followed by low-speed centrifugation (3000 × g at 4°C) to remove the fat cake from the top of the tube. Thereafter, the lysates were adjusted to Nonidet P-40 (2%), SDS (0.2%), and sodium deoxycholate (0.5%). The same lysis buffer including detergents was used for homogenization of liver samples. The tissue homogenates were agitated for 1 to 2 hours at 4°C, extracts were cleared at 20,000 × g for 20 minutes at 4°C, and total protein concentration were measured with a BCA Protein Assay Kit (Pierce Protein Research Products, Thermo Fisher Scientific, Waltham, MA). Equal amounts of protein from liver and adipose tissue were mixed with 5× Laemmli sample buffer and resolved on 4 to 12% NuPage Bis-Tris gels (Invitrogen), followed by transfer to a polyvinylidene difluoride membrane (Millipore Corporation, Billerica, MA). Blots were probed with HSP60 (Assay Designs Inc., Ann Arbor, MI), cAMP response element-binding protein (CREB), and phosphorylated (phospho)-CREB antibodies (Cell Signaling Technology Inc., Danvers, MA). Bound antibodies were detected with IRDye800-conjugated anti-rabbit secondary antibodies (Rockland Immunochemicals, Inc., Gilbertsville, PA). Membranes were scanned with an Odyssey infrared imaging system (LI-COR Biosciences, Lincoln, NE).
Metabolic Cage Studies
Body composition was assessed by nuclear magnetic resonance (Minispec mq10, Bruker, Newark, DE). Indirect calorimetry, food intake, and activity measurements were performed using the CLAMS system (Columbus Instruments, Columbus, OH). The mice were allowed to acclimatize to the metabolic cages for 2 days. Variability of the respiratory exchange ratio (RER) for each condition was estimated by calculating the difference between the average of the six highest values and the average of the six lowest values.
Statistical Methods
Data are generally expressed as means ± SEM. The nonparametric Wilcoxon test was used for comparisons between groups. P < 0.05 was considered as significant.
Results
HFD-Induced Hepatic Steatosis in C57B6 and FVB Mice
Hepatic steatosis is a key event in the pathogenesis of the metabolic syndrome and can exert lipotoxic effects under some conditions. We therefore explored the detailed time course of HFD-induced hepatic steatosis in C57B6 and FVB mice as these strains are commonly used in metabolic studies. Although rodents are widely used clinically, there is no established protocol available for longitudinal measurements of hepatic lipids in them using micro-CT scanners. We therefore established this methodology as described in Materials and Methods and validated all measurements on a CT scanner with conventional biochemical measurements of triglycerides. The CT measurements were in excellent agreement with the biochemical assessment (Figure 1A), providing strong support that this methodology is suitable for longitudinal measurements in vivo.
We found that within as short a time frame as 48 hours, hepatic lipid content was dramatically increased, especially in the C57B6 strain. This finding was confirmed by conventional measurements of liver triglycerides in another set of mice (12 ± 20.0 versus 36 ± 9.5 mg/g in, respectively, normal chow-fed versus 48 hours HFD-fed mice; P < 0.05). The FVB mice were less sensitive to this acute effect of a HFD but developed more severe hepatic steatosis over the long-term exposure as the high fat diet regimen was continued for several weeks and followed with repeated CT measurements (Figure 1B). After the acute phase of the HFD, an “adaptation phase” followed during which the hepatic steatosis improved in the C57B6 mice and remained unchanged in the FVB mice until approximately 2 weeks (Figure 1B). Thereafter, the gain in hepatic lipids was highly correlated with the body weight gain (data not shown).
Because the 48-hour HFD regimen caused a robust effect on hepatic steatosis and may serve as an excellent model system for a lipotoxic environment in the liver, we studied the mice under these conditions more extensively. Blood chemistry analysis showed that C57B6 and FVB mice responded slightly differently to this acute metabolic challenge, although both strains showed signs of compromised insulin sensitivity (Table 2). Hyperinsulinemia was very pronounced in the C57B6 mice, whereas FVB mice displayed a more variable response. Nevertheless, both strains and genders developed either hyperglycemia or hyperinsulinemia. Total cholesterol levels did not change in the C57B6 mice, whereas female but not male FVB mice exhibited increased cholesterol levels. Surprisingly, total triglyceride levels decreased in both FVB and C57B6 mice in both genders (Table 2 and female data not shown). These may reflect either decreased VLDL secretion and/or increased triglyceride clearance because of the hyperinsulinemic conditions established under these circumstances.
Table 2.
Body Weight and Blood Chemistry of Male FVB and C57B6 Mice Fed Normal Chow and after 48 Hours of the HFD
| FVB |
C57B6 |
|||
|---|---|---|---|---|
| NC | HFD 48 hours | NC | HFD 48 hours | |
| Body weight (g) | 29.6 ± 0.5 | 28.9 ± 0.6 | 25.8 ± 0.5* | 27.1 ± 0.3†‡ |
| Glucose (mg/dl) | 262 ± 28 | 382 ± 31‡ | 260 ± 20 | 269 ± 21† |
| Insulin (ng/ml) | 0.48 ± 0.04 | 0.52 ± 0.1 | 0.34 ± 0.04 | 0.87 ± 0.23†‡ |
| Triglycerides (mg/dl) | 143 ± 10 | 77 ± 9§ | 85 ± 9¶ | 54 ± 2†‡ |
| Cholesterol (mg/dl) | 196 ± 11 | 217 ± 15 | 98 ± 12* | 112 ± 9* |
n = 5 to 7/group. NC, normal chow.
P < 0.001 for C57B6 vs. FVB mice.
P < 0.05 for C57B6 vs. FVB mice.
P < 0.05 for NC versus 48 hours of a HFD.
P < 0.001 for NC versus 48 hours of a HFD.
P < 0.01 for C57B6 versus FVB mice.
Adipo tg Mice Are Protected Against the Deleterious Effects of a HFD
As demonstrated above, acute exposure to the HFD caused a major metabolic challenge in the mice. In particular, C57B6 mice exhibited dramatic increases in liver lipids as well as hyperinsulinemia. Adiponectin has previously been associated in clinical studies with decreased levels of hepatic lipids. Therefore, we wanted to investigate whether mice overexpressing higher levels of adiponectin (adipo tg) mice on the C57B6 background would be protected against the deleterious effects of acute exposure to a HFD. Indeed, increases in hepatic lipids after 48 hours of the HFD were significantly reduced in adipo tg mice despite similar overall weight gain (2.1 ± 0.2 versus 2.2 ± 0.3 in, respectively, wild-type [WT] and adipo tg mice) (Figure 2A). The adipo tg mice were also able to maintain their baseline insulin levels, whereas the levels were approximately twofold increased in both female and male wild-type mice (1.8- and 2.3-fold in wild-type males and females, respectively; P < 0.05). Cholesterol levels were reduced both at baseline and after 48 hours of the HFD in the adipo tg mice (data not shown). These observations strongly suggest that adiponectin reduces the lipotoxic effects of a HFD. This reduction was further supported by the lower levels of circulating FFAs in the adipo tg mice relative to controls when challenged with an oral load of olive oil (Figure 2B).
Figure 2.
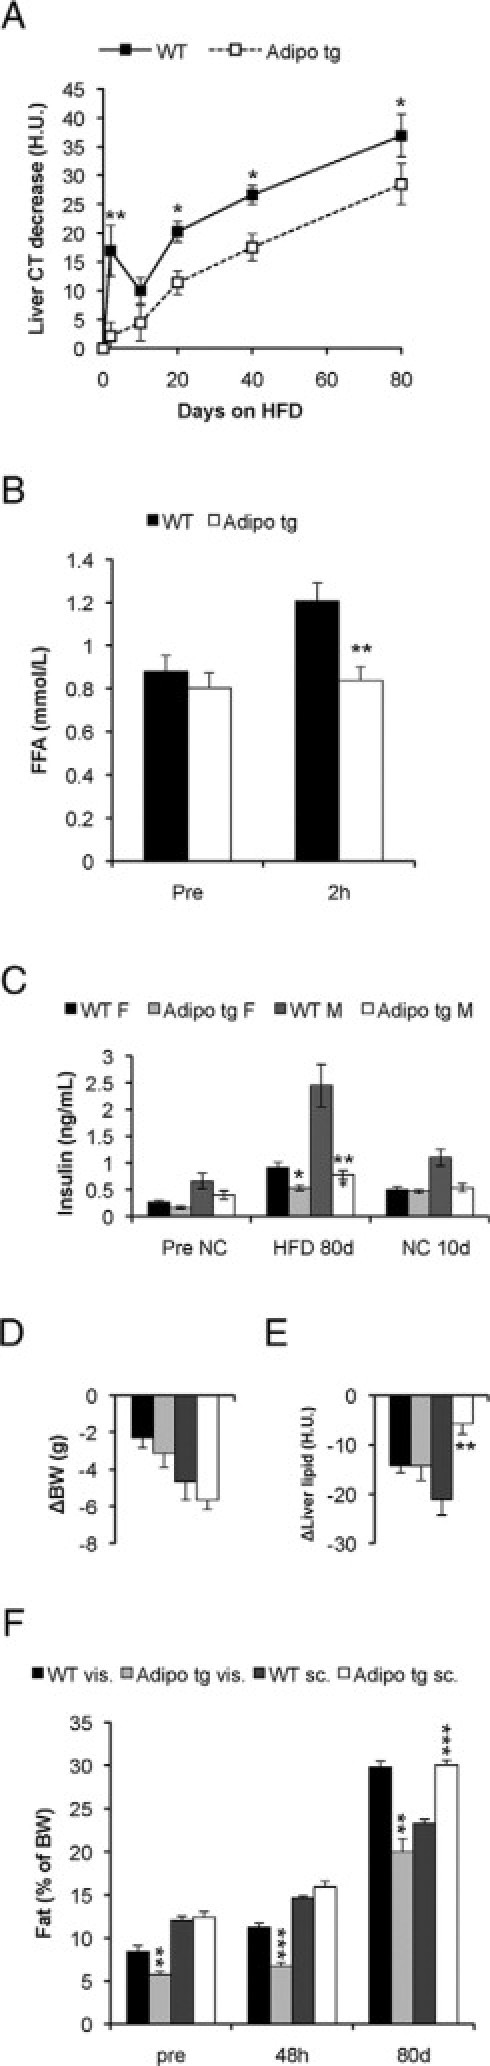
Liver lipid content (A) and fat distribution (F) was estimated with CT analysis in HFD-fed adipo tg and littermate control male C57B6 mice (WT). The measurements were performed at 9 AM to 12 PM with the mice having free access to food. After 80 days consuming the HFD these mice were again fed normal chow (NC). vis., visceral adipose tissue; sc, subcutaneous adipose tissue. C: Serum insulin levels were analyzed in samples drawn before the HFD, after 80 days of consuming the HFD and 10 days after the reintroduction of normal chow. F, female; M, male. Weight (BW) (D) and liver lipid change (E) after the reintroduction of normal chow are shown. Another set of male C57B6 mice was given olive oil orally (10 μl/g mouse) to assess triglyceride clearance. Serum free fatty acids were analyzed before and after 2 hours after the lipid load (B). n = 4 to 6/group. *P < 0.05; **P < 0.01 for adipo tg versus WT mice.
With chronic HFD feeding, the adipo tg mice are partially protected against hepatic steatosis and have consistently lower insulin levels (Figure 2C). Neither body weight nor leptin levels were significantly different between genotypes, whereas adiponectin levels were two to threefold higher in the adipo tg mice (data not shown). Body weight gain and liver lipid gain are positively correlated after 10, 20, and 40 days, but no longer after 80 days with HFD in wild-type mice (Figure 3, A–D). In adipo tg mice, this correlation is significant first after 40 days with the HFD, but the slope is not as steep as in the wild-type mice. Thus, the adipo tg mice have to gain more weight to develop the same degree of HFD-induced hepatic steatosis. After 80 days of the HFD, these mice were again fed normal chow. Already within the 10 subsequent days, the normal chow feeding dramatically improved hyperinsulinemia and hepatic steatosis, but weight loss was achieved at a slower pace (Figure 2, C–E). This result indicates that HFD-induced lipotoxicity may depend both on obesity and on a constant supply of exogenous lipids.
Figure 3.
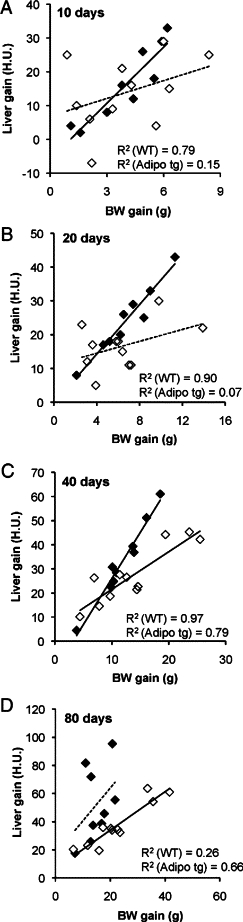
Body weight (BW) gain is plotted against liver lipid gain after 10 (A), 20 (B), 40 (C), and 80 (D) days on HFD using both male and female C57B6 adipo tg (white squares) and littermate control mice (black squares). – – –, nonsignificant trend; ——, significant correlation.
Fat distribution, CT analysis, and dissection of individual fat pads demonstrates that the adipo tg mice have significantly less visceral fat than wild-type littermate controls (Figure 2F, Table 3). The subcutaneous fat mass was increased in adipo tg males after 80 days of an HFD, and a similar tendency was also seen in adipo tg females (Figure 2F and data not shown). Moreover, liver size was significantly decreased in the adipo tg mice (Table 3). Thus, the adipo tg mice are less prone to visceral obesity and effectively expand the subcutaneous fat mass, which is likely to be the underlying reason for the potent protective effects against metabolic dysfunction.
Table 3.
Body, Gonadal Adipose Tissue, Inguinal Adipose Tissue, and Liver Weights
| Females |
Males |
|||
|---|---|---|---|---|
| Weight | WT | Adipo tg | WT | Adipo tg |
| Body (g) | 21.5 ± 0.5 | 21.4 ± 0.3 | 26.7 ± 0.8 | 25.8 ± 0.7 |
| Liver (mg/g) | 46.8 ± 1.1 | 43.3 ± 0.8* | 50.5 ± 0.8 | 44.5 ± 1.1† |
| GWAT (mg/g) | 9.02 ± 0.8 | 3.79 ± 0.3† | 16.1 ± 1.9 | 7.2 ± 0.7‡ |
| IWAT (mg/g) | 9.98 ± 0.6 | 11.5 ± 2.0 | 7.5 ± 0.8 | 10.3 ± 0.7* |
n = 5 to 7/group. GWAT, gonadal white adipose tissue; IWAT, inguinal white adipose tissue.
P < 0.05 for wild-type versus adipo tg mice.
P < 0.001 for wild-type versus adipo tg mice.
P < 0.01 for wild-type versus adipo tg mice.
Adiponectin Increases Adrenergic Sensitivity and Causes Remodeling of Adipose Tissue
In light of these findings, we wanted to further investigate the baseline phenotype of the adipo tg mice on the C57B6 background in the hope of identifying the underlying mechanism by which adiponectin exerts these potent protective effects against lipotoxicity. Analysis of tail vein serum samples obtained during the light phase showed that the glycerol levels are increased in the transgenic mice, whereas FFA levels were comparable in the adipo tg and wild-type littermates. Surprisingly, this difference in glycerol levels was no longer apparent in additional samples obtained under the same conditions (but without the added stress of re-cutting the tail) (Supplemental Figure S1, see http://ajp.amjpathol.org). When sampling was performed under anesthetized conditions, we saw no inducible lipolysis as expected in both genotypes. Instead, anesthetized female adipo tg mice displayed decreased FFA levels relative to wild-type mice (Figure 4, A and B). These data strongly suggest that the increased glycerol levels in the adipo tg mice are induced by an enhanced lipolytic response to handling stress. Consistent with our previous reports,22 the adipo tg mice rapidly became hypoglycemic on fasting and had reduced insulin levels (Figure 5, A and B).
Figure 4.
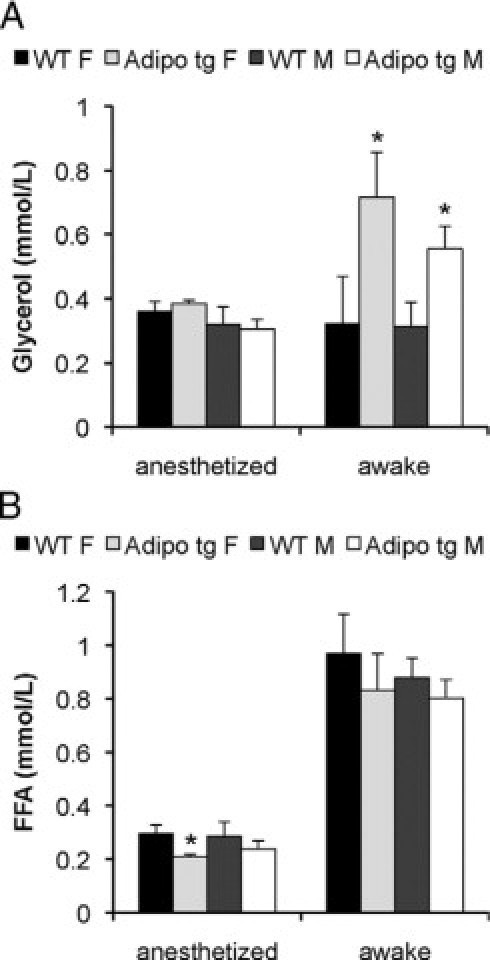
Serum glycerol (A) and free fatty acid (B) levels were measured in awake and chloral hydrate-anesthetized male (M) and female (F) C57B6 adipo tg and littermate control mice. n = 5 to 7/group. *P < 0.05.
Figure 5.
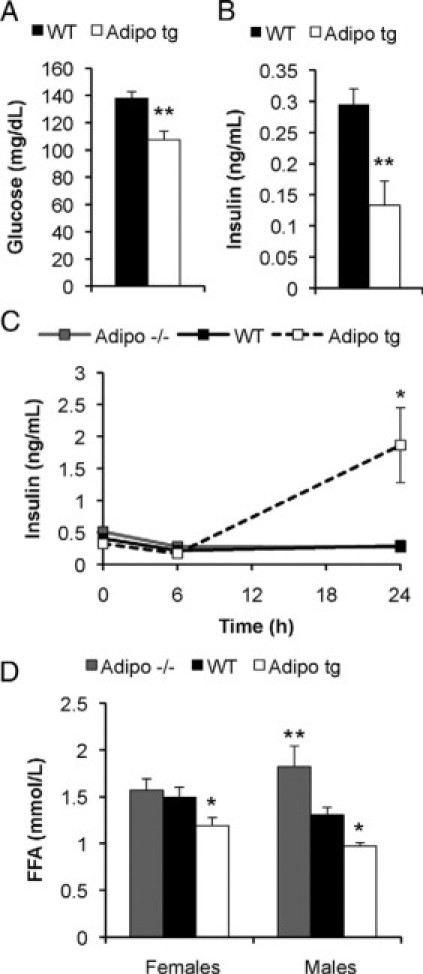
Serum glucose (A) and insulin levels (B) in male C57B6 adipo tg and littermate control mice after a 5-hour fast. n = 5 + 5. *P < 0.05 for WT versus adipo tg. Serum insulin levels (C) in female FVB adipo tg, adipo−/−, and control mice after a 0-, 6-, and 24-hour fast and serum free fatty acid levels (D) in awake FVB adipo tg, adipo−/−, and control mice. n = 4 to 6/group. *P < 0.05; **P < 0.01 for WT versus adipo tg; in C, *P < 0.05 for WT versus adipo−/− mice; in D, **P < 0.05 for 24-hour fasted versus fed adipo tg mice.
Glycerol levels, obtained in tail vein samples from FVB mice during the light phase, were in general higher than those in the C57B6 mice (data not shown) but were comparable between wild-type and adipo tg mice. FVB adipo tg mice had significantly decreased levels of FFAs relative to those of littermate controls. Consistent with that finding, an opposite phenotype was seen in male FVB adipo−/− mice. These mice displayed similar glycerol but increased FFA levels compared with those of wild-type controls (Figure 5D). These data are consistent with a model in which adiponectin promotes dose-dependent efficient fatty acid re-esterification and/or fatty acid oxidation in light of the fact that the FFA/glycerol ratio was lower in adipo tg and higher in adipo−/− compared with wild-type mice.
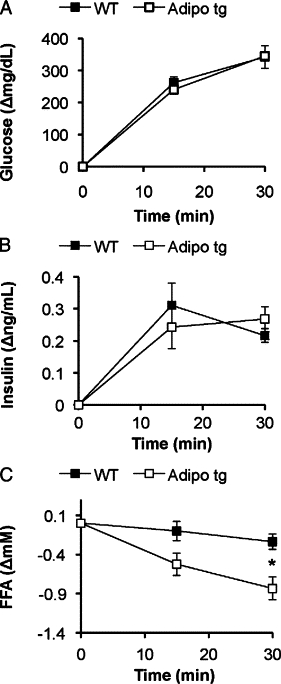
Adipo tg and littermate controls on the FVB background had similar glucose and insulin levels during the light phase as well as after a 6-hours fast (Figure 5C). Therefore, we challenged them further with a more extended fast to investigate whether adipo tg on the FVB background eventually also become hypoglycemic. To our big surprise, fasting for 24 hours caused an increase in insulin levels in the adipo tg mice in both genders and strains (FVB females in Figure 5C shown as a representative example). This effect is reminiscent of the effects that can be induced pharmacologically by β3-AR agonists.24,25 Therefore, we were prompted to test whether adipo tg mice have an increased sensitivity to CL 316,243, a highly specific β3-AR agonist. Indeed, the adipo tg mice were very sensitive to CL 316,243 as judged by the increased glycerol and insulin levels relative to those of controls (Figure 6, A–E). In fact, the adipo tg mice on the FVB background had to be given glucose to survive the severe hypoglycemia that they developed. In contrast, the adipo−/− mice were, as expected, less sensitive than wild-type controls (Figure 6C), consistent with an adiponectin dose-dependent effect on this process.
Figure 6.
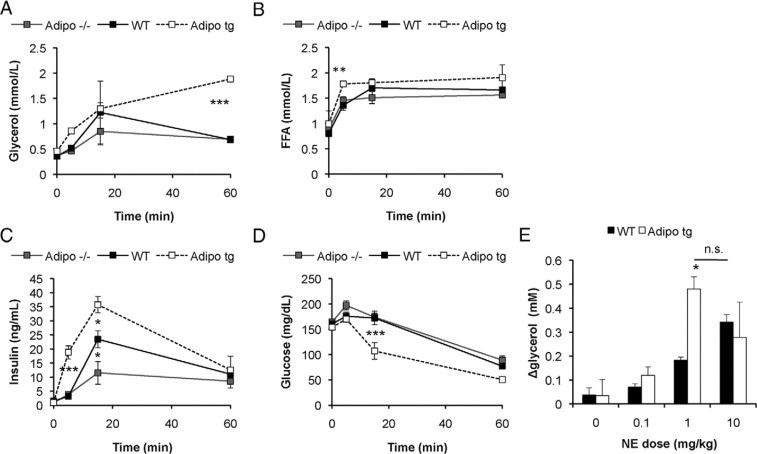
Female FVB adipo tg, adipo−/−, and control (WT) mice were injected with β3AR-agonist (1 mg/kg CL 316,243 i.p.), and serum levels of glycerol (A), FFA (B), insulin (C), and glucose (D) were measured in tail vein samples after 0, 5, 16, and 60 minutes. n = 4 to 6/group. *P < 0.05; **P < 0.01; ***P < 0.001 for WT versus adipo tg mice; $P < 0.05 for WT versus adipo−/− mice. E: Increase in serum glycerol levels 15 minutes after norepinephrine (NE) i.p. injection at the indicated dose. n = 2 to 5/dose and group. *P < 0.05 for WT versus adipo tg.
The increased sensitivity to adrenergic agonist-induced lipolysis in adipo tg mice may not be selective to just β3-AR agonist, because the adipo tg mice were also more sensitive to isoproterenol (data not shown)- and norepinephrine-induced lipolysis. The maximum increase in glycerol levels 15 minutes after injection was seen at a dose of 1 mg/kg norepinephrine for the adipo tg mice, whereas 10 mg/kg was required for the littermate controls (Figure 6E). Consistent with the increased sensitivity to adrenergic stimuli, the adipo tg mice displayed increased expression of β1-, β2- and β3-AR mRNAs in the gonadal adipose tissue (1.7-, 1.6-, and 3-fold increase for β1-, β2-, and β3-AR mRNA in adipo tg mice; P < 0.05). Similar trends were observed in the inguinal depots.
To further test whether the adrenergic sensitivity was specific to adipose tissue, tissue levels of CREB and phospho-CREB were measured in adipose tissue and liver after a 30-hour fast. The levels of phospho-CREB in liver were similar in wild-type and adipo tg mice. However, the phospho-CREB levels in both gonadal and inguinal adipose depots were increased in the adipo tg mice (Figure 7A). These differences in the degree of phosphorylation of CREB were not observed under fed conditions (not shown). This finding suggests the presence of elevated levels of cAMP in adipose tissue of the adipo tg mice in the fasted state.
Figure 7.
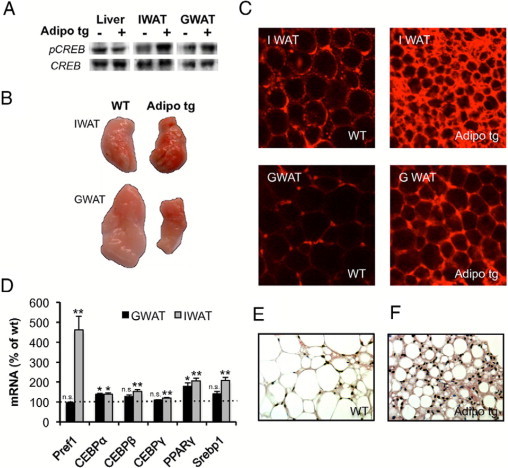
A: Western blot analysis for total and phosphorylated CREB protein in liver, inguinal (IWAT) and gonadal adipose tissue (GWAT). B: Whole fat pads stained with 1% 2,3,5-triphenyltetrazoliumchloride to assess electron transport activity. C: Fat pad minces stained with MitoTracker Orange. D: Regulation of genes involved in adipogenesis in inguinal and gonadal adipose tissue of adipo tg mice. Gene expression data were obtained with DNA array analysis and are expressed as a percentage of wild-type littermate controls (ie, 100% indicates no change in expression compared with controls). *P < 0.05; **P < 0.01 for WT versus adipo tg mice. E and F: Representative examples of H&E-stained IWAT. All data presented in this figure were obtained in male C57B6 adipo tg with littermate wild-type control mice. Pref1, preadipocyte factor 1; Srebp1, sterol regulatory element binding transcription factor 1.
Chronic treatment with β3-AR agonists has been shown to improve metabolism in rodents at multiple levels. Thus, increased β3-AR adrenergic signaling in adipose tissue may be one of the underlying mechanisms that enable adiponectin to exert its positive effects on metabolic health.
Chronic β3-AR agonist improves the capacity for catabolism and re-esterification of fatty acids by increasing the mitochondrial density and function in adipose tissue. Consequently, we examined the adipose tissue of adipo tg mice in more detail with respect to mitochondrial content and function. Mitochondrial electron transport activity as judged by exposure to 2,3,5-triphenyltetrazoliumchloride was increased in both inguinal and gonadal fat pads (Figure 7B). Histological examination also revealed increased mitochondrial density as well as smaller average adipocyte size in the adipo tg mice (Figure 7C). Consistent with these morphological changes, the levels of the mitochondrial protein HSP60 (Supplemental Figure S2, see http://ajp.amjpathol.org), and the mRNA expression of mitochondrial markers was up-regulated in the adipose tissue of the adipo tg mice (Table 4). However, mRNA levels of UCP-1 were similar in the adipo tg and littermate controls.
Table 4.
Significantly Regulated Genes (P < 0.05) in Both Inguinal and Gonadal Adipose Tissue of C57B6 Adipo tg versus Littermate Control Male Mice
| Function | Examples of regulated genes |
|---|---|
| Mitochondrial biogenesis + | PGC-1α, PGC-1β, PPARα |
| Electron transport chain + | Cox8b, GPD2, CYC1, NDUFB5, ATP5G2 |
| Fatty acid catabolism + | CPT2, Crat, Acadl |
| Accumulation of triglycerides + | LPL, DGAT, GLUT4 |
| Fibrosis − | LOX, Col6A3, SPARC, FN1 |
DNA microarray analysis of gonadal and inguinal adipose depots showed that genes were involved in oxidative phosphorylation, accumulation of triglyceride, and fatty acid catabolism and were consistently up-regulated in the adipo tg mice. In contrast, a module of genes that is negatively affected comprises the general category of extracellular matrix proteins that are usually associated with a fibrotic phenotype. These genes were reduced in the adipo tg mice (Table 4). The most up-regulated gene in both gonadal and inguinal fat pads is the lipid-droplet protein cidea (7.0- and 7.2-fold in gonadal and inguinal fat pads). In general, gene expression in the two fat depots showed similar patterns of regulation with respect to metabolic pathways, but the difference between wild-type and adipo tg mice was in many cases more pronounced in the gonadal depot. On the other hand, mRNA expression in the inguinal depots of adipo tg mice indicated further enhanced adipogenesis (Figure 7D), which is consistent with the large clusters of smaller adipocytes together with fibroblast-like cells in this depot (Figure 7, E and F). The mRNA expression of β-AR in the liver or downstream targets of adrenergic signaling were not regulated differently in adipo tg than in littermate control mice.
Collectively our data indicate that the adipo tg adipose tissues display an enhanced lipolytic response on adrenergic stimulation. At the same time, they display an enhanced capacity to store excess lipids with fed conditions. To further examine these aspects, serum samples were obtained from female FVB mice under fed conditions during the dark phase and after a 24-hour fast. Great care was taken to avoid the anticipated stress influence from the sampling procedure by cutting the tail 1 hour before the blood collection. These conditions revealed a clear reduction in fed insulin and FFAs levels, whereas glucose and glycerol levels were unchanged in the adipo tg mice (Figure 8, A–D). The 24-hour fast induced an increase in glycerol levels and more severe hypoglycemia in the adipo tg mice than in littermate controls. Fasting FFA and insulin levels were similar in wild-type and adipo tg mice (Figure 8). Thus, prolonged fasting in the absence of the stressful tail cutting procedure does not lead to the paradoxical increase in insulin levels in the adipo tg mice. This observation highlights the importance of appropriate sampling procedures that becomes particularly relevant in the context of models that are differentially susceptible to β3-AR stimulation.
Figure 8.
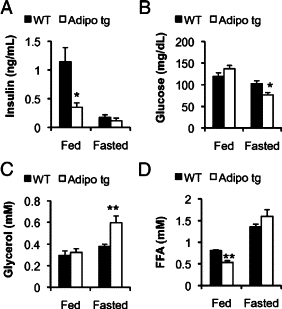
Serum insulin (A), glucose (B), glycerol (C), and FFA (D) levels in the fed state at the dark phase and after a 24-hour fast in female adipo tg FVB and littermate wild-type control mice. n = 4 + 5. *P < 0.05; **P < 0.01 for WT versus adipo tg.
Subsequently, we aimed to estimate how quickly the adipo tg mice are able to switch from fasted to fed state by giving the mice an oral load of glucose after the 24-hour fast. This induced a similar increase in circulating glucose and insulin levels, but the reduction of the FFA level was enhanced in the adipo tg mice (Figure 9, A–C). To obtain additional quantitative data on the metabolic flexibility in the adipo tg mice, metabolic cage studies were performed. Adipo tg and littermate controls first were tested for their response to fasting and refeeding conditions. Thereafter, they were also tested in the context of a switch from normal chow to the HFD. The mice were matched for body weight (19.1±0.9 versus 19.3 ± 0.4 g for wild-type versus adipo tg mice; P = 0.87) and body composition (9.1 ± 1.6 versus 8.1 ± 0.8% fat, wild-type versus adipo tg mice; P = 0.59) to avoid possible interference from these parameters. Neither oxygen consumption nor food intake was altered in the adipo tg mice, although the level of activity was reduced under chow-fed conditions and in the fasted state (Supplemental Figure S3, see http://ajp.amjpathol.org). However, the analysis of RERs revealed significant changes between the genotypes. Adipo tg mice had a larger variability in RER under both chow-fed and HFD-fed conditions, reached a higher average maximal RER with refeeding, and had a lower average RER when fed the HFD compared with controls (Figure 10, A–C). These data indicate a higher metabolic flexibility in the adipo tg mice as judged by an increased lipogenic response on refeeding as well as enhanced fatty acid oxidation with the HFD.
Figure 9.
Change in serum glucose (A), insulin (B), and FFA (C) after an oral load of glucose (2.5 g/kg) to 24-hour fasted mice. n = 4 + 5. *P < 0.05 for WT versus adipo tg mice.
Figure 10.
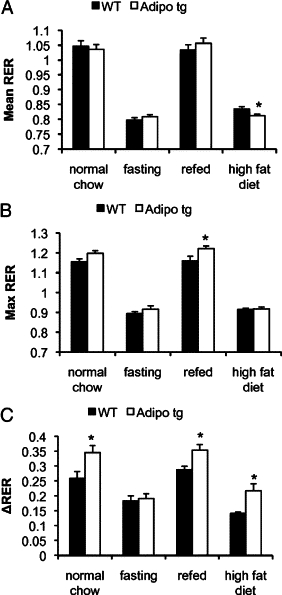
RER analysis of data obtained from female adipo tg C57B6 and littermate wild-type controls fed normal chow, during a fast, on the second day after refeeding and on the second day after the switch form normal chow to the HFD. The average (mean RER, A), the average of the six highest (max RER, B), and the average of the six lowest (min RER) RER values were calculated for each mouse and condition using data collected for 24 hours (12 hours light and 12 hours dark phase). C: Difference (ΔRER) between the averages of the six highest and the six lowest RER values. n = 4 + 6. *P < 0.05 for WT versus adipo tg mice.
Discussion
We have established a novel experimental paradigm for the in vivo analysis of lipotoxicity using a short-term HFD feeding protocol and CT-based measurements of hepatic lipids in rodents. The HFD rapidly induced hepatic steatosis and insulin resistance in mice of both C57B6 and FVB backgrounds. A similar phenomenon has also been reported in human subjects.5 The increase in hepatic lipids slows down during the adaptive phase to exposure to the HFD, but after this initial counterregulatory response, the degree of hepatic lipid accumulation resumes during chronic exposure to the HFD.
In line with our previous studies, we found that overexpression of adiponectin protects against both the acute and the chronic effects of HFD-induced lipotoxic effects of lipid accumulation.21,22 We noticed that a relatively short fast causes hypoglycemia and hypoinsulinemia in adipo tg mice. In contrast, when animals were fasted for 24 hours, we initially found that insulin levels were paradoxically increased compared with baseline levels in the adipo tg mice. However, this increase was not present when care was taken to avoid the stress influence from the tail cut procedure. These observations were highly reproducible and highlight the importance of well controlled sampling procedures. We hypothesized that this unexpected increase in insulin levels may be due to increased adrenergic sensitivity in adipose tissue of the adipo tg mice. Several of our observations support this model. First, fasting-induced hypoglycemia and hypoinsulinemia increase both sympathetic outflow and signaling, and second, adrenergic signaling (via β3-AR) in the adipose tissue causes release of insulin.24,25 Third, injection of a β3-AR agonist causes higher insulin release in the adipo tg but lower insulin release in the adipo−/− mice compared with wild-type controls.
The increased sensitivity to adrenergic agonist-induced lipolysis is further enhanced by hypoinsulinemia in the adipo tg mice under baseline conditions. However, data obtained in FVB mice during the light phase, in which the insulin levels are similar between the genotypes, argues for a direct effect of adiponectin on adrenergic sensitivity in adipose tissue. Indeed, gene expression analysis suggests that the expression of all β-ARs is increased in the adipo tg mice. We do recognize that the increased sensitivity to adrenergic agonists in adipo tg mice may not be related exclusively to receptor expression levels. In fact, we only observed a trend for the up-regulation of β-adrenergic receptors in the inguinal depot of adipo tg mice, which is the depot with the highest adiponectin protein levels in the adipo tg type mice (data not shown). However, genes that are up-regulated by chronic β3-AR agonist treatment are similarly up-regulated in both adipose tissue depots in adipo tg mice (Table 4).9 The increased adrenergic sensitivity may also be explained by the fact that adipocyte adiponectin levels are strongly correlated with caveolin-1 protein expression.21 Caveolin-1 is a major structural component of caveolae, which are Ω-shaped lipid raft structures that have been implicated in a variety of signaling events.26 Interestingly, caveolin-1 knockout adipocytes are less sensitive to β3-AR agonist-induced lipolysis.27 Thus, adiponectin may increase adrenergic signaling through enhanced caveolar function.
The enhanced lipolytic conditions that underlie the elevated levels of adiponectin may also be responsible for the widely reported effect of adiponectin on the activation of AMP kinase. Ruderman and colleagues28 proposed that lipolysis (and more importantly, the subsequent re-esterification of fatty acids) is highly energy-consuming and will lower cellular ATP levels. This has been recognized for β-AR agonists for many years.29 Because adiponectin enhances this re-esterification process in particular, it may therefore indirectly mediate enhanced ATP consumption for the process, leading to a disproportionate lowering of cellular ATP levels, thereby indirectly activating AMP kinase.
Cidea, a lipid droplet-associated protein, was the most up-regulated gene in both the gonadal and the inguinal depots of adipo tg mice. In mice, cidea is expressed to a much higher extent in brown adipose tissue and may play a role in the regulation of thermogenesis,30 whereas the human cidea protein is highly expressed in white adipose tissue. Interestingly, mRNA expression of cidea in adipose tissue correlates positively with insulin sensitivity in body mass index-matched humans and has been shown to enhance triglyceride storage.31 Thus, cidea may also contribute to the adiponectin-mediated effects of adipose tissue biology.
Mitochondrial function is reduced in metabolically compromised states and is increased after chronic thiazolidinedione or β-3AR agonist treatment.32 Although, mitochondria are classically associated with oxidative phosphorylation, they are also critically involved in providing substrates for glyceroneogenesis and fatty acid synthesis. Thus, mitochondrial function in adipose tissue is essential for the reduction of local and systemic lipotoxicity, thereby maintaining metabolic health and flexibility. Gene expression analyses and measurements of mitochondrial density and electron transport function show that adiponectin induces a similar remodeling of adipose tissue as chronic β3-AR agonist exposure. In addition, the reduced FFA/glycerol ratio in young unchallenged adipo tg mice as well as the improved FFA clearance in the adipo tg mice support a direct role for adiponectin in reduction of circulating fatty acids through more efficient re-esterification steps and fatty acid oxidation.
The transient increase in fatty acids may be central in β3-AR agonist-induced remodeling of the adipose tissue as this can activate PPARγ and PPARα, key regulators of adipogenesis and fatty acid catabolism.9,10 Once remodeling has occurred, adipose tissue is more efficient in clearing all sources of fatty acids including dietary lipids. The beneficial effect of adrenergic signaling may also critically depend on cAMP-mediated signaling. Notably, proliferator-activated receptor-γ coactivator-1β, the master regulator of mitochondrial biogenesis, is regulated by cAMP.33 Moreover, adipocyte differentiation from preadipocytes/fibroblasts is also driven by cAMP.16 The overexpression of adiponectin in our adipo tg mice is driven by the aP2 promoter, which is induced at early stages of adipogenesis.34 Thus, increased expression of adiponectin at this stage may enhance adipogenesis through an increase in cAMP levels. The adiponectin-induced phenotype of specific fat pads may therefore be a consequence of the degree of sympathetic innervation as well as the local availability of adipogenic precursor cells. The gonadal fat pad remains very small in the adipo tg mice, indicating that the rate of adipogenesis is lower than the rate of fatty acid catabolism in this location. In contrast, overexpression of adiponectin in the inguinal fat pad seems to have a profound stimulatory effect on adipogenesis as judged from histological examination, gene expression profiling, and the larger size of this fat pad. This could be a reflection of enhanced adrenergic signaling and cAMP levels in preadipocytes, which overrules the effects of adrenergic signaling in mature adipocytes. Of particular interest is the observation that pref-1 (a preadipocyte marker) is strongly up-regulated in the inguinal but not in the gonadal depots of the adipo tg mice. The size and the appearance of the inguinal fat pad together with the increased expression of pro-adipogenic genes indicate increased inguinal adipogenesis. Therefore, the increased presence of pref-1-positive cells is a reflection of a larger number of preadipocytes in this depot. Of note is the fact that in this context patients with lipoatrophic HIV exhibit a nearly complete absence of pref-1 expression in adipose tissue. Thus, a deficiency of preadipocytes is a reflection of limited expansion potential.35
The relative expression pattern of genes involved in metabolism is highly dependent on whether the tissues are obtained during an anabolic or catabolic state. Our in vivo studies are mostly performed during the daytime, ie, when the mice are usually inactive and in a catabolic state. This is a state in which the effects of adrenergic signaling pathways are of particular importance. However, analysis of RER throughout the day and night and in response to refeeding as well as the measurement of serum parameters indicate that adiponectin also promotes lipogenesis in the presence of insulin under fed conditions. We therefore propose that adiponectin plays an important role in promoting metabolic flexibility by making adipose tissue more sensitive to changes in metabolic state. Thus, lipid catabolism is enhanced in the fasted state, whereas lipid synthesis and storage are enhanced in the fed state. A similar phenomenon is observed during caloric restriction and intermittent fasting, both of which are associated with improved systemic insulin sensitivity.36 For instance, Varady et al37 show that intermittent fasting induces increased lipolysis, increased lipogenesis, decreased adipocyte size, but no change in total fat mass. Furthermore, the concept of metabolic flexibility (or loss thereof) in muscle in the context of type 2 diabetes has found widespread acceptance through the elegant work of Kelley.38
How well can these observations from rodents be translated to human physiology? The cause-effect relationships between altered levels of adiponectin (brought about either through genetic or pharmacological interventions) established in murine studies have held up remarkably well at the correlational level in humans. β3-Adrenergic receptors are, however, not expressed to the same high levels in human adipose tissue compared with mice. Nevertheless, adiponectin may increase sensitivity to adrenergic stimulation originating from other β-ARs as well. In fact, adrenergic sensitivity in adipose tissue is reduced in obese as well as in nonobese insulin-resistant subjects, both states that are associated with reduced adiponectin levels.14,15 It may be counterintuitive that increased sensitivity to adrenergic stimuli improves metabolism, as increased lipolysis in insulin-resistant states is viewed as a reason for disproportionate elevations of FFAs and a major cause of lipotoxicity. However, under metabolically healthy conditions, activation of the sympathetic nervous system is only induced during fasting or during “fight and flight responses,” ie, when the fatty acids are needed. Thus, increased sensitivity to adrenergic stimuli in adipose tissue will not cause metabolic dysregulation per se but rather will be beneficial for the maintenance of metabolic flexibility in the long run.
Combining our results, we propose a model in which adiponectin exerts a crucial role in the maintenance of adaptation to rapidly changing metabolic conditions as we go from the fed postadsorptive state to fasting conditions (Figure 11, A and B). Although the effects of adiponectin on target tissues are well established, our observations here also point to an important role of adiponectin in adipose tissue proper.
Figure 11.
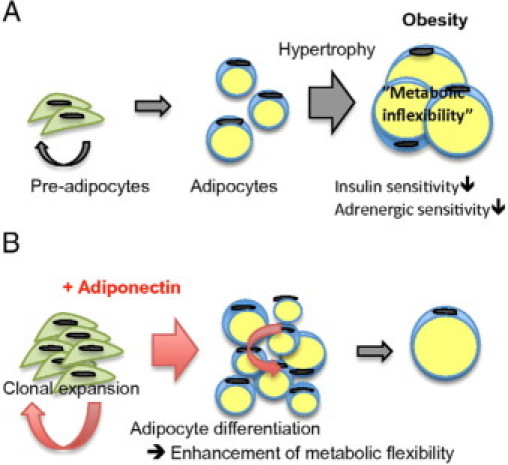
Fat mass expansion during weight gain is mainly due to hypertrophy of the existing adipocytes (A). We hypothesize that adiponectin increases clonal expansion of preadipocytes as well as adipocyte differentiation, which will result in more but smaller adipocytes at a given degree of energy surplus (B).
Acknowledgements
We thank the Metabolic Phenotyping Core and the Molecular Pathology Core, the DNA Microarray Core, and the Live Cell Imaging Core at University of Texas Southwestern for their help at various stages of this work, as well as the rest of the Scherer, Unger, and Clegg laboratories for helpful discussions.
Footnotes
Supported by the National Institutes of Health (grants R01-DK55758 and R01-CA112023 to P.E.S.). I.W.A. was also supported with a fellowship from the Throne-Holst Foundation and the Swedish Research Council (2006-3931).
A guest editor acted as editor-in-chief for this manuscript. No person at Thomas Jefferson University or Albert Einstein College of Medicine was involved in the peer review process or final disposition for this article.
Supplemental material for this article can be found on http://ajp.amjpathol.org.
Web Extra Material
References
- 1.Kusminski CM, Shetty S, Orci L, Unger RH, Scherer PE. Diabetes and apoptosis: lipotoxicity. Apoptosis. 2009;14:1484–1495. doi: 10.1007/s10495-009-0352-8. [DOI] [PubMed] [Google Scholar]
- 2.Heilbronn L, Smith SR, Ravussin E. Failure of fat cell proliferation, mitochondrial function and fat oxidation results in ectopic fat storage, insulin resistance and type II diabetes mellitus. Int J Obes Relat Metab Disord. 2004;28(Suppl 4):S12–S21. doi: 10.1038/sj.ijo.0802853. [DOI] [PubMed] [Google Scholar]
- 3.Summers SA. Ceramides in insulin resistance and lipotoxicity. Prog Lipid Res. 2006;45:42–72. doi: 10.1016/j.plipres.2005.11.002. [DOI] [PubMed] [Google Scholar]
- 4.Capeau J. Insulin resistance and steatosis in humans. Diabetes Metab. 2008;34:649–657. doi: 10.1016/S1262-3636(08)74600-7. [DOI] [PubMed] [Google Scholar]
- 5.Westerbacka J, Lammi K, Hakkinen AM, Rissanen A, Salminen I, Aro A, Yki-Jarvinen H. Dietary fat content modifies liver fat in overweight nondiabetic subjects. J Clin Endocrinol Metab. 2005;90:2804–2809. doi: 10.1210/jc.2004-1983. [DOI] [PubMed] [Google Scholar]
- 6.Bogacka I, Xie H, Bray GA, Smith SR. The effect of pioglitazone on peroxisome proliferator-activated receptor-γ target genes related to lipid storage in vivo. Diabetes Care. 2004;27:1660–1667. doi: 10.2337/diacare.27.7.1660. [DOI] [PubMed] [Google Scholar]
- 7.Kolak M, Yki-Jarvinen H, Kannisto K, Tiikkainen M, Hamsten A, Eriksson P, Fisher RM. Effects of chronic rosiglitazone therapy on gene expression in human adipose tissue in vivo in patients with type 2 diabetes. J Clin Endocrinol Metab. 2007;92:720–724. doi: 10.1210/jc.2006-1465. [DOI] [PubMed] [Google Scholar]
- 8.de Souza CJ, Hirshman MF, Horton ES. CL-316,243, a β3-specific adrenoceptor agonist, enhances insulin-stimulated glucose disposal in nonobese rats. Diabetes. 1997;46:1257–1263. doi: 10.2337/diab.46.8.1257. [DOI] [PubMed] [Google Scholar]
- 9.Granneman JG, Li P, Zhu Z, Lu Y. Metabolic and cellular plasticity in white adipose tissue I: effects of β3-adrenergic receptor activation. Am J Physiol Endocrinol Metab. 2005;289:E608–E616. doi: 10.1152/ajpendo.00009.2005. [DOI] [PubMed] [Google Scholar]
- 10.Li P, Zhu Z, Lu Y, Granneman JG. Metabolic and cellular plasticity in white adipose tissue II: role of peroxisome proliferator-activated receptor-α. Am J Physiol Endocrinol Metab. 2005;289:E617–E626. doi: 10.1152/ajpendo.00010.2005. [DOI] [PubMed] [Google Scholar]
- 11.Mottillo EP, Shen XJ, Granneman JG. Role of hormone-sensitive lipase in β-adrenergic remodeling of white adipose tissue. Am J Physiol Endocrinol Metab. 2007;293:E1188–E1197. doi: 10.1152/ajpendo.00051.2007. [DOI] [PubMed] [Google Scholar]
- 12.Blachère JC, Perusse F, Bukowiecki LJ. Lowering plasma free fatty acids with Acipimox mimics the antidiabetic effects of the β3-adrenergic agonist CL-316243 in obese Zucker diabetic fatty rats. Metabolism. 2001;50:945–951. doi: 10.1053/meta.2001.24868. [DOI] [PubMed] [Google Scholar]
- 13.Rosenbaum M, Malbon CC, Hirsch J, Leibel RL. Lack of β3-adrenergic effect on lipolysis in human subcutaneous adipose tissue. J Clin Endocrinol Metab. 1993;77:352–355. doi: 10.1210/jcem.77.2.8393882. [DOI] [PubMed] [Google Scholar]
- 14.Lönnqvist F, Wahrenberg H, Hellstrom L, Reynisdottir S, Arner P. Lipolytic catecholamine resistance due to decreased β2-adrenoceptor expression in fat cells. J Clin Invest. 1992;90:2175–2186. doi: 10.1172/JCI116103. [DOI] [PMC free article] [PubMed] [Google Scholar]
- 15.Ek I, Arner P, Bergqvist A, Carlstrom K, Wahrenberg H. Impaired adipocyte lipolysis in nonobese women with the polycystic ovary syndrome: a possible link to insulin resistance? J Clin Endocrinol Metab. 1997;82:1147–1153. doi: 10.1210/jcem.82.4.3899. [DOI] [PubMed] [Google Scholar]
- 16.Farmer SR. Transcriptional control of adipocyte formation. Cell Metab. 2006;4:263–273. doi: 10.1016/j.cmet.2006.07.001. [DOI] [PMC free article] [PubMed] [Google Scholar]
- 17.Scherer PE, Williams S, Fogliano M, Baldini G, Lodish HF. A novel serum protein similar to C1q, produced exclusively in adipocytes. J Biol Chem. 1995;270:26746–26749. doi: 10.1074/jbc.270.45.26746. [DOI] [PubMed] [Google Scholar]
- 18.Berg AH, Combs TP, Du X, Brownlee M, Scherer PE. The adipocyte-secreted protein Acrp30 enhances hepatic insulin action. Nat Med. 2001;7:947–953. doi: 10.1038/90992. [DOI] [PubMed] [Google Scholar]
- 19.Zhou H, Song X, Briggs M, Violand B, Salsgiver W, Gulve EA, Luo Y. Adiponectin represses gluconeogenesis independent of insulin in hepatocytes. Biochem Biophys Res Commun. 2005;338:793–799. doi: 10.1016/j.bbrc.2005.10.007. [DOI] [PubMed] [Google Scholar]
- 20.Nawrocki AR, Rajala MW, Tomas E, Pajvani UB, Saha AK, Trumbauer ME, Pang Z, Chen AS, Ruderman NB, Chen H, Rossetti L, Scherer PE. Mice lacking adiponectin show decreased hepatic insulin sensitivity and reduced responsiveness to peroxisome proliferator-activated receptor γ agonists. J Biol Chem. 2006;281:2654–2660. doi: 10.1074/jbc.M505311200. [DOI] [PubMed] [Google Scholar]
- 21.Combs TP, Pajvani UB, Berg AH, Lin Y, Jelicks LA, Laplante M, Nawrocki AR, Rajala MW, Parlow AF, Cheeseboro L, Ding YY, Russell RG, Lindemann D, Hartley A, Baker GR, Obici S, Deshaies Y, Ludgate M, Rossetti L, Scherer PE. A transgenic mouse with a deletion in the collagenous domain of adiponectin displays elevated circulating adiponectin and improved insulin sensitivity. Endocrinology. 2004;145:367–383. doi: 10.1210/en.2003-1068. [DOI] [PubMed] [Google Scholar]
- 22.Kim JY, van de Wall E, Laplante M, Azzara A, Trujillo ME, Hofmann SM, Schraw T, Durand JL, Li H, Li G, Jelicks LA, Mehler MF, Hui DY, Deshaies Y, Shulman GI, Schwartz GJ, Scherer PE. Obesity-associated improvements in metabolic profile through expansion of adipose tissue. J Clin Invest. 2007;117:2621–2637. doi: 10.1172/JCI31021. [DOI] [PMC free article] [PubMed] [Google Scholar]
- 23.Folch J, Lees M, Sloane Stanley GH. A simple method for the isolation and purification of total lipides from animal tissues. J Biol Chem. 1957;226:497–509. [PubMed] [Google Scholar]
- 24.Gavrilova O, Marcus-Samuels B, Reitman ML. Lack of responses to a β3-adrenergic agonist in lipoatrophic A-ZIP/F-1 mice. Diabetes. 2000;49:1910–1916. doi: 10.2337/diabetes.49.11.1910. [DOI] [PubMed] [Google Scholar]
- 25.Yoshida T. The antidiabetic β3-adrenoceptor agonist BRL 26830A works by release of endogenous insulin. Am J Clin Nutr. 1992;55:237S–241S. doi: 10.1093/ajcn/55.1.237s. [DOI] [PubMed] [Google Scholar]
- 26.Okamoto T, Schlegel A, Scherer PE, Lisanti MP. Caveolins, a family of scaffolding proteins for organizing “preassembled signaling complexes” at the plasma membrane. J Biol Chem. 1998;273:5419–5422. doi: 10.1074/jbc.273.10.5419. [DOI] [PubMed] [Google Scholar]
- 27.Cohen AW, Razani B, Schubert W, Williams TM, Wang XB, Iyengar P, Brasaemle DL, Scherer PE, Lisanti MP. Role of caveolin-1 in the modulation of lipolysis and lipid droplet formation. Diabetes. 2004;53:1261–1270. doi: 10.2337/diabetes.53.5.1261. [DOI] [PubMed] [Google Scholar]
- 28.Gauthier MS, Miyoshi H, Souza SC, Cacicedo JM, Saha AK, Greenberg AS, Ruderman NB. AMP-activated protein kinase is activated as a consequence of lipolysis in the adipocyte: potential mechanism and physiological relevance. J Biol Chem. 2008;283:16514–16524. doi: 10.1074/jbc.M708177200. [DOI] [PMC free article] [PubMed] [Google Scholar]
- 29.Kather H. β-Adrenergic stimulation of adenine nucleotide catabolism and purine release in human adipocytes. J Clin Invest. 1990;85:106–114. doi: 10.1172/JCI114399. [DOI] [PMC free article] [PubMed] [Google Scholar]
- 30.Zhou Z, Yon Toh S, Chen Z, Guo K, Ng CP, Ponniah S, Lin SC, Hong W, Li P. Cidea-deficient mice have lean phenotype and are resistant to obesity. Nat Genet. 2003;35:49–56. doi: 10.1038/ng1225. [DOI] [PubMed] [Google Scholar]
- 31.Puri V, Ranjit S, Konda S, Nicoloro SM, Straubhaar J, Chawla A, Chouinard M, Lin C, Burkart A, Corvera S, Perugini RA, Czech MP. Cidea is associated with lipid droplets and insulin sensitivity in humans. Proc Natl Acad Sci USA. 2008;105:7833–7838. doi: 10.1073/pnas.0802063105. [DOI] [PMC free article] [PubMed] [Google Scholar]
- 32.Wilson-Fritch L, Nicoloro S, Chouinard M, Lazar MA, Chui PC, Leszyk J, Straubhaar J, Czech MP, Corvera S. Mitochondrial remodeling in adipose tissue associated with obesity and treatment with rosiglitazone. J Clin Invest. 2004;114:1281–1289. doi: 10.1172/JCI21752. [DOI] [PMC free article] [PubMed] [Google Scholar]
- 33.Puigserver P, Spiegelman BM. Peroxisome proliferator-activated receptor-γ coactivator 1α (PGC-1α): transcriptional coactivator and metabolic regulator. Endocr Rev. 2003;24:78–90. doi: 10.1210/er.2002-0012. [DOI] [PubMed] [Google Scholar]
- 34.Bernlohr DA, Angus CW, Lane MD, Bolanowski MA, Kelly TJ., Jr Expression of specific mRNAs during adipose differentiation: identification of an mRNA encoding a homologue of myelin P2 protein. Proc Natl Acad Sci USA. 1984;81:5468–5472. doi: 10.1073/pnas.81.17.5468. [DOI] [PMC free article] [PubMed] [Google Scholar]
- 35.Hellerstein MK. Turnover of adipose components and mitochondrial DNA in humans: kinetic biomarkers for human immunodeficiency virus-associated lipodystrophy and mitochondrial toxicity? Clin Infect Dis. 2003;37(Suppl 2):S52–S61. doi: 10.1086/375888. [DOI] [PubMed] [Google Scholar]
- 36.Anson RM, Guo Z, de Cabo R, Iyun T, Rios M, Hagepanos A, Ingram DK, Lane MA, Mattson MP. Intermittent fasting dissociates beneficial effects of dietary restriction on glucose metabolism and neuronal resistance to injury from calorie intake. Proc Natl Acad Sci USA. 2003;100:6216–6220. doi: 10.1073/pnas.1035720100. [DOI] [PMC free article] [PubMed] [Google Scholar]
- 37.Varady KA, Roohk DJ, Loe YC, McEvoy-Hein BK, Hellerstein MK. Effects of modified alternate-day fasting regimens on adipocyte size, triglyceride metabolism, and plasma adiponectin levels in mice. J Lipid Res. 2007;48:2212–2219. doi: 10.1194/jlr.M700223-JLR200. [DOI] [PubMed] [Google Scholar]
- 38.Kelley DE. Skeletal muscle fat oxidation: timing and flexibility are everything. J Clin Invest. 2005;115:1699–1702. doi: 10.1172/JCI25758. [DOI] [PMC free article] [PubMed] [Google Scholar]
Associated Data
This section collects any data citations, data availability statements, or supplementary materials included in this article.