

Abstract
Expression of the S1S2 ligand binding domain [Kuusinen, A., Arvola, M. & Keinänen, K. (1995) EMBO J. 14, 6327–6332] of the rat α-amino-3-hydroxy-5-methylisoxazole-4-propionic acid-selective glutamate receptor GluR2 in Escherichia coli under control of a T7 promoter leads to production of >100 mg/liter of histidine-tagged S1S2 protein (HS1S2) in the form of inclusion bodies. Using a novel fractional factorial folding screen and a rational, step-by-step approach, multiple conditions were determined for the folding of the HS1S2 α-amino-3-hydroxy-5-methylisoxazole-4-propionic acid binding domain. Characterization of the HS1S2 ligand binding domain showed that it is water-soluble, monomeric, has significant secondary structure, and is sensitive to trypsinolysis at sites close to the beginning of the putative transmembrane regions. Application of a fractional factorial folding screen to other proteins may provide a useful means to evaluate E. coli as an economical and convenient expression host.
Keywords: AMPA receptor, in vitro folding, ligand-gated ion channel, inclusion bodies, fractional factorial folding screen
Ionotropic glutamate receptors (iGluR), found throughout the central nervous systems of vertebrates and invertebrates, are the primary mediators of excitatory neuronal events (1–5). The iGluRs form ligand-gated, cation-permeable channels that span cell membranes (6). Consonant with the essential roles of iGluRs in normal neurophysiology, dysfunctional receptors are implicated in brain disease and trauma ranging from epilepsy to stroke (7, 8). iGluRs can be segregated into three groups on the basis of their affinities and functional responses to the agonists α-amino-3-hydroxy-5-methyl-4-isoxazole propionic acid (AMPA) and N-methyl-d-aspartate (NMDA), and to the potent neurotoxin kainate (KA) (9–11). Thus, for the rat iGluRs, GluR1–4 define the AMPA receptors, NMDA1 and NMDA2a–d make up the NMDA receptors, and GluR5–7 and KA1–2 comprise the kainate receptors (3).
Viewed through the lens of elegant biological and biophysical experiments, specific functional and structural features of iGluRs have come into focus. Molecular studies have elucidated the basis for the transport properties of the channel (12–14), the identity of a key residue involved in the Joro spider toxin block of AMPA/KA receptors (15), the amino acids that modulate the kinetics of channel opening and closing (16, 17), the specificity and affinity determinants of the ligand binding site (18–21), and the residues involved in receptor allostery (22). Assembly of homomeric and heteromeric channels (4) and expression of receptor mRNAs modified by exon swapping and RNA editing (16, 23, 24) confer functional diversity upon the oligomeric iGluRs.
With respect to structural features, separate studies have presented compelling evidence for a topology with three transmembrane segments and a reentrant loop (25–27), a ligand binding domain composed of discontinuous polypeptide sections separated by membrane regions 1, 2, and 3 (Fig. 1A and refs. 20 and 28), and a pentameric subunit stoichiometry (29). Most significantly, the structural similarity between the ligand binding regions of the glutamate receptors and the bacterial periplasmic ligand binding proteins, originally discerned by Nakanishi and coworkers (30), has been reinforced by site-directed mutagenesis (19, 28, 31–33), chimera (20), and S1–S2 fusion experiments (34, 35). Although the studies to date have provided insight into the function and structure of iGluRs, a trove of significant questions remain that can be well addressed by detailed structural studies.
Figure 1.
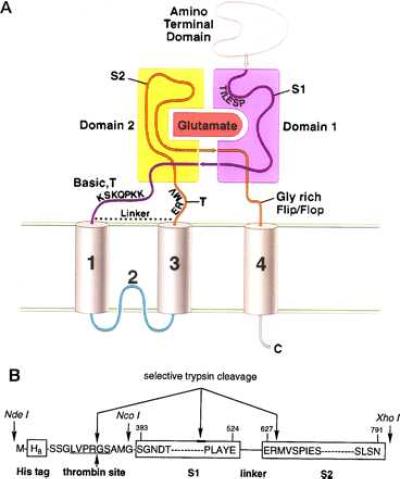
(A) Working model for the domain organization of the glutamate receptor derived from previous experimental, sequence analysis, and molecular modeling studies (20, 28, 31). Indicated are the amino-terminal domain, the S1 and S2 regions, and the proposed transmembrane and membrane-associated segments. Domains 1 and 2 are primarily composed of polypeptide segments S1 and S2, respectively. However, the carboxyl terminus of S1 probably crosses over into domain 2, and the carboxyl terminus of S2 may compose a portion of domain 1. In HS1S2, there is a trypsin site (T) after membrane segment 3, and the locations of trypsin sites before membrane segment 1 are probably within the basic region. The glycine-rich flop sequence before membrane segment 4 is also indicated. (B) Schematic of the HS1S2 construct using the single amino acid code. Sites of proteolytic reactivity are indicated as are three of the key restriction sites present in the corresponding DNA sequence. The numbers above the amino acid residues refer to the residue numbers of the full-length receptor.
Despite intensive biological and biophysical studies of iGluRs, neither a high resolution, three-dimensional structure of a glutamate receptor nor a portion of a receptor has been obtained. Overexpression of the receptor or receptor domains certainly presents one significant obstacle. Low level expression of AMPA, NMDA, and KA receptors has been achieved in HeLa cells, Xenopus oocytes, and baculovirus-infected insect cells (36–38). Significantly, constructs in which the S1 and S2 regions (20) were linked together by an 11-residue peptide have been expressed in insect cells and in the periplasm of Escherichia coli (S1S2; ref. 35). Unfortunately, even the latter approach yielded only ∼100 μg/liter of crude S1S2 protein (35), an amount which is not optimal for thorough crystallization and crystallographic studies. Therefore, we set out to produce large quantities of the S1S2 ligand binding domains in E. coli (Fig. 1B).
The strategy for the production of the S1S2 GluR2 ligand binding domain is outlined in Fig. 2. Because expression of the histidine-tagged S1S2 construct (HS1S2) as inclusion bodies was a central element of the strategy, we pursued two approaches to search for folding conditions. On the one hand, a systematic step-by-step route was taken in which biochemically reasonable parameters were varied one at a time. On the other hand, we designed a 12-factor, resolution III fractional factorial folding screen to search for folding conditions (39). For both approaches, we took advantage of biochemical insight as well as the copious literature on protein folding and refolding (40–44). In the end, both approaches were successful in the production of folded, biologically active HS1S2. However, from the fractional factorial folding screen, multiple folding conditions were found, and one condition was most economical and time efficient.
Figure 2.
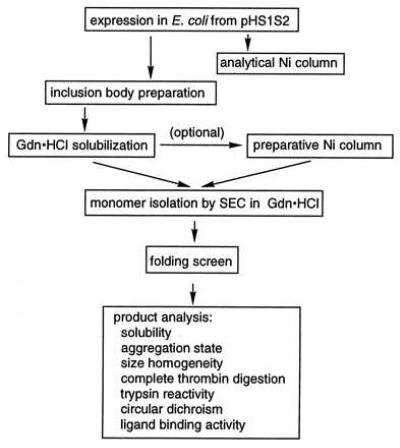
Outline of the approach to the production of HS1S2 in E. coli.
MATERIALS AND METHODS
Materials.
GluR2 cDNA was obtained from Drs. Heinemann and Hartley (Salk Institute). The oligonucleotides for PCR were as follows: PRM1, 5′-CGGAATTCGCCATGGGCTCAGGAAATGACACGTCT-3′; PRM2, 5′-TTCTTCGGCATTGACCTCACCCTCGGTCGACTCATAGGCTAAAGGATC-3′; PRM3, 5′-GAGGTCAATGCCGAAGAAGAGGGATTTGAGAGGATGGTGTCTCCCATC-3′; and PRM4, 5′-CCGCTCGAGTCATCAGTTGCTCAGACTGAGGGC-3′. Immobilon-pSQ and GSWP 02500 membranes and a sampling manifold were from Millipore. [3H]AMPA was from New England Nuclear. Kainic acid was from Research Biochemicals (Natick, MA). 1,2-Diheptanoyl-sn-glycero-3-phosphocholine was from Avanti Polar Lipids (Alabaster, AL). The 200-μl dialysis chambers were purchased from Cambridge Repetition Engineers (Cambridge, UK).
Buffers.
Buffer A, 50 mM Tris⋅HCl, pH 8.0, 1 mM EDTA, 100 mM NaCl, 1 mM phenylmethylsulfonyl fluoride (PMSF); buffer B, 50 mM Tris⋅HCl, pH 8.0, 10 mM EDTA, 100 mM NaCl, 0.5% Triton X-100, 1 mM PMSF; buffer C, 20 mM Tris⋅HCl, pH 7.4, 1 mM EDTA, 200 mM NaCl; buffer D, 50 mM Tris⋅HCl, pH 7.4, 5 mM EDTA, 8 M guanidine hydrochloride (Gdn⋅HCl), 5 mM DTT; buffer E, 20 mM NaOAc, 4 M Gdn⋅HCl, 1 mM DTT, pH 4.5; buffer F, 100 mM sodium phosphate, pH 6.8, 200 mM sodium sulfate, 10 mM glutamate, 1 mM DTT, 2 mM EDTA; buffer G, 100 mM sodium phosphate, 0.5 M Gdn⋅HCl, 0.5 M arginine hydrochloride, 5 mM EDTA, 20% glycerol, 10 mM glutamate, 1 mM DTT, pH 6.5; buffer H, 100 mM sodium phosphate, pH 6.5, 10 mM glutamate, 1 mM DTT; buffer I, 30 mM Tris⋅HCl, 100 mM KSCN, 2.5 mM CaCl2, 10% glycerol, pH 7.2.
Measurement of Protein Concentration.
The protein concentration of purified HS1S2 was determined by ultraviolet-visible spectroscopy using an extinction coefficient estimated from a BCA protein assay (1 OD280 ≈ 1.04 mg/ml).
Construction of the HS1S2 Gene.
The HS1S2 gene was constructed via a two-step PCR process. In the first step, the S1 and S2 gene fragments were amplified from pRB14 containing the GluR2 (flop) gene (45), in which PRM1 and PRM2 were the primers for S1 and primers PRM3 and PRM4 were for S2. In the second step, the HS1S2 gene was amplified using the S1 and S2 fragments and PRM1 and PRM4. PCR reaction volumes (100 μl) contained 0.02 nM template, 200 nM of each primer, 200 μM dNTPs, and 0.037 unit/μl Pfu DNA polymerase. The only product was of the desired size, and it was gel-purified, digested by NcoI and XhoI, and cloned into pETGQ according to standard methods, yielding pHS1S2. The authenticity of the HS1S2 insert was confirmed by sequencing both strands.
HS1S2 Expression.
For expression of HS1S2 on a 10-ml scale, 100 μl of an overnight culture of BL21(DE3) cells transformed with pHS1S2 were added to 10 ml of fresh Luria–Bertani media supplemented with kanamycin (30 μg/ml). After growth at 37°C (3 h), expression was induced by the addition of 1 mM isopropyl-β-d-thiogalactoside, and the cells were incubated for an additional 2 h. After harvesting the cells by centrifugation, the cell extracts were partially purified by Ni-NTA spin columns, and the resulting material was analyzed by SDS/PAGE. For expression of HS1S2 on a 1-liter scale, the cell pellet was resuspended in 9 ml of buffer A supplemented with lysozyme (10 mg) and deoxycholate (12 mg) at 0°C (20 min), followed by incubation at 37°C for 10 min. When the suspension cooled to ∼24°C, 60 μl of 1 M CaCl2 and 0.5 mg of DNase I were added, and the viscous suspension was stirred at RT (30 min). The crude inclusion bodies were isolated by centrifugation (23,000 × g, 4°C, 20 min) and were washed with (i) 20 ml of ice-cold buffer B and (ii) 20 ml of ice-cold buffer C containing 1 mM PMSF.
Purification of HS1S2 Under Denaturing Conditions.
The washed inclusion bodies were solubilized in buffer D (RT, 2–6 h), and the resulting solution was clarified by centrifugation (125,000 × g, 20°C, 30 min). The supernatant was dialyzed against buffer E at 4°C overnight, and the dialysate was centrifuged (125,000 × g, 4°C, 1 h) to remove precipitate. Monomeric HS1S2 was isolated by size exclusion chromatography (SEC) in buffer E, and the protein purity was checked by SDS/PAGE. The purified HS1S2 monomer in buffer E was concentrated to 10 mg/ml and stored at −80°C.
Fractional Factorial Folding Screen.
A resolution III fractional factorial folding screen in which 12 factors were sampled at two levels in 16 experimental runs was designed using JMP software (Version 3, SAS Institute; Table 1). HS1S2 in buffer E was dialyzed in 16 microdialysis chambers (200 μl each) against 20 ml of the 16 buffers at either 4°C or RT for 18 h. Subsequently, all of the chambers were dialyzed against 40 ml of buffer F at 4°C for 4 h. The protein solutions were removed from the chambers using a microsyringe and centrifuged (128,000 × g, 4°C, 30 min). The supernatant was transferred into fresh tubes and analyzed by SDS/PAGE, HPLC, and [3H]AMPA binding experiments. The TSK-GEL G3000SW column was equilibrated in buffer F, run at 0.75 ml/min (RT), and loaded with 50 μl of sample per run. Folded HS1S2 purified by SEC (see below) was used as a quantitative standard for the HPLC experiments.
Table 1.
Fractional factorial folding screen
| No.a | Patternb | Conditions
|
Analysis
|
|||||||||||||
|---|---|---|---|---|---|---|---|---|---|---|---|---|---|---|---|---|
| Protein, mg/ml | pH | IS,c mM | Td | Divalentse | Polar additive | Nonpolar additive,f % | Chaotrope | Reduced/oxidizedg | Detergent,h mM | Ligand,i mM | PEG,j % | SDS/PAGEk | SEC,l % | Ligand bindingm | ||
| 1 | −+−++−+−−+−+ | 0.1 | 8.5 | 10 | 20 | Mg, Ca | None | 21 | None | DTT | 5.0 | None | 0.05 | − | 1.0 | 782 |
| 2 | +++−−−−−−−−+ | 1.0 | 8.5 | 250 | 4 | EDTA | None | None | None | DTT | None | None | 0.05 | ++ | 6.0 | 8318 |
| 3 | −+++−+−+−+−− | 0.1 | 8.5 | 250 | 20 | EDTA | 0.5 M Arg | None | 0.75 M Gdn⋅HCl | DTT | 5.0 | None | None | ++ | <0.1 | <200 |
| 4 | −+−−−+−++−++ | 0.1 | 8.5 | 10 | 4 | EDTA | 0.5 M Arg | None | 0.75 M Gdn⋅HCl | GSH:GSSG | None | 10.0 | 0.05 | + | <0.1 | <200 |
| 5 | +−+−++−−++−− | 1.0 | 6.0 | 250 | 4 | Mg, Ca | 0.5 M Arg | None | None | GSH:GSSG | 5.0 | None | None | − | 1.0 | <200 |
| 6 | +−++−−++−−+− | 1.0 | 6.0 | 250 | 20 | EDTA | None | 21 | 0.75 M Gdn⋅HCl | DTT | None | 10.0 | None | − | 0.4 | <200 |
| 7 | ++++++++++++ | 1.0 | 8.5 | 250 | 20 | Mg, Ca | 0.5 M Arg | 21 | 0.75 M Gdn⋅HCl | GSH:GSSG | 5.0 | 10.0 | 0.05 | − | 0.8 | <200 |
| 8 | −−−−+−−+−++− | 0.1 | 6.0 | 10 | 4 | Mg, Ca | None | None | 0.75 M Gdn⋅HCl | DTT | 5.0 | 10.0 | None | + | 4.0 | 2891 |
| 9 | +−−+++−−−−++ | 1.0 | 6.0 | 10 | 20 | Mg, Ca | 0.5 M Arg | None | None | DTT | None | 10.0 | 0.05 | − | 0.6 | <200 |
| 10 | −−+−−++−−+++ | 0.1 | 6.0 | 250 | 4 | EDTA | 0.5 M Arg | 21 | None | DTT | 5.0 | 10.0 | 0.05 | + | 3.0 | <200 |
| 11 | −−+++−−++−−+ | 0.1 | 6.0 | 250 | 20 | Mg, Ca | None | None | 0.75 M Gdn⋅HCl | GSH:GSSG | None | None | 0.05 | − | <0.1 | <200 |
| 12 | +−−−−−++++−+ | 1.0 | 6.0 | 10 | 4 | EDTA | None | 21 | 0.75 M Gdn⋅HCl | GSH:GSSG | 5.0 | None | 0.05 | − | 1.0 | <200 |
| 13 | ++−−++++−−−− | 1.0 | 8.5 | 10 | 4 | Mg, Ca | 0.5 M Arg | 21 | 0.75 M Gdn⋅HCl | DTT | None | None | None | ++ | 5.0 | 5490 |
| 14 | ++−+−−−−+++− | 1.0 | 8.5 | 10 | 20 | EDTA | None | None | None | GSH:GSSG | 5.0 | 10.0 | None | − | 0.3 | <200 |
| 15 | −++−+−+−+−+− | 0.1 | 8.5 | 250 | 4 | Mg, Ca | None | 21 | None | GSH:GSSG | None | 10.0 | None | ++ | 8.0 | 6183 |
| 16 | −−−+−++−+−−− | 0.1 | 6.0 | 10 | 20 | EDTA | 0.5 M Arg | 21 | None | GSH:GSSG | None | None | None | − | <0.1 | <200 |
Solution number.
Pattern of factor levels.
Ionic strength, molar ratio of NaCl to KCl was 25:1.
Temperature in °C.
MgCl2, CaCl2 concentrations were 2 mM; EDTA concentration was 1.0 mM.
The nonpolar additive was composed of 20% glycerol (v/v) and 1% sucrose (w/v).
Concentration of DTT was 1.0 mM, and the concentrations of reduced (GSH) and oxidized (GSSG) glutathione were 1.0 and 0.1 mM, respectively.
1,2-Diheptanoyl-sn-glycero-3-phorphocholine.
l-Glutamate.
PEG MWave = 3350 Da, and the concentration was w/v.
Protein concentration in the supernatant following dialysis against refolding buffers and centrifugation at 128,000 × g for 30 min (4°C) was estimated by SDS/PAGE. − corresponds to <0.1 μg or to <3% yield of water-soluble HS1S2; “+” and “++” correspond to ∼10 and ∼20% yields of water-soluble HS1S2, respectively.
Folding yield estimated by integration of monomer peak from SEC chromatogram.
The units are cpm. [3H]AMPA (20 nM, 10.6 Ci/mmol) and 2 or 20 μl of each refolding mixture with an initial protein concentration of 1.0 or 0.1 mg/ml, respectively, were used to measure specific ligand binding as described in Materials and Methods.
Purification of Folded HS1S2 Under Nondenaturing Conditions.
HS1S2 in buffer E (1 mg/ml) was dialyzed against buffer G (100 volumes) overnight. The dialysis buffer was diluted stepwise with buffer H at 4°C over 2 days, thereby reducing the Gdn⋅HCl concentration to ∼60 mM. The folding mixture was centrifuged at 125,000 × g for 1 h and subsequently concentrated 10-fold. After filtration (0.22 μm), the solution was applied to a Superose 12 column (XK 26/100) in buffer C plus 10 mM glutamate and 1 mM DTT. The folded HS1S2 eluted as a single peak, and the monomeric aggregation state of the purified HS1S2 was confirmed by SEC using buffer C supplemented with 10 mM glutamate and 1 mM DTT.
Circular Dichroism (CD) and Estimation of Secondary Structure Composition.
CD spectra were measured at 15°C on a JASCO J-600 Spectropolarimeter equipped with a 0.5-mm path-length cuvette. The protein concentration was 1 mg/ml. The CD spectra of the denaturing (buffer E) or non-denaturing buffer (buffer C plus 10 mM glutamate and 1 mM DTT) were subtracted from the spectra of the respective protein solutions. The spectra were analyzed using k2d software (46, 47).
Reaction of HS1S2 with Thrombin and Trypsin.
For thrombin digestion, a mixture composed of thrombin cleavage buffer (Novagen, 10×, 7 μl), 2 μl of 0.2 M CaCl2, 30 μl of purified HS1S2 (∼1.2 mg/ml), 6 μl of thrombin (50 units/ml), and Milli-Q water (25 μl) was incubated at RT (2 h). For trypsin cleavage, the reaction proceeded in a solution made up of 21 μl of water, 3 μl of 0.1 M CaCl2, 45 μl of purified HS1S2, and 6 μl of trypsin (0.1 mg/ml) at RT for 40 min. Reactions were stopped with PMSF (1 μl of a 1 M stock) and analyzed by SDS/PAGE. Isolation of protein bands for amino-terminal sequencing was carried out as described (48).
[3H]AMPA Binding.
Purified HS1S2 (1 ml at 1 mg/ml) was dialyzed against buffer I (6 × 100 ml) at 4°C for 2 days, after which it was passed through a 0.22-μm filter. For [3H]AMPA saturation binding experiments, HS1S2 in buffer I (0.8 μg/ml) was incubated in a total volume of 500 μl with [3H]AMPA (10.6 Ci/mmol, 1–200 nM) on ice for 60 min. In the competition binding experiments, solutions composed of HS1S2 in buffer I (500 μl, 0.2 μg/ml), 10 nM [3H]AMPA (53 Ci/mmol), and glutamate (10−4–10−9 M) or kainate (10−3–10−8 M) were incubated on ice (60 min). The protein solutions were quickly filtered through wet GSWP 02500 membranes using a 12-place manifold. The membranes were washed with buffer I (2 × 3 ml), transferred into scintillation vials, scintillation fluid was added (ScintiVerse BD, 6 ml), and the radioactivity was counted. Nonspecific binding was determined in the presence of 1 mM glutamate in buffer I. Two parallel experiments were performed, and the mean values and standard errors were calculated. The experimental data were analyzed by nonlinear curve fitting (GraphPad Prism).
RESULTS
HS1S2 Expression and Purification.
Expression of HS1S2 under control of a T7 promoter resulted in the accumulation of HS1S2 as the major protein species in the form of inclusion bodies. Purification to ∼80% was achieved by simply washing the inclusion bodies with an aqueous solution supplemented with Triton X-100. Other contaminants were removed by dialyzing the inclusion bodies solubilized in 8 M Gdn⋅HCl against a solution containing 4 M Gdn⋅HCl, followed by centrifugation. Isolation of monomeric, denatured HS1S2 was achieved by SEC employing a buffer containing 4 M Gdn⋅HCl. By measuring the area under the peak from the SEC chromatogram, we estimated that 80–90% of HS1S2 was in a monomeric aggregation state in the 4 M Gdn⋅HCl SEC buffer before folding. The yield of monomeric HS1S2 was ∼100 mg/liter of culture, and the purity, following the SEC step in 4 M Gdn⋅HCl, was ∼90%.
Factorial and Systematic Search for HS1S2 Folding Conditions.
A fractional factorial resolution III folding screen was designed that included 12 factors, where each factor was assigned two levels (39). The factors were protein concentration, pH, ionic strength, divalent cation concentration, temperature, ionic additive, nonionic additive, presence of chaotrope, reducing/oxidizing reagents, detergent, ligand (glutamate), and PEG. The series of 16 solutions is a fractional factorial protein folding screen.
Following dialysis of 200-μl volumes of HS1S2 against each of the 16 folding conditions, each solution was clarified by centrifugation, and the resulting supernatants were analyzed by SDS/PAGE, HPLC SEC, and [3H]AMPA binding (Table 1 and Fig. 3). On the basis of the three assays, conditions 2, 13, and 15 yielded the largest amounts of (i) total soluble protein (aggregates and monomer), (ii) soluble monomer, and (iii) biologically active material. Other conditions resulted in the formation of significant amounts of soluble material, but the soluble protein was aggregated and did not bind AMPA. Condition 3, for example, resulted in significant soluble protein but virtually no monomer and no ligand binding activity. Using the unoptimized folding condition 2, we can obtain ∼20 mg of folded HS1S2 per liter of E. coli that is >95% pure, giving a ∼20% yield. The precipitated, denatured material can be dissolved in 8 M Gdn⋅HCl and subjected to additional rounds of folding, thus increasing the overall yield.
Figure 3.
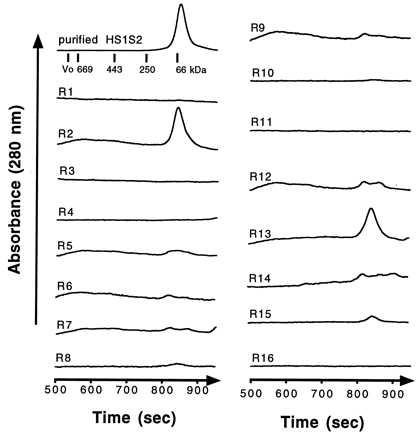
SEC traces for folded HS1S2 (upper left) and for the supernatant isolated from the 16 fractional factorial folding experiments. The numbers beside each trace correspond to the experiment numbers in Table 1. For all of the 16 runs, the detector sensitivity was the same and was not corrected for the 10-fold lower initial protein concentration in the 0.1 mg/ml folding experiments. The elution profile of protein standards is illustrated in the upper left corner.
Analysis of the[ 3H]AMPA binding data in the context of the folding screen allowed us to estimate the main effects of each factor. Inspection of a Pareto plot of scaled estimates (data not shown) indicated that temperature had the largest effect, with higher temperature having a strong negative effect. Indeed, the first condition is the only one where any significant ligand binding activity was observed from a folding experiment carried out at 20°C; all of the other conditions at 20°C did not yield protein with ligand binding activity (Table 1). Two other factors that had the next most significant effects were pH and detergent, with higher pH levels (8.5) and no added 1,2-diheptanoyl-sn-glycero-3-phosphocholine being favorable.
In contrast to the fractional factorial screen, a systematic or rational approach was designed for folding HS1S2. Conditions were chosen to minimize aggregation of the denatured protein and folding intermediates. Specifically, the Gdn⋅HCl concentration was gradually reduced by dialysis against a buffer that contained glycerol and arginine and successively lower concentrations of Gdn⋅HCl. The folding yield was ∼13%, based on integration of the monomer peak from the HPLC SEC chromatogram.
Aggregation State of HS1S2.
Following folding, HS1S2 formed a high molecular weight aggregate and a species of ∼40 kDa (Fig. 4A). Re-injection of the purified HS1S2 monomer, which has a calculated molecular mass of 38 kDa, onto the Superose 12 column gave a single peak at an elution volume corresponding to a ∼40-kDa protein, thus indicating that the monomeric stoichiometry is stable and the protein does not aggregate or assemble on a time scale of hours at concentrations ≤1 mg/ml. Higher concentrations have not yet been explored.
Figure 4.
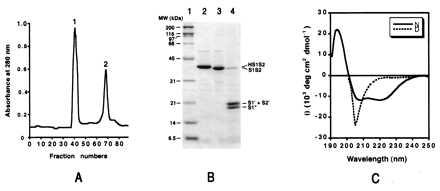
Characterization of HS1S2. (A) SEC of HS1S2, after folding, run on a Superose 12 column. Peak 1 corresponds to high molecular mass aggregates (>300 kDa), and peak 2 corresponds to the elution position of a ∼40-kDa species, i.e., the HS1S2 monomer. (B) Analysis by SDS/PAGE of HS1S2 (lane 2), HS1S2 treated with thrombin (lane 3), and HS1S2 incubated with trypsin (lane 4). Molecular weight markers are in lane 1. (C) CD spectra of HS1S2 under denaturing (D) and native (N) solution conditions.
Proteolytic Reactivity.
Thrombin digestion of the folded HS1S2 quantitatively cleaved at the desired site, resulting in formation of S1S2 (Fig. 4B, lane 3). Processing at the Arg-Gly thrombin site was confirmed by N-terminal amino acid sequencing. Incomplete cleavage under the same reaction conditions was observed when the protein was first denatured by heating at 100°C (data not shown).
Partial trypsin digestion of folded HS1S2 produced three bands and four major species, as determined by SDS/PAGE, Coomassie staining, and N-terminal amino acid sequencing. The species are S1S2, S1′, S2′, and S1" (Fig. 4B, lane 4). The S1" band had the same N-terminal amino acid sequence as S1S2 and S1′ (GSAMGSGNDTSGLEN …), whereas the S2′ band had a distinctly different N-terminal sequence (MVSPIESAEDLSKQT …) that is found at the beginning of the S2 segment. Although S1′ and S2′ comigrated by SDS/PAGE, the relative proportions of S1′ and S2′ were 24 and 76%, respectively, as determined by quantitative amino acid sequencing. Indeed, the calculated molecular weights of S1′ and S2′ were nearly identical, assuming that no additional proteolysis occurred. Because the S1" fragment has the same N-terminal sequence as S1S2 and S1′ but it migrated faster by SDS/PAGE, trypsin probably removed 10–20 C-terminal residues.
HS1S2 CD Spectra.
The CD spectra of HS1S2 in a nondenaturing buffer and in a denaturing buffer are shown in Fig. 4C. The CD spectra indicated that in aqueous buffer HS1S2 had a significant amount of secondary structure that was mostly denatured in a buffer containing 4 M Gdn⋅HCl. From the CD spectrum, the α-helical content was estimated at 35%. Because the CD spectra were not measured below 190 nm, estimations of the β-strand and random coil contents are not accurate and are not presented (49). Interestingly, the estimated α-helical content was similar to content of α-helix in glutamine binding protein from E. coli (50).
Ligand Binding Activity.
In the [3H]AMPA binding experiments, we used GSWP membranes that, in our hands, gave more reproducible data than the polyethylenimine-treated GF/B membranes used in previous studies (37, 51). Shown in Figs. 5, A and B, is the [3H]AMPA saturation binding and the competition binding of glutamate and kainate against [3H]AMPA. The Kd for AMPA (23 nM) and the IC50 values of glutamate (166 nM) and kainate (1.9 μM) are similar to the corresponding value for the S1S2 construct expressed in the periplasm of E. coli [AMPA Kd = 11 nM; glutamate IC50 = 370 nM; kainate IC50 = 3.3 μM (35)].
Figure 5.
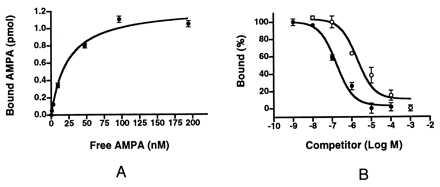
Ligand binding properties of HS1S2. (A) Shown is the saturation curve for binding of [3H]AMPA to HS1S2. The measured Kd is 23 nM. (B) Competition binding experiments of HS1S2, [3H]AMPA, and unlabeled l-glutamate (•) and kainate (○) yield IC50 values of 166 nM and 1.9 μM for l-glutamate and kainate, respectively.
DISCUSSION
Protein expression in E. coli offers many advantages that range from the ease and rapidity of genetic manipulation to the production of large quantities of material. However, expression of foreign genes, particularly those encoding eukaryotic water-soluble and membrane proteins, is complicated by the absence of eukaryotic-like posttranslational modification machinery and the frequent production of foreign proteins in insoluble or biologically inactive states. Since many biophysical studies are made possible by the availability of large amounts of pure protein, we have focused on designing strategies to recover folded and biologically active molecules from protein overexpressed in E. coli as insoluble inclusion bodies.
Overexpression of HS1S2 was obtained by transcription from pHS1S2, a modified T7 expression vector (pETGQ, unpublished results and ref. 52). The His8 tag not only allows for rapid purification, but it can also be employed for radioactive ligand binding experiments when combined with Ni-NTA resin (unpublished results). Following induction of expression by isopropyl-β-d-thiogalactoside, large quantities of HS1S2 accumulated in the cells as inclusion bodies. After washing and solubilization of the inclusion bodies, ample quantities of HS1S2 were available for folding studies.
Elucidation of folding conditions for HS1S2 involved two strategies. One approach employed a resolution III, fractional factorial screen composed of 12 factors and 16 experiments. The second strategy consisted of a rational, step-by-step approach in which folding conditions were chosen to minimize the aggregation of folding intermediates. The composition of the fractional factorial screen solutions that yielded a significant amount of AMPA binding material differed substantially from each other and from the single systematic folding condition. In light of the complexity of protein folding, fractional factorial screens may provide a useful tool to systematically explore a wide range of folding conditions, particularly because determination of folding conditions using a step-by-step process can be time consuming, as it was in this instance. Extension of fractional factorial folding screens to membrane proteins by the inclusion of detergents and phospholipids may provide an efficient means to search for folding of eukaryotic membrane proteins expressed in E. coli as inclusion bodies.
Reinforcing the conclusion that HS1S2 is folded from Gdn⋅HCl-solubilized inclusion bodies to a single, biologically relevant conformation are the observations that HS1S2 (i) is soluble in aqueous solution as a monomer, (ii) is selectively and uniformly digested by thrombin and trypsin, (iii) possesses substantial α secondary structure, and (iv) has a pharmacology that is very similar to the full-length receptor. Indeed, the ligand binding behavior of HS1S2 is similar to the S1S2 construct of Keinänen and coworkers (34, 35), which was expressed at much lower levels in insect cells or in the periplasm of E. coli. Even though the Kd for AMPA is about 2-fold higher and the IC50 values are about 2-fold lower for the HS1S2 construct in comparison with the S1S2 constructs previously characterized, the similarity of the HS1S2 parameters to values previously measured for the GluR2 ligand binding domain and the intact receptor nevertheless supports the conclusion that the HS1S2 construct is folded into a native conformation. The His8 tag may be one cause for the slightly different ligand binding properties of HS1S2.
Because the native HS1S2 is a monomer in aqueous solution up to concentrations of 1 mg/ml, as judged by SEC and analytical ultracentrifugation (unpublished results), and the full-length receptor is an oligomer (29), the S1S2 elements must not play a dominant role in oligomer formation. However, the S1 and S2 regions may still participate in key subunit-subunit contacts in the intact receptor.
The reactivity of HS1S2 to trypsinolysis is localized to the thrombin site and to sites flanking the 11-amino acid linker. This selective proteolysis at a few of the over 30 potential trypsin sites indicates that HS1S2 is folded into a compact, proteolytically resistant conformation with the exception of the regions flanking the S1-S2 linker and the thrombin site. The trypsin sites at the end of S1 and at the beginning of S2 support the notion that the membrane-associated regions 1, 2, and 3 protrude from the ligand binding domain (20, 28, 31), although the nonnative fusion of S1 and S2 via the 11-residue linker may, of course, give rise to proteolytic reactivity that is not representative of the full-length receptor. The proteolytic sensitivity near the putative membrane boundary at the end of S1 and at the beginning of S2, combined with the glycine-rich nature of the flip/flop region near the start of membrane segment 4, suggests that conformational flexibility may be important for the function of the intact receptor.
Acknowledgments
Drs. Hartley and Heinemann are acknowledged for providing the rat GluR2 clone. We also thank Drs. Karlin and Javitch, Drs. Palmer and Loria, Mr. Chris Kroenke, Dr. Hirsh, Dr. Pyle, and Dr. Thanos and their laboratories for helpful criticism, assistance, and equipment use. B. Ramachandran’s critical comments on the manuscript are very much appreciated. Support for this research was provided in part by a Searle Scholar Award, an NSF Young Investigator Award, and an Alfred P. Sloan Research Fellowship (E.G.).
ABBREVIATIONS
- iGluR
ionotropic glutamate receptor
- AMPA
α-amino-3-hydroxy-5-methylisoxazole-4-propionic acid
- SEC
size exclusion chromatography
- PMSF
phenylmethylsulfonyl fluoride
- Gdn⋅HCl
guanidine hydrochloride
- NMDA
N-methyl-d-aspartate
- KA
neurotoxin kainate
- RT
room temperature
References
- 1.Wo Z G, Oswald R E. Trends Neurosci. 1995;18:161–168. doi: 10.1016/0166-2236(95)93895-5. [DOI] [PubMed] [Google Scholar]
- 2.Mori H, Mishina M. Neuropharmacology. 1995;34:1219–1237. doi: 10.1016/0028-3908(95)00109-j. [DOI] [PubMed] [Google Scholar]
- 3.Hollmann M, Heinemann S. Annu Rev Neurosci. 1994;17:31–108. doi: 10.1146/annurev.ne.17.030194.000335. [DOI] [PubMed] [Google Scholar]
- 4.Nakanishi S, Masu M. Annu Rev Biophys Biomol Struct. 1994;23:319–348. doi: 10.1146/annurev.bb.23.060194.001535. [DOI] [PubMed] [Google Scholar]
- 5.Seeburg P H. Trends Neurosci. 1993;16:359–365. doi: 10.1016/0166-2236(93)90093-2. [DOI] [PubMed] [Google Scholar]
- 6.Collingridge G L, Lester R A J. Pharmacol Rev. 1989;40:143–210. [PubMed] [Google Scholar]
- 7.Beal M F. FASEB J. 1992;6:3338–3344. [PubMed] [Google Scholar]
- 8.Dingledine R, McBain C J, McNamara J O. Trends Pharmacol Sci. 1990;11:334–338. doi: 10.1016/0165-6147(90)90238-4. [DOI] [PubMed] [Google Scholar]
- 9.Watkins J C, Krogsgaard-Larsen P, Honoré T. Trends Pharmacol Sci. 1990;11:25–33. doi: 10.1016/0165-6147(90)90038-a. [DOI] [PubMed] [Google Scholar]
- 10.Donevan S D, Rogawski M A. Neuron. 1993;10:51–59. doi: 10.1016/0896-6273(93)90241-i. [DOI] [PubMed] [Google Scholar]
- 11.Zorumski C F, Yamada K A, Price M T, Olney J W. Neuron. 1993;10:61–67. doi: 10.1016/0896-6273(93)90242-j. [DOI] [PubMed] [Google Scholar]
- 12.Hume R I, Dingledine R, Heinemann S F. Science. 1991;253:1028–1031. doi: 10.1126/science.1653450. [DOI] [PubMed] [Google Scholar]
- 13.Verdoorn T A, Burnashev N, Monyer H, Seeburg P H, Sakmann B. Science. 1991;252:1715–1718. doi: 10.1126/science.1710829. [DOI] [PubMed] [Google Scholar]
- 14.Dingledine R, Hume R I, Heinemann S F. J Neurosci. 1992;12:4080–4087. doi: 10.1523/JNEUROSCI.12-10-04080.1992. [DOI] [PMC free article] [PubMed] [Google Scholar]
- 15.Blaschke M, Keller B U, Rivosecchi R, Hollmann M, Heinemann S, Konnerth A. Proc Natl Acad Sci USA. 1993;90:6528–6532. doi: 10.1073/pnas.90.14.6528. [DOI] [PMC free article] [PubMed] [Google Scholar]
- 16.Sommer B, Keinänen K, Verdoorn T A, Wisden W, Burnashev N, Herb A, Köhler M, Takagi T, Sakmann B, Seeburg P H. Science. 1990;249:1580–1585. doi: 10.1126/science.1699275. [DOI] [PubMed] [Google Scholar]
- 17.Lomeli H, Mosbacher J, Melcher T, Höger T, Geiger J R P, Kuner T, Monyer H, Higuchi M, Bach A, Seeburg P H. Science. 1994;266:1709–1713. doi: 10.1126/science.7992055. [DOI] [PubMed] [Google Scholar]
- 18.Uchino S, Sakimura K, Nagahari K, Mishina M. FEBS Lett. 1992;308:253–257. doi: 10.1016/0014-5793(92)81286-u. [DOI] [PubMed] [Google Scholar]
- 19.Kuryatov A, Laube B, Betz H, Kuhse J. Neuron. 1994;12:1291–1300. doi: 10.1016/0896-6273(94)90445-6. [DOI] [PubMed] [Google Scholar]
- 20.Stern-Bach Y, Bettler B, Hartley M, Sheppard P O, O’Hara P J, Heinemann S F. Neuron. 1994;13:1345–1357. doi: 10.1016/0896-6273(94)90420-0. [DOI] [PubMed] [Google Scholar]
- 21.Li F, Owens N, Verdoorn T A. Mol Pharmacol. 1995;47:148–154. [PubMed] [Google Scholar]
- 22.Partin K M, Bowie D, Mayer M L. Neuron. 1995;14:833–843. doi: 10.1016/0896-6273(95)90227-9. [DOI] [PubMed] [Google Scholar]
- 23.Sommer B, Köhler M, Sprengel R, Seeburg P H. Cell. 1991;67:11–19. doi: 10.1016/0092-8674(91)90568-j. [DOI] [PubMed] [Google Scholar]
- 24.Köhler M, Burnashev N, Sakmann B, Seeburg P H. Neuron. 1993;10:491–500. doi: 10.1016/0896-6273(93)90336-p. [DOI] [PubMed] [Google Scholar]
- 25.Wo Z G, Oswald R E. Proc Natl Acad Sci USA. 1994;91:7154–7158. doi: 10.1073/pnas.91.15.7154. [DOI] [PMC free article] [PubMed] [Google Scholar]
- 26.Hollmann M, Maron C, Heinemann S. Neuron. 1994;13:1331–1343. doi: 10.1016/0896-6273(94)90419-7. [DOI] [PubMed] [Google Scholar]
- 27.Bennett J A, Dingledine R. Neuron. 1995;14:373–384. doi: 10.1016/0896-6273(95)90293-7. [DOI] [PubMed] [Google Scholar]
- 28.O’Hara P J, Sheppard P O, Thøgersen H, Venezia D, Haldeman B A, McGrane V, Houamed K M, Thomsen C, Gilbert T L, Mulvihill E R. Neuron. 1993;11:41–52. doi: 10.1016/0896-6273(93)90269-w. [DOI] [PubMed] [Google Scholar]
- 29.Ferrer-Montiel A V, Montal M. Proc Natl Acad Sci USA. 1996;93:2741–2744. doi: 10.1073/pnas.93.7.2741. [DOI] [PMC free article] [PubMed] [Google Scholar]
- 30.Nakanishi N, Shneider N A, Axel R. Neuron. 1990;5:569–581. doi: 10.1016/0896-6273(90)90212-x. [DOI] [PMC free article] [PubMed] [Google Scholar]
- 31.Paas Y, Eisenstein M, Medevielle F, Teichberg V I, Devillers-Thiéry A. Neuron. 1996;17:979–990. doi: 10.1016/s0896-6273(00)80228-7. [DOI] [PubMed] [Google Scholar]
- 32.Mano I, Lamed Y, Teichberg V I. J Biol Chem. 1996;271:15299–15302. doi: 10.1074/jbc.271.26.15299. [DOI] [PubMed] [Google Scholar]
- 33.Wo Z G, Oswald R E. Mol Pharmacol. 1996;50:770–780. [PubMed] [Google Scholar]
- 34.Kuusinen A, Arvola M, Keinänen K. EMBO J. 1995;14:6327–6332. doi: 10.1002/j.1460-2075.1995.tb00323.x. [DOI] [PMC free article] [PubMed] [Google Scholar]
- 35.Arvola M, Keinänen K. J Biol Chem. 1996;271:15527–15532. doi: 10.1074/jbc.271.26.15527. [DOI] [PubMed] [Google Scholar]
- 36.Bettler B, Egebjerg J, Sharma G, Pecht G, Hermans-Borgmeyer I, Moll C, Stevens C F, Heinemann S. Neuron. 1992;8:257–265. doi: 10.1016/0896-6273(92)90292-l. [DOI] [PubMed] [Google Scholar]
- 37.Keinänen K, Köhr G, Seeburg P H, Laukkanen M-L, Oker-Blom C. Bio/Technology. 1994;12:802–806. doi: 10.1038/nbt0894-802. [DOI] [PubMed] [Google Scholar]
- 38.Kuusinen A, Arvola M, Oker-Blom C, Keinänen K. Eur J Biochem. 1995;233:720–726. doi: 10.1111/j.1432-1033.1995.720_3.x. [DOI] [PubMed] [Google Scholar]
- 39.Box G E P, Hunter W G, Hunter J S. Statistics for Experimenters. New York: Wiley; 1978. [Google Scholar]
- 40.Rudolph R, Lilie H. FASEB J. 1996;10:49–56. [PubMed] [Google Scholar]
- 41.Zardeneta G, Horowitz P M. Anal Biochem. 1994;223:1–6. doi: 10.1006/abio.1994.1537. [DOI] [PubMed] [Google Scholar]
- 42.Cole P A. Structure. 1996;4:239–242. doi: 10.1016/s0969-2126(96)00028-7. [DOI] [PubMed] [Google Scholar]
- 43.Guise A D, West S M, Chaudhuri J B. Mol Biotechnol. 1996;6:53–64. doi: 10.1007/BF02762323. [DOI] [PubMed] [Google Scholar]
- 44.Georgiou G, Valax P. Curr Opin Biotechnol. 1996;7:190–197. doi: 10.1016/s0958-1669(96)80012-7. [DOI] [PubMed] [Google Scholar]
- 45.Boulter J, Hollmann M, O’Shea-Greenfield A, Hartley M, Deneris E, Maron C, Heinemann S. Science. 1990;249:1033–1037. doi: 10.1126/science.2168579. [DOI] [PubMed] [Google Scholar]
- 46.Andrade M A, Chacón P, Merelo J J, Morán F. Protein Eng. 1993;6:383–390. doi: 10.1093/protein/6.4.383. [DOI] [PubMed] [Google Scholar]
- 47.Merelo J J, Andrade M A, Prieto A, Morán F. Neurocomputing. 1994;6:443–454. [Google Scholar]
- 48.Chen G-Q, Gouaux J E. Protein Sci. 1996;5:456–467. doi: 10.1002/pro.5560050307. [DOI] [PMC free article] [PubMed] [Google Scholar]
- 49.Johnson W C J. Proteins Struct Funct Genet. 1990;7:205–214. [Google Scholar]
- 50.Hsiao C-D, Sun Y-J, Rose J, Wang B-C. J Mol Biol. 1996;262:225–242. doi: 10.1006/jmbi.1996.0509. [DOI] [PubMed] [Google Scholar]
- 51.Bruns R F, Lawson-Wendling K, Pugsley T A. Anal Biochem. 1983;132:74–81. doi: 10.1016/0003-2697(83)90427-x. [DOI] [PubMed] [Google Scholar]
- 52.Studier F W, Rosenberg A H, Dunn J J, Dubendorff J W. Methods Enzymol. 1990;185:60–89. doi: 10.1016/0076-6879(90)85008-c. [DOI] [PubMed] [Google Scholar]