Abstract
An ink jet printer valve and nozzle were used to deliver matrix and sample from an electrophoresis capillary onto a MALDI plate. The system was evaluated by separation of a set of standard peptides. That separation generated up to 40,000 theoretical plates in less than three minutes. Detection limits were 500 amol using an ABI TOF-TOF instrument and 2 fmol for an ABI Q-TOF instrument. Over 70% coverage was obtained for the tryptic digest of α-lactalbumin in less than 2.5 minutes.
Keywords: capillary electrophoresis, MALDI, peptides
1. Introduction
Capillary electrophoresis has proven useful in the analysis of DNA sequencing fragments, proteins, carbohydrates, and lipids [1-7]. Capillary electrophoresis coupled with mass spectrometry detection is a particularly powerful tool for peptide analysis [2, 8]. Most commonly, electrospray ionization is used to interface capillary electrophoresis with mass spectrometry [9-10]. However, the very narrow electrophoresis peaks produced by capillary electrophoresis can challenge data-dependent mass analysis for electrospray ionization-mass spectrometry.
Capillary electrophoresis-mass spectrometry using a MALDI interface decouples the separation time from the mass analysis time, which can improve MS/MS analysis. Coupling capillary electrophoresis with MALDI is not straightforward. The volume of a capillary electrophoresis peak is several nanoliters. Deposition without producing excessive band-broadening or sample loss can be challenging. Several capillary electrophoresis-MALDI interfaces have been reported. These interfaces employ continuous deposition [11-12] or fraction deposition prior to mass spectrometry analysis [13-15]. A popular approach has been to utilize a sheath flow interface [16-19]. Additional designs have included electrocoupling [20], vacuum depostion [21], porous polymer joint [22], and rotating ball interfaces [23].
In this paper, we report an inexpensive CE-MALDI interface. Our design employs a drop on demand matrix sheath flow that is controlled by a high-speed ink jet printer valve. We demonstrate the rapid and efficient separation of three standard peptides and the analysis of a tryptic digestion of α-lactalbumin.
2 Experimental Section
2.1 Materials and Chemicals
Reagents were analytical grade and were purchased from Sigma-Aldrich (Saint Louis, MO). Capillaries were purchased from Polymicro Inc. (Phoenix, AZ). All buffers and samples were made from deionized and distilled water obtained from a Barnstead Nanopure System (ThermoFisher Scientific, Waltham, MA).
2.2 α-lactalbumin Digestion
α-lactalbumin and TPCK sequence grade trypsin (Pierce, Rockford, IL) were prepared in ammonium bicarbonate buffer, pH 9. They were mixed at an approximate ratio of 1:20 trypsin to α-lactalbumin and incubated for 24 hours at 37 °C. Upon completion, the digest was aliquoted and frozen at −80 °C until analysis by CE.
2.3 Mass Spectrometers
Samples were analyzed with an Applied Biosystems Proteome 4700 MALDI TOF/TOF equipped with a 200 Hz Nd:YAG laser. Samples were analyzed in positive, reflectron acquisition mode using an LC-MALDI method. Samples were also analyzed on an Applied Biosystems Q-Star XL Q-TOF equipped with a 1000 Hz Nd:YAG laser. Spectra were acquired with matrix solutions consisting of 10 mg/mL α-Cyano-4-hydroxycinnamic acid in 70% acetonitrile with 0.1% trifluoroacetic acid. The laser power was set to 3700 instrument units for TOF/TOF and 25% for QStar.
2.4 Interface
2.4.1 Overview of Instrument
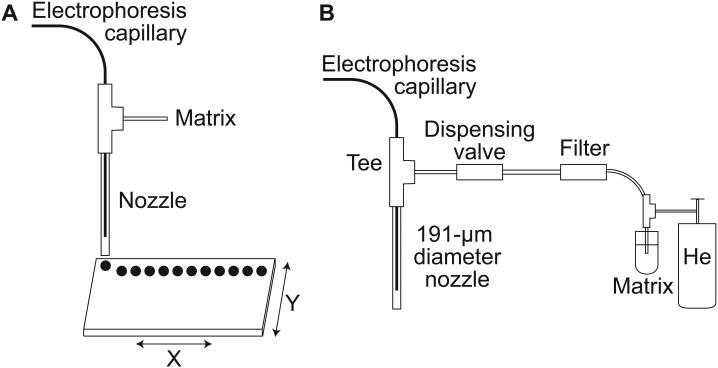
Figure 1 presents a diagram of the instrument. The injection block has been described in detail elsewhere [24]. MALDI plates were positioned and moved below the instrument using a microscope stage from Prior Scientific Inc. (Rockland, MA). Instrument control was written in Labview (National Instruments, Austin, TX). The Labview software integrated voltage, motion, and valve control. The stage was mounted to an aluminum breadboard by a customized Plexiglas block.
Figure 1.
A) Schematic of the CE-MALDI instrument. The distal end of the electrophoresis capillary is threaded through a Tee into a nozzle. B) Matrix is provided through the tee in pulses controlled by a dispensing valve. Drops are deposited onto a MALDI plate fixed to a microscope X-Y stage. The electrophoresis voltage, dispensing valve, and microscope stage are controlled by a PC.
2.4.2 High Speed Spotter
The distal end of the separation capillary was threaded into the spotter apparatus (Figure 1B) using a capillary sleeve and ferrule from Upchurch Scientific Inc. (Oak Harbor, WA). The valve (model INKX0514300A), tee (model TMMA3203950Z), nozzle (model INZA4670915K), 35 μm inline filter (model TCFA6202035A), and MINSTAC tubing connecting the matrix reservoir to the valve were purchased from The Lee Company (Westbrook, CT). Matrix was held under pressure using helium at ~600 kPa.
The nozzle used in this work had a 191 μm (0.0075”) inner diameter. The capillary was fed through the nozzle and positioned approximately 3-4 mm from its tip. An inline 35-μm filter was installed between the matrix reservoir and the valve inlet to reduce plugging of the nozzle.
The valve was powered by an electronic box that converted the 5 V signal generated by the Labview software to a 24 V signal to fire the valve. Software controlled both the position of the microscope stage and the firing of the valve.
2.4.3 MALDI Plate Treatment
Two different surfaces were employed. The TOF-TOF experiment employed an uncoated MALDI plate. The Q-TOF experiment used a layer of Parafilm to create a hydrophobic surface on the plate [25-26]. Parafilm M was cut into 6 cm squares. The Parafilm was stretched over the sides of the MALDI plate, giving particular care to ensure a uniform layer over the entire plate. It was important to coat the plates with Parafilm after they had been mounted onto the loading apparatus used for the ionization chambers of the mass spectrometers. Additionally, we used Scotch tape to cover any factory holes in the plates that would allow air to get between the Parafilm and plate surface.
2.5 Capillary electrophoresis
Capillaries were pre-conditioned for 5 minutes with H2O, NaOH, and buffer respectively. Injections were carried out at 2 kV for 2 sec. The capillaries used were 148/48 μm OD/ID with lengths of typically 30.5 cm. All separations were carried out at 20 kV. The separation buffer used was 10 mM ammonium bicarbonate pH 9.0. High voltage was applied to the injection end of the capillary; the spotter was held at ground potential.
3 Results and Discussion
3.1 Standard Peptide Separations
Angiotensin II (1046 amu), P14R synthetic peptide (1533 amu), and ACTH 18-39 fragment (2465 amu) were used as model peptides. A 20-μM mixture of the peptides was separated by capillary electrophoresis. Injection volume was about 1 nL and injection amount was 15 fmol. After a 60-s delay, fractions were deposited every 750 ms on a MALDI plate. The plate was analyzed using the 4700 Proteomic TOF/TOF MS.
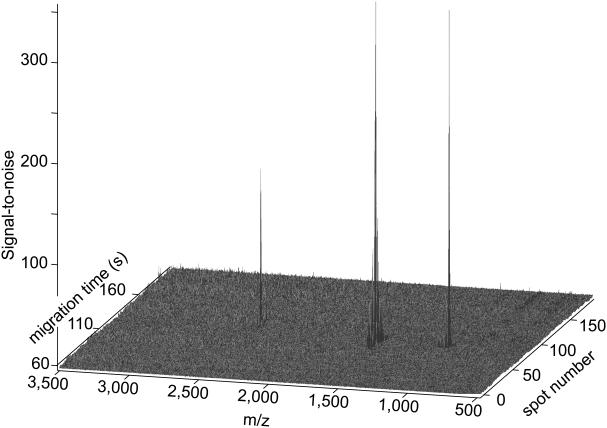
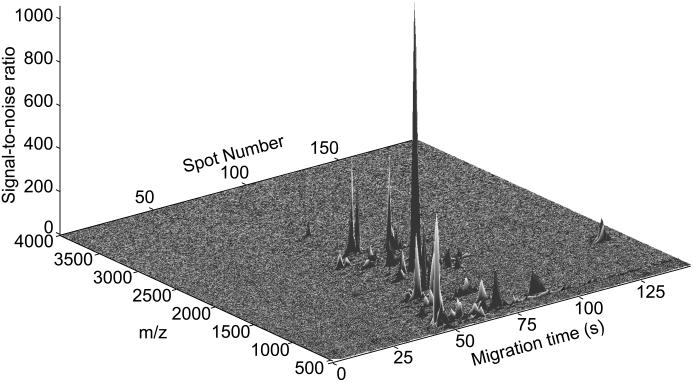
There are several ways to present the data. They can be presented as an amplitude plot. However, matrix peaks dominate such a plot. A more useful image results from presenting the signal-to-noise ratio for each spectrum, Figure 2. In this case, no analyte peaks were observed in the first 50 spots, and the intensity over those spots was used to determine both the median and standard deviation of the baseline at each m/z value. The signal-to-noise ratio was determined by subtracting the median of the baseline and dividing by the noise in the baseline at each m/z. In this way, noisy matrix peaks generate low signal-to-noise and do not obscure the analyte signal, which generate high signal-to-noise peaks.
Figure 2.
Signal-to-noise plot of data generated from three standard peptides. The spot number is given on the right and the migration time on the left. Amplitude is equal to the signal-to-noise ratio, where noise was defined as the standard deviation of the signal over the first 50 spots. Spot deposition began 60 seconds after the start of the electrophoretic separation
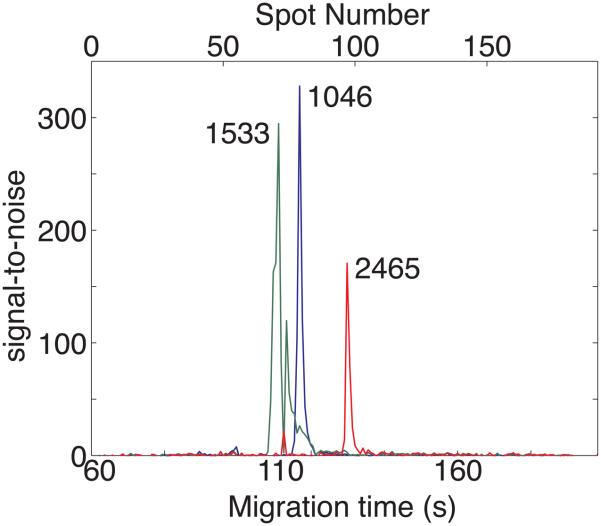
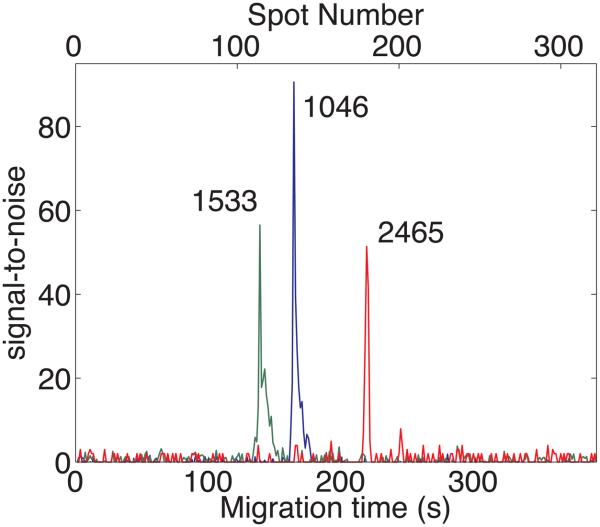
Figure 3 presents the amplitude traces at m/z = 1046.5, 1533.8, and 2465.2. The P14R synthetic peptide shows a main peak at 72.5 s, and a lower amplitude peak at 56.25 s; the main peak and satellite peak show identical mass spectra in the region m/z = 1,530 − 1,570.
Figure 3.
Signal-to-noise ratio for angiotensin II (1046, blue), P14R synthetic peptide (1533, green), and ACTH 18-39 fragment (2465, red) obtained with the TOF-TOF instrument.
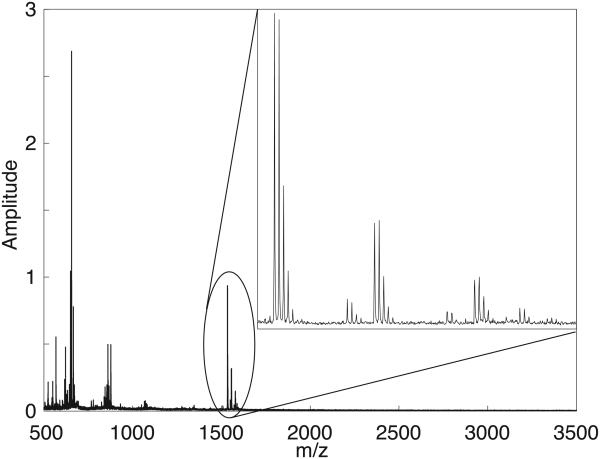
The mass spectrum of spot 70 is displayed in Figure 4. The singly ionized peptide, and the oxidation (+16), sodium (+22), and disodium (+44) adducts are observed in the close-up.
Figure 4.
Mass spectrum of spot 70, which contains P14R. Insert shows the spectrum from m/z = 1530-1600.
The 4700 Proteomic analyzer is equipped with LC-MALDI software that requires the matching of deposited drops with the pre-fabricated circles on the MALDI plates. Consequently, we were limited to only depositing 192 spots per experiment, which limited the separation to 2.5 minutes of total run time.
The Q-Star allows for custom plate generation that allows the user to define the numbers of rows and columns from a particular experiment. Figure 5 presents data generated with the Q-STAR. This separation employed a much lower drop generation rate (1.21 s/drop) and produced much better electrophoretic resolution than the TOF-TOF instrument.
Figure 5.
Signal-to-noise ratio for angiotensin II (1046, blue), P14R synthetic peptide (1533, green), and ACTH 18-39 fragment (2465, red) obtained with the Q-TOF instrument.
3.3 Limit of Detection/Theoretical Plates
Based on the signal-to-noise of figure 3, we calculated mass detection limits (3 s) of 500, 425, and 650 amol injected onto the capillary for angiotensin II, P14R synthetic peptide, and ACTH 18-39 on the TOF-TOF instrument. Concentration detection limits were 200 nM, 180 nM, and 270 nM for the same peptides. Plate counts were 20,000, 1,000, and 40,000 for the peptides. The poor separation efficiency for P14R synthetic peptide likely reflects contamination of that peptide, which resulted in two closely migrating components.
Detection limits were roughly a factor of four poorer for the Q-STAR instrument, likely the result of the Parafilm plate treatment.. Plate counts were similar for the two separations
3.4 Complex Sample Separation
A 1 mg/mL solution of α-lactalbumin was subjected to a 24 hour 37 °C trypsin digest. The digest was separated using capillary electrophoresis, and 192 spots were deposited. The plate was analyzed using the TOF-TOF instrument. Only matrix peaks were observed in the first 50 spots; analyte were observed in most of the remaining 142 spots.
Figure 6 presents the signal-to-noise plot for the separation. In some cases, the signal-to-noise ratio exceeded 1,000. All but the highest m/z tryptic peptide were observed, which resulted in 70% coverage. The vast majority of peaks were contained in a single spot.
Figure 6.
Signal-to-noise ratio of a tryptic digest of α-lactalbumin obtained with the TOF-TOF instrument.
3.5 Limitations of the instrument
Figure 6 highlights a limitation of the spotter. Only 192 spots were generated, and the first 50 spots contained no analyte. As a result, the system has a very narrow separation window. Improvements will come through use of larger plates with pre-structured features to collect spots. Bruker Daltonics provide a 1536 position pre-structured sample support, which would be very useful for this application. Alternatively, spots can be deposited on a continuous ribbon, which would provide essentially unlimited analysis time. In addition, spot deposition can be programmed to begin after a delay corresponding to the migration time of the fastest components.
In addition, the spot deposition rate does not capture the exquisite separation efficiency provided by capillary electrophoresis. We routinely obtain theoretical plate counts exceeding 105 and we have reported plate counts of 2 × 10⁶ for laser-induced fluorescence detection of proteins and amino acids [27]. Reconstruction of the highest resolution separations will require perhaps a five-fold increase in drop deposition rate. Of course, increasing the deposition rate decreases the separation time available on a conventional MALDI plate.
Acknowledgments
We gratefully acknowledge support from the National Institutes of Health (R01NS061767), the Center for Process Analytical Chemistry, and the Murdoch Foundation. CDW acknowledges support from an American Chemical Society, Division of Analytical Chemistry Graduate Fellowship, sponsored by the Society for Analytical Chemists of Pittsburgh. We thank the UW Chemistry machine shop and electronic shop for assistance in fabrication of the device. We thank Dr. Phil Mayer for guidance with the 4700 TOF/TOF and Dr. Martin Sadilek for help with the Q-Star.
Literature Cited
- 1.Swerdlow H, Zhang JZ, Chen DY, Harke HR, Grey R, Wu SL, Dovichi NJ, Fuller C. Anal. Chem. 1991;63:2835–2841. doi: 10.1021/ac00024a006. [DOI] [PubMed] [Google Scholar]
- 2.Tolmachev AV, Monroe ME, Purvine SO, Moore RJ, Jaitly N, Adkins JN, Anderson GA, Smith RD. Anal. Chem. 2008;80:8514–8525. doi: 10.1021/ac801376g. [DOI] [PMC free article] [PubMed] [Google Scholar]
- 3.Chan NW, Stangier K, Sherburne R, Taylor DE, Zhang Y, Dovichi NJ, Palcic MM. Glycobiology. 1995;7:683–8. doi: 10.1093/glycob/5.7.683. [DOI] [PubMed] [Google Scholar]
- 4.Zhang L, Hu S, Cook L, Dovichi NJ. Electrophoresis. 2002;23:3071–3077. doi: 10.1002/1522-2683(200209)23:17<3071::AID-ELPS3071>3.0.CO;2-K. [DOI] [PubMed] [Google Scholar]
- 5.Krylov SN, Dovichi NJ. Anal Chem. 2000;72:111R–128R. doi: 10.1021/a1000014c. [DOI] [PubMed] [Google Scholar]
- 6.Kraly J, Fazal MA, Schoenherr RM, Bonn R, Harwood MM, Turner E, Jones M, Dovichi NJ. Anal. Chem. 2006;78:4097–4110. doi: 10.1021/ac060704c. [DOI] [PubMed] [Google Scholar]
- 7.Kostal V, Katzenmeyer J, Arriaga EA. Anal. Chem. 2008;80:4533–4550. doi: 10.1021/ac8007384. [DOI] [PMC free article] [PubMed] [Google Scholar]
- 8.Fonslow BR, Yates JR. J Sep. Sci. 2009;32:1175–88. doi: 10.1002/jssc.200800592. [DOI] [PMC free article] [PubMed] [Google Scholar]
- 9.Smith RD, Barinaga CJ, Udseth HR. Anal. Chem. 1988;60:1948–1952. [Google Scholar]
- 10.Rejtar T, Hu P, Juhasz P, Campbell JM, Vestal ML, Preisler J, Karger BL. J Proteome Res. 2002;1:171–179. doi: 10.1021/pr015519o. [DOI] [PubMed] [Google Scholar]
- 11.Zhang H, Caprioli RM. J Mass Spectrom. 1996;31:1039–1046. doi: 10.1002/(SICI)1096-9888(199609)31:9<1039::AID-JMS398>3.0.CO;2-F. [DOI] [PubMed] [Google Scholar]
- 12.Johnson T, Bergquist J, Ekman R, Nordhoff E, Schurenberg M, Kloppel KD, Muller M, Lehrach H, Gobom J. Anal. Chem. 2001;73:1670–1675. doi: 10.1021/ac0011888. [DOI] [PubMed] [Google Scholar]
- 13.Page JS, Rubakhin SS, Sweedler JV. Analyst. 2000;125:555–562. [Google Scholar]
- 14.Busnel JM, Josserand J, Lion N, Girault HH. Anal. Chem. 2009;81:3867–3872. doi: 10.1021/ac900128q. [DOI] [PubMed] [Google Scholar]
- 15.Zuberovic A, Ullsten S, Hellman U, Markides KE, Bergquist J. Rapid Commun. Mass Spectrom. 2004;18:2946–2952. doi: 10.1002/rcm.1712. [DOI] [PubMed] [Google Scholar]
- 16.Lechner M, Seifner A, Rizzi AM. Electrophoresis. 2008;29:1974–1984. doi: 10.1002/elps.200700836. [DOI] [PubMed] [Google Scholar]
- 17.Chartogne A, Gaspari M, Jespersen S, Buscher B, Verheij E, Heijden Rv R, Tjaden U, van der Greef J. Rapid Commun. Mass Spectrom. 2002;16:201–207. doi: 10.1002/rcm.566. [DOI] [PubMed] [Google Scholar]
- 18.Page JS, Rubakhin SS, Sweedler JV. Anal. Chem. 2002;74:497–503. doi: 10.1021/ac0156621. [DOI] [PubMed] [Google Scholar]
- 19.Yu W, Li Y, Deng C, Zhang X. Electrophoresis. 2006;27:2100–2110. doi: 10.1002/elps.200500820. [DOI] [PubMed] [Google Scholar]
- 20.Ojima N, Shingaki T, Yamamoto T, Masujima T. Electrophoresis. 2001;22:3478–3482. doi: 10.1002/1522-2683(200109)22:16<3478::AID-ELPS3478>3.0.CO;2-X. [DOI] [PubMed] [Google Scholar]
- 21.Preisler J, Hu P, Rejtar T, Moskovets E, Karger BL. Anal. Chem. 2002;74:17–25. doi: 10.1021/ac010692p. [DOI] [PubMed] [Google Scholar]
- 22.Wang J, Ma M, Chen R, Li L. Anal. Chem. 2008;80:6168–6177. doi: 10.1021/ac800382t. [DOI] [PMC free article] [PubMed] [Google Scholar]
- 23.Musyimi HK, Narcisse DA, Zhang X, Stryjewski W, Soper SA, Murray KK. Anal. Chem. 2004;76:5968–5973. doi: 10.1021/ac0489723. [DOI] [PubMed] [Google Scholar]
- 24.Krylov SN, Starke DA, Arriaga EA, Zhang Z, Chan NW, Palcic MM, Dovichi NJ. Anal. Chem. 2000;72:872–877. doi: 10.1021/ac991096m. [DOI] [PubMed] [Google Scholar]
- 25.Owen SJ, Meier FS, Brombacher S, Volmer DA. Rapid Commun. Mass Spectrom. 2003;17:2439–2449. doi: 10.1002/rcm.1210. [DOI] [PubMed] [Google Scholar]
- 26.Wang J, Chen R, Ma M, Li L. Anal. Chem. 2008;80:491–500. doi: 10.1021/ac701614f. [DOI] [PubMed] [Google Scholar]
- 27.Cheng YF, Wu SL, Chen DY, Dovichi NJ. Anal. Chem. 1990;62:496–503. [Google Scholar]


