Abstract
To evaluate the antiretroviral activity of antiretroviral agents and to compare the effects of two different antiretroviral agents, we propose a nonparametric mixed-effects model to investigate change of CD4+ counts. The proposed model and methods are applied to analyze the data from PACTG345 study. Population and individual patterns of change of CD4+ counts and a reference band are obtained. Our results indicate that treatment with high-dose ritonavir is significantly superior compared to low-dose ritonavir.
1 Introduction
In studies of the effect of highly active antiretroviral therapy (HAART) in the treatment of HIV infection, the risk of progression to AIDS and patients' clinical condition have often been indicated by immunologic markers such as CD4+ cell count1,2. This marker plays an important role in evaluating antiviral therapy in clinical HIV research. A commonly used method for studying response to treatment is the survival analysis3,4,5, for which censorship is defined when CD4+ cell counts are below a specified value6. Advantages of the survival analysis method include the ease of implementation using well-developed software, and intuitive interpretation of results: the longer the survival of patient, the better the treatment. Recently, joint modeling strategy has been used to study the relationship between survival and CD4+ counts7,8,9. The use of HAART to treat HIV infection can remarkably reduce viral replication, increase CD4+ T-lymphocyte counts, delay disease progression, and turn HIV infection as a chronic disease, which challenges survival analysis methods because this measurement sometimes provides no useful information. Two obvious cases are when (i) two treatments fail at the same time, or (ii) two treatments are both successful on the basis of failure time. Similar concerns have been discussed elsewhere10. In this article we propose a flexible model to study the common feature of antiviral activity, taking individualization into account, and to compare the antiretroviral effects between two different treatments. The comparison results may prove one treatment to be applicable to later large-scale studies. Our measure of response is the change over time in CD4+ cell count from baseline; i.e., current CD4+ count subtracting baseline CD4+ counts.
In a typical AIDS clinical study, the CD4+ response is often used to assess the immunologic response of anti-HIV treatment11,12. For example, if the CD4+ response declines, the treatment may be thought to be a failure, while increases in CD4+ response are normally considered signs of therapy success13. The difference in CD4+ responses based on different antiretroviral treatments may be used to compare the antiretroviral activity of the treatments. Appropriately analyzing CD4+ response is therefore helpful for AIDS drug development and for monitoring individual patients with AIDS.
2 Model and Methods
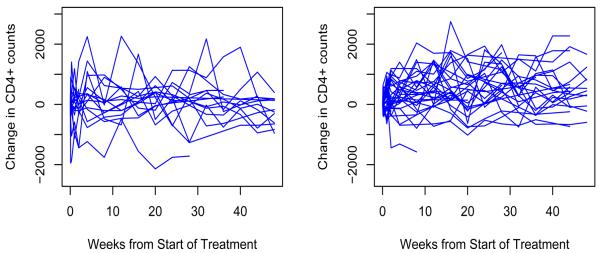
PACTG 34514,15 was designed to assess potential age-related differences in the pharmacokinetics, safety and tolerance of ritonavir in combination with ZDV and 3TC in HIV-1 infected infants and children; to ascertain the dose of ritonavir which may be suitable for Phase II/III evaluation of ritonavir in combination with 3TCIM + ZDV in HIV-1; and to evaluate the antiretroviral activity and the immunological effect of multiple doses of ritonavir administered in combination therapy. Seventeen patients in group 1 were treated with a combination of ritonavir 350mg/m2, ZDV 160mg/m2, 3TC 4mg/kg and thirty one patients in group 2 were treated with a combination of ritonavir 450mg/m2, ZDV 160mg/m2, 3TC 4mg/kg. Specimens were obtained on days 0, 1, 3, and 7 and weeks 2, 4, 8, 12, 16, 20, 24, 28, 32, 36, 40, 44, 48, etc. We consider the 48 week treatment period, and have 569 observations among the 48 patients. Changes in CD4+ counts are presented in Figure 1, in which the left and right panels represent the changes of CD4+ counts of individual patients from groups 1 and 2, respectively. Figure 1 shows that CD4+ responses within either group exhibit a large between-subject variation.
Figure 1.
Profile of the changes of CD4+ counts from the PACTG 345 study. Left: group 1; right: group 2.
The aims of this article include (i) providing a common feature of the antiviral activity of each of the two treatments, taking individualization into account; and (ii) comparing the antiretroviral effects between the two different treatments.
2.1 Model
Nonparametric regression has been used to fit longitudinal data when the data cannot be analyzed by traditional parametric models. The aims of nonparametric regression analysis include the exploration of curves for a particular population and for individual characteristics within a mixed-effects framework. Shi, Weiss, and Taylor17 and Rice and Wu18 proposed the following nonparametric mixed-effects model for longitudinal data:
| (1) |
where η(t) models the common feature, also called the fixed-effect or population curve; vi(t) models individual variations from η(t); εi(t) are measurement errors; and yi(t) are response processes. The vi(t) and εi(t) are assumed to be independent. vi(t) can be regarded as realizations of a zero-mean process with a covariance function γ(s, t) = E{vi(s)vi(t)}, and εi(t) can be regarded as realizations of an uncorrelated zero-mean process with a variance function σ2(t). Let tij, for j = 1, ⋯, ni, be the design time points for the ith individual, then model (1) becomes
| (2) |
where n is the number of subjects and ni is the number of measurements taken from subject i. For convenience, we denote yij as being equal to yi(tij) and εij as being equal to εi(tij).
We are concerned with the population curve η(t), and individual curves si(t) = η(t) + vi(t), for i = 1, 2, …, n. The mean function η(t) is important because it reflects the overall trend or progress of an underlying population process and can be used as an important index for the population response to a drug or a treatment in a clinical study. The estimation of si(t) is also important, because it reflects individual response to a treatment in a study. A good estimate of si(t) may help investigators make a better decision about individual treatment. The estimates of individual curves si(t) are also useful if investigators wish to group or classify the subjects on the basis of individual curves. A similar modeling approach was used to analyze CD4 counts8,16.
2.2 Estimation method
The unknown functions η(t) and vi(t) in model (1) can be estimated using kernel smoothing19-22, of which the main idea is to locally approximate a nonparametric function by a polynomial of some degree using Taylor expansion. Wu and Zhang20 recently gave a comprehensive survey of nonparametric regression methods for longitudinal data analysis. In this paper we apply local linear smoothing to estimate η(t) and vi(t). Specifically, let t be an arbitrary fixed time point where the functions η(t) and vi(t) will be estimated. Assume that η(t) and vi(t) have second continuous derivatives. By Taylor expansion, η(t) and vi(t) at tij are approximated by second order polynomials within a neighborhood of t. That is,
where Xij = (1, tij − t)T, β = {η(t), η′(t)}T, . It follows that, within a neighborhood of t, model (1) can be approximated by a linear mixed-effects (LME) model:
| (3) |
where ∊i = (∊i1, …, ∊ini)T ~ (0, Ri) is a vector of measurement errors, and bi ~ (0, D) is a vector of random effects, and . Let Xi = (Xi1, …, Xini)T and yi = (yi1, yi2, ⋯, yini)T. Model (3) can be expressed as
| (4) |
Note that for a fixed t, model (4) is a standard LME model, for which, if D and Ri are known, the estimates of β and bi can be obtained by minimizing the objective function23,
where the first term is a weighted residual, and the term is a penalty resulting from the random effects. To consider the local approximation error of model (4), we propose the estimators of β and bi that minimize the objective function,
| (5) |
where Kih = diag{Kh(ti1 − t), …, Kh(tini − t)}, Kh(u) = h−1K(h−1u), and K(·) is a kernel function and h is a bandwidth.
For given D and Ri, to solve the minimization problem (5) is equivalent to solving the mixed model equation23:
where X = (X1, ⋯, Xn)T, y = (y1, ⋯, yn)T, Z = diag(X1, ⋯, Xn), b = (b1, ⋯, bn)T, D = diag(D, ⋯, D), and ϴh = diag(ϴ1h, ⋯, ϴnh) with . The corresponding estimators can be expressed as
where , . This procedure is a combination of local likelihood method and linear mixed-effects modeling23. To obtain the estimators described above by using existing software, one may operationally fit a standard LME model,
where are regarded as the new responses, and are covariates for the fixed-effect and random-effect parameters, respectively.
In general, D and Ri are unknown, but can be estimated using maximum likelihood or restricted maximum likelihood, implemented by EM algorithm or Newton-Raphson method23.
As a consequence, the estimates of η(t) and vi(t) can be obtained as follows.
2.3 Comparison of two curves
Let η̂1(t) and η̂2(t) be the estimates of the population curves of groups 1 and 2. The standard error of the difference of the population estimates is defined as
where se1(t) and se2(t) are the standard errors of the η̂1(t) and η̂2(t), respectively. A reference band of the width of two standard errors, centered at the average of the two estimated curves, is roughly used to determine whether there is difference between the two groups. If the two curves are encapsulated in the reference band, then they are regarded to be not significantly different. This idea is similar in spirit to that proposed by Young and Bowman24 for cross-sectional data.
3 Data Analysis
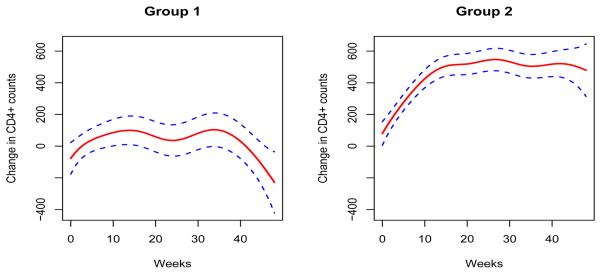
We apply the model and methods described in the previous section to explore the data from PACTG 345 study. Our focus is on (i) presenting a common feature of antiretroviral activity of each of the different treatments; and (ii) comparing the antiretroviral effects of two different treatments to obtain evidence that one treatment may be superior to another one. We use the quartic kernel, K(u) = 15/16(1 − u2)2I(|u|≤1), for local regression, and the leave-one-point-out and leave-one-subject-out cross-validation criteria21 for bandwidth selection, and implement the estimation procedure by using the well-developed Splus function nlme25. The population curves (solid lines) reflecting the common change of CD4+ counts over time with the associated confidence intervals (dotted lines) are shown in Figure 2, are also presented. The population curve for group 1 maintains a horizontal trend before 34 weeks and a flat decline after 34 weeks. In contrast, the population curve for group 2 maintains a steady increase until week 15 and remains flat to week 48. This finding would suggest that the antiretroviral activity in group 2 is biologically superior to that in group 1.
Figure 2.
Estimates of the population curves (solid lines) and the corresponding confidence intervals (dotted lines), equaling to the estimated values ±2 standard errors.
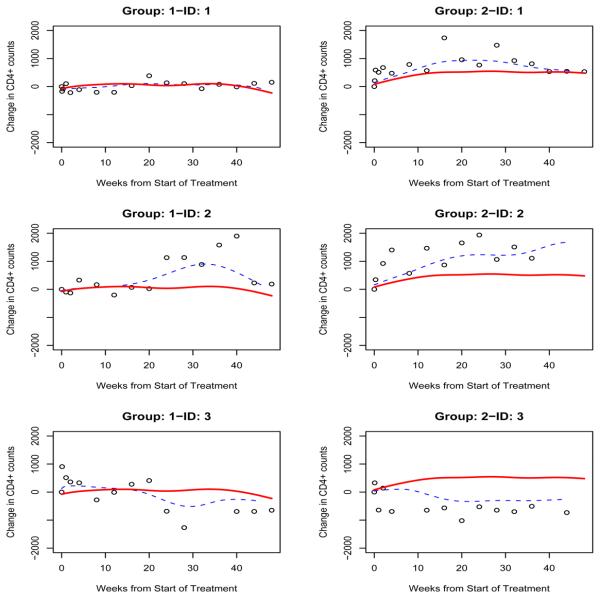
Recalling the scatterplot of each individual given in Figure 1, one may note that the between-subject variation is non-ignorable and the individual patterns may not follow the pattern of the population curve. The trajectories of the change in CD4+ counts over time for 3 individual patients from each group is presented in Figure 3. The population and individual curves are indicated by solid and dotted lines respectively, and the changes in CD4+ counts based on observed data are indicated by circles. For these patients, the population and individual curves are different not only in magnitude but even in pattern. For each patient, the estimated individual curve, although not perfect, is closer to the observed change in CD4+ count than the overall population curve. In group 1, the 3 individual patient curves are similar to the population curve at the beginning of treatment, and the individual curve of patient 1 keeps following the population curve. However, the individual curve of patient 2 takes an upward direction, while that of patient 3 takes a downward direction. These findings indicate that the antiretroviral activity of patient 1 is similar to that of the population, while the antiretroviral activity of patient 2 is greater than that of the population, whereas the antiretroviral activity of patient 3 is lower than that of the population. In group 2, the individual curve of patient 1 basically follows the population curve, while the individual curves of patients 2 and 3 deviate from the population curve in two different directions. Based on these three individual curves, we can draw a similar conclusion to the patients in group 1. Given the large between-subject variation, the estimated individual trajectories therefore provide more useful information than do the population trajectories. This highlights the principal advantage of the mixed-effects model, and has implication for individualizing treatment management of AIDS patients.
Figure 3.
Estimated values of the change in CD4+ counts for 6 patients. The solid and dotted lines are the estimated population and individual curves respectively. The change in CD4+ counts based on observed data are indicated by circles. Left: group 1; right: group 2.
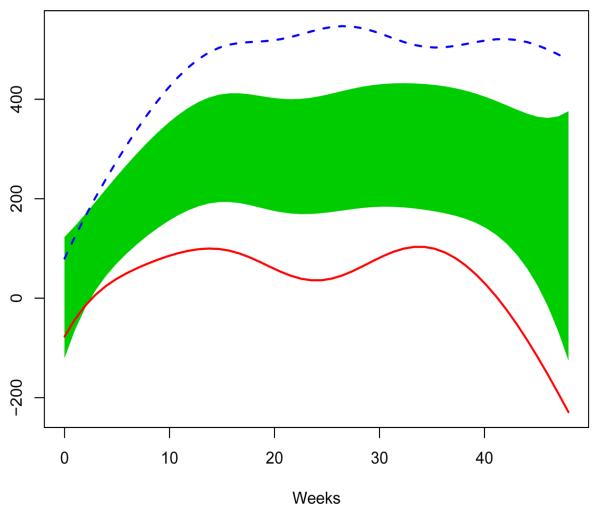
Figure 2 has shown that the treatment for group 2 seems to be better than that for group 1. We now justify that this superiority is statistically significant. For this data set, a reference band is obtained by using the method in section 2.3. The reference band and two population curves are depicted in Figure 4. The population curves for groups 1 and 2 deviate from the reference band substantially, and the treatment for the group 2 is almost significantly superior to that for group 1.
Figure 4.
Population curves for group 1 (solid line) and group 2 (broken line) and the reference band (shaded area).
4 Discussion
To analyze a data set from an AIDS clinical trial, we propose a nonparametric mixed-effects model to estimate the population and individual curves of the change in CD4+ counts over time. The flexibility of the model in that the model can appropriately capture the feature of the CD4+ response to antiretroviral therapy, which may beyond the capability of parametric models. The population curve delineates a common feature of the antiretroviral activity. By introducing the mixed-effects structure to consider the between-subject and within-subject information, we also gain particular features of the antiretroviral activity in individual patients. To compare the antiretroviral activities of two treatment agents, we propose a novel approach by comparing two population curves. The comparison principle is intuitive. Our findings indicates that the treatment activity with high-dose ritonavir is more effective than that with low-dose ritonavir. The superiority of the treatment for group 2 is reflected by the fact that the common change in CD4 + counts is almost consistently larger than that for group 1.
In conclusion, the model is flexible and the structure is parsimonious. The method is very straightforward and robust in implementation, and intuitive in understanding. This model-fitting approach may have methodologically and biologically valuable. An Splus program has been developed for implementing the proposed methods, and the program is available upon request.
In this paper we use a local linear technique to fit the nonparametric mixed-effects model. One may use alternative methods including higher degree local polynomial kernel methods, smoothing and regression splines, and so on.
Acknowledgements
The author is grateful to the Editor and one referee for their helpful suggestions. This research was partially supported by NIH/NIAID grants AI62247 and AI59773.
References
- 1.Feinberg MB, Kaplan JE, et al. Supplement to Morbidity and Mortality Weekly Report 47 (RR-5) U.S. Department of Health and Human Services, Center for Disease Control and Prevention (CDC); Atlanta, Georgia: 1999. Report of the NIH panel to define principles of therapy of HIV infection. [Google Scholar]
- 2.Stanley SK, Kaplan JE, et al. Supplement to Morbidity and Mortality Weekly Report 47 (RR-5) U.S. Department of Health and Human Services, Center for Disease Control and Prevention (CDC); Atlanta, Georgia: 1998. Guidelines for the use of antiretroviral agents in HIV-infected adults and adolescents. [Google Scholar]
- 3.Gottlieb GS, Nickle DC, Jensen MA, Wong KG, et al. Dual HIV-1 infection associated with rapid disease progression. The Lancet. 2004;363:619–22. doi: 10.1016/S0140-6736(04)15596-7. [DOI] [PubMed] [Google Scholar]
- 4.Taylor JM, Kim DK. Marker values at the time of an AIDS diagnosis. Statistics in Medicine. 1994;13:2059–66. doi: 10.1002/sim.4780131915. [DOI] [PubMed] [Google Scholar]
- 5.Pezzotti P, Galai N, Vlahov D, Rezza G, et al. Direct comparison of time to AIDS and infectious disease death between HIV seroconverter injection drug users in Italy and the United States: results from the ALIVE and ISS studies. JAIDS. 1999;20:275–82. doi: 10.1097/00042560-199903010-00010. [DOI] [PubMed] [Google Scholar]
- 6.Ullum H, Lepri AC, Aladdin H, Katzenstein T, et al. Natural immunity and HIV disease progression. AIDS. 1999;13:557–63. doi: 10.1097/00002030-199904010-00004. [DOI] [PubMed] [Google Scholar]
- 7.Tsiatis AA, DeGruttola V, Wulfsohn MS. Modeling the relationship of survival to longitudinal data measured with error. Applications to survival and CD4 counts in patients with AIDS. Journal of the American Statistical Association. 1995;90:27–37. [Google Scholar]
- 8.Henderson R, Diggle P, Dobson A. Joint modelling of longitudinal measurements and event time data. Biostatistics. 2000;1:465–80. doi: 10.1093/biostatistics/1.4.465. [DOI] [PubMed] [Google Scholar]
- 9.Thiébaut R, Jacqmin-Gadda H, Babiker A, Commenges D, et al. Joint modelling of bivariate longitudinal data with informative dropout and left-censoring, with application to the evolution of CD4+ cell count and HIV RNA viral load in response to treatment of HIV infection. Statistics in Medicine. 2005;24:65–82. doi: 10.1002/sim.1923. [DOI] [PubMed] [Google Scholar]
- 10.HIV Surrogate Marker Collab Human immunodeficiency virus type 1 RNA level and CD4 count as prognostic markers and surrogate end points: a meta-analysis. AIDS Res Hum Retroviruses. 2000;16:1123–33. doi: 10.1089/088922200414965. [DOI] [PubMed] [Google Scholar]
- 11.Dromer F, Mathoulin-Pélissier S, Fontante A, Ronin O, et al. Epidemiology of HIV-associated cryptococcosis in France (19852001): comparison of the pre- and post- HAART eras. AIDS. 2004;18:555–62. doi: 10.1097/00002030-200402200-00024. [DOI] [PubMed] [Google Scholar]
- 12.Bensona CA, van der Horstb C, LaMarcac A, Haasd AW, et al. A randomized study of emtricitabine and lamivudine in stably suppressed patients with HIV. AIDS. 2004;18:2269–76. doi: 10.1097/00002030-200411190-00007. [DOI] [PubMed] [Google Scholar]
- 13.DeSimone JA, Pomerantz RJ, Babinchak TJ. Inflammatory reactions in HIV-1-infected persons after initiation of highly active antiretroviral therapy. Annals of Internal Medicine. 2000;133:447–54. doi: 10.7326/0003-4819-133-6-200009190-00013. [DOI] [PubMed] [Google Scholar]
- 14.Scott ZA, Chadwick EG, Gibson LL, et al. Infrequent detection of HIV-1-specific, but not cytomegalovirus-specific, CD8+T cell responses in young HIV-1-infected infants. Journal of Immunology. 2001;167:7134–40. doi: 10.4049/jimmunol.167.12.7134. [DOI] [PubMed] [Google Scholar]
- 15.Chadwick EG, Palumbo P, Rodman J, Luzuriaga K, et al. Early therapy with ritonavir (RTV), ZDV and 3TC in HIV-1 infected children 1-24 months of age; The 8th conference on retro-viruses and opportunistic infections; Chicago, IL. February 2001. [Google Scholar]
- 16.Taylor JMG, Cumberland WG, Sy JP. A stochastic model for analysis of longitudinal AIDS data. Journal of the American Statistical Association. 1994;89:727–36. [Google Scholar]
- 17.Shi MG, Weiss RE, Taylor JMG. An analysis of pediatric CD4 counts for acquired immune deficiency syndrome using flexible random curves. Applied Statistics. 1996;45:151–63. [Google Scholar]
- 18.Rice JA, Wu CO. Nonparametric mixed effects models for unequally sampled noisy curves. Biometrics. 2001;57:253–9. doi: 10.1111/j.0006-341x.2001.00253.x. [DOI] [PubMed] [Google Scholar]
- 19.Fan JQ, Gijbels I. Local Polynomial Modelling and Its Applications. Chapman and Hall; New York: 1996. [Google Scholar]
- 20.Wu HL, Zhang JT. Local polynomial mixed-effects models for longitudinal data. Journal of the American Statistical Association. 2002;97:883–97. [Google Scholar]
- 21.Wu HL, Zhang JT. Nonparametric Regression Methods for Longitudinal Data Analysis. John Wiley & Sons; New Jersey: 2006. [Google Scholar]
- 22.Wu HL, Liang H. Backfitting random varying-coefficient models with time-dependent smoothing covariates. Scandinavian Journal of Statistics. 2004;31:3–19. [Google Scholar]
- 23.Davidian M, Giltinan DM. Nonlinear Models for Repeated Measurement Data. Chapman & Hall; New York: 1995. [Google Scholar]
- 24.Young SG, Bowman AW. Non-parametric analysis of covariance. Biometrics. 1995;51:920–31. [Google Scholar]
- 25.Pinheiro JC, Bates DM. Mixed-Effects Models in S and S-PLUS. Springer; New York: 2000. [Google Scholar]


