

Abstract
Recent studies suggest that anthocyanidins play a pivotal role in the chemopreventive effects of fruits and vegetables. However, the underlying molecular mechanisms and targets remain unknown. Neoplastic transformation of cells and inflammation are considered to be major events contributing to carcinogenesis. Here we report that delphinidin, a major dietary anthocyanidin, inhibits tumor-promoter-induced transformation and cyclooxygenase-2 (COX-2) expression in JB6 promotion-sensitive mouse skin epidermal (JB6 P+) cells by directly targeting Raf and MEK. Delphinidin inhibited 12-O-tetradecanoylphorbol-13-acetate (TPA)-induced neoplastic transformation and COX-2 expression at both the protein and transcriptional levels. The activation of AP-1 (activator protein-1) and NF-κB (nuclear factor-κB) induced by TPA was dose-dependently inhibited by delphinidin treatment. Kinase assays and Western blot data revealed that delphinidin strongly inhibited Raf1 and MEK1 kinase activities and subsequently attenuated TPA-induced phosphorylation of MEK, ERK, p90RSK, and MSK. Although delphinidin suppressed ERK and JNK activities, it was more effective at inhibiting Raf1 or MEK1 activities. Pull-down and competition assays revealed that delphinidin binds with Raf1 or MEK1 noncompetitively with ATP. Delphinidin also dose-dependently suppressed JB6 P+ cell transformation induced by epidermal growth factor and H-Ras, both of which are known to be involved in the activation of Raf/MEK/ERK signaling. Together these findings suggested that the targeted inhibition of Raf1 and MEK activities and COX-2 expression by delphinidin contribute to the chemopreventive potential of fruits and vegetables.
Keywords: Delphinidin, Raf1, MEK1, cell transformation, chemoprevention
Neoplastic transformation of cells is one of the major events that occur during the carcinogenic process. Accumulating evidence supports a strong link between inflammation and carcinogenesis (1, 2). Cyclooxygenase-2 (COX-2) expression and its product prostaglandin E2 (PGE2) have been linked to enhanced carcinogenesis, particularly skin cancer (3, 4). Moreover, tumor promoters such as 12-O-tetradecanoylphorbol-13-acetate (TPA), epidermal growth factor (EGF), and ultraviolet (UV) irradiation, induce COX-2 protein expression in the epidermis of the skin and also in epidermal keratinocytes (5). Previous studies demonstrating that COX-2 inhibitors suppress neoplastic transformation suggest that COX-2 overexpression is one of the mechanisms underlying the induction of neoplastic transformation (6, 7). Therefore, inhibiting neoplastic transformation and COX-2 expression might be an effective strategy for delaying carcinogenesis.
Activator protein (AP)-1 and nuclear factor (NF)-κB act as pivotal transcription factors involved in neoplastic transformation and cancer development (7-10), and are regulated by signaling pathways, including the mitogen-activated protein kinase (MAPK) cascades. MAPKs are commonly upregulated in various cancer cell types, and are known to be involved in cell transformation and proliferation (11). Among the components of the MAPK pathways, the MAPK kinase kinase (e.g., Raf)/MAPK kinase (MEK)/extracellular-signal-regulated kinase (ERK) cascade has been the focus of cancer chemotherapy because of its relevance in carcinogenesis. Various tumor promoters including TPA and EGF are known to induce transformation in various cell lines through the activation of the Raf/MEK/ERK pathway (8, 12, 13). This pathway was also identified as a key downstream effector of Ras, an oncogene that is mutated in 30% or more of human cancers (14, 15). The Raf/MEK/ERK pathway plays a critical role in linking extracellular signals associated with Ras activation to nuclear transcription events (16). Because aberrant activation of ERK was demonstrated in various tumor types (17, 18), the targeted downregulation of ERK through inhibition of upstream kinases such as Raf or MEK appears to be an effective method for intervening in carcinogenesis.
Epidemiological studies suggest that a high consumption of fruits and vegetables can reduce the risk of cancer. Anthocyanins are naturally occurring polyphenolic compounds that provide intense color to fruits and vegetables such as berries, red grapes, purple sweet potato and red cabbages (19). Previous studies showed that anthocyanidins scavenge reactive oxygen species and suppress cell proliferation and migration, tumor cell invasion, and angiogenesis (20-22). Delphinidin, a representative dietary anthocyanidin, was shown to exert the strongest antitumor-promoting effects among the anthocyanidins tested, including delphinidin, cyanidin, petunidin, pelargonidin, peonidin, and malvidin, in the TPA-promoted cell transformation of JB6 promotion-sensitive mouse skin epidermal (JB6 P+) cells (23) (Fig. 1A). However, the molecular mechanisms and specific targets of the antitumorigenic effects of delphinidin remain unknown. The present study aimed to identify the molecular mechanisms and direct targets of the antitumorigenic effects of delphinidin in tumor-promoter-induced neoplastic cell transformation. Here we report that delphinidin is a potent inhibitor of Raf1 and MEK1 kinases. The inhibition of Raf1 and MEK1 corresponded with a suppression of the phosphorylation of ERK, p90 ribosomal s6 kinase (p90RSK), and mitogen- and stress-activated protein kinase (MSK), and the suppression of AP-1 and NF-κB activation, which subsequently resulted in an inhibition of neoplastic transformation and decreased COX-2 expression.
Fig. 1.

Effects of delphinidin on TPA-induced neoplastic transformation of JB6 P+ cells. A, Chemical structure of delphinidin. B, Antiproliferative effects of delphinidin on JB6 P+ cells. JB6 P+ cells were treated with delphinidin (0–40 μM) or its vehicle, DMSO (< 0.1%, as a negative control), in 5% FBS/MEM for the indicated time period. The proliferation of cells was determined by the MTT assay as described in “Materials and Methods”. Data are presented as mean and S.D. values from three independent experiments. The asterisk (*) indicates a significant difference (p < 0.01) compared to untreated control. C, Delphinidin inhibits TPA-induced cell transformation. JB6 P+ cells were treated as described in “Materials and Methods”, and colonies were counted 14 days later: (a) untreated control; (b) TPA alone; (c) TPA and 5 μM delphinidin; (d) TPA and 10 μM delphinidin; (e) TPA and 20 μM delphinidin; and (f) TPA and 40 μM delphinidin. D, Cell colonies were counted under a microscope with the aid of Image-Pro Plus software (v4). The effects of delphinidin on cell transformation of JB6 P+ cells are shown as the percent inhibition of cell transformation in soft agar by delphinidin relative to TPA-only stimulated cells. Data are presented as mean and S.D. values from three independent experiments. The asterisk (*) indicates a significant difference (p < 0.01) between groups treated with TPA and delphinidin and the group exposed to TPA alone.
Materials and Methods
Chemicals
Delphinidin was purchased from Indofine Chemical (Hillsborough, NJ) and EGF, TPA, 3-[4,5-Dimethylthiazol-2-yl]-2,5-diphenyl tetrazolium bromide (MTT), and dimethyl sulfoxide (DMSO) were from Sigma/Aldrich (St. Louis, MO). Eagle's minimum essential medium (MEM), basal medium Eagle (BME), gentamicin, and L-glutamine were from GIBCO BRL (Carlsbad, CA), and fetal bovine serum (FBS) was from Gemini Bio-Products (Calabasas, CA). The antibodies against phosphorylated MEK (Ser217/221), phosphorylated ERK (Thr202/Tyr204), total ERK, p90RSK, phosphorylated MSK (Thr581), and total MSK were from Cell Signal Biotechnology (Beverly, MA). The antibodies against total MEK, Raf1, and COX-2 were from Santa Cruz Biotechnology (Santa Cruz, CA). The Raf1, MEK1, ERK2, and JNK1 kinase assay kits were obtained from Upstate Biotechnology (Lake Placid, NY). CNBr–Sepharose 4B, glutathione–Sepharose 4B, [γ-32P]ATP, and a chemiluminescence detection kit were from Amersham Pharmacia Biotech (Piscataway, NJ), and the protein assay kit was from Bio-Rad Laboratories (Hercules, CA). A prostaglandin E2 (PGE2) enzyme immunoassay kit was from Cayman Chemical (Ann Arbor, MI) and the cDNA cycle kit, G418, and the luciferase assay substrate were purchased from Promega (Madison, WI). TRIZOL reagent was from Invitrogen (Carlsbad, CA).
Cell culture
JB6 P+ cells and H-Ras-transformed JB6 P+ mouse epidermal (H-Ras JB6 P+) cells were cultured in monolayers at 37°C in a 5% CO2 incubator in MEM containing 5% FBS, 2 mM L-glutamine, and 25 μg/ml gentamicin. JB6 P+ cells stably transfected with a COX-2 luciferase reporter plasmid were a kind gift from Dr. Chauanshu Huang (School of Medicine, NYU). JB6 P+ cells were stably transfected with a COX-2, AP-1, or NF-κB luciferase reporter plasmid, and maintained in 5% FBS/MEM and 200 μg/ml G418.
Cell viability assay
Cell viability was measured using the MTT assay. Briefly, JB6 P+ cells (1×10⁴) were seeded into 96-well plates and cultured for 6 h. The cells were treated with delphinidin at various concentrations (0-40 μM). The cells were cultured for different times at 37°C, followed by incubation with MTT for 4 h. The optical density of each well was measured at 570 nm using an ELISA reader (Emax, Molecular Devices, CA) at 24 h intervals up to 120 h.
Anchorage-independent cell transformation assay
The effects of delphinidin on H-Ras-induced cell transformation or TPA- or EGF-induced cell transformation in JB6 cells were investigated. JB6 (exposed to TPA or EGF) or H-Ras JB6 cells (8×10³/ml) were treated or not treated with delphinidin in 1 ml of 0.33% BME agar containing 10% FBS or in 3.5 ml of 0.5% BME agar containing 10% FBS. The separate cultures were maintained at 37°C in a 5% CO2 incubator for 14 days, at which time the numbers of cell colonies were counted under a microscope with the aid of the Image-Pro Plus software program (v. 4, Media Cybernetics, Silver Spring, MD).
PGE2 assay
JB6 P+ cells (1.5×10⁶) were plated in 6-well dishes and grown to 80% confluence. The cells were then exposed to 20 ng/ml TPA in the absence or presence of delphinidin for 16 h. The amounts of PGE2 released into the medium were measured using the PGE2 enzyme immunoassay kit.
RT-PCR
Reverse transcriptase (RT)-PCR was performed in accordance with the instructions provided by Promega. In brief, TRIZOL reagent was used to extract total RNA from cells, and RT-PCR was performed with a cDNA cycle kit. The sense and antisense primers for COX-2 mRNA were 5′-TGT TCT TGT AAC ATG ACA CTT AC-3′ and 5′-GAA GTC CTA TGT CTT GAC CTC ATC A-3′, respectively, which yielded a 448-bp PCR product. The amplification conditions for COX-2 were 40 cycles of 95°C for 90 s, 63°C for 90 s, and 72°C for 150 s, followed by 1 cycle for 10 min at 72°C. The sense and antisense primers for GAPDH mRNA were 5′-GGT GAA GGT CGG TGT GAA CGG ATT T-3′ and 5′-AAT GCC AAA GTT GTC ATG GAT GAC C-3′, respectively, which yielded a 448-bp PCR product with 40 cycles of 94°C for 90 s, 54°C for 90 s, and 72°C for 150 s.
Luciferase assays for COX-2 promoter activity and AP-1 and NF-κB transcription activities
Confluent monolayers of JB6 P+ cells stably transfected with a COX-2, AP-1, or NF-κB luciferase reporter plasmid were trypsinized, and cells (8×10³) suspended in 100 μl of 5% FBS/MEM were added to each well of a 96-well plate. Plates were incubated at 37°C in a 5% CO2 incubator. At 80–90% confluence, cells were starved by culturing them in 0.1% FBS/MEM for 24 h. The cells were then treated with delphinidin for 30 min and then exposed to 20 ng/ml TPA for an additional 24 h to assess COX-2 activity or 12 h to determine AP-1 or NF-κB activities. After treatment, cells were disrupted with 100 μl of lysis buffer [0.1 M potassium phosphate buffer (pH 7.8), 1% Triton X-100, 1 mM dithiothreitol (DTT), and 2 mM EDTA], and the luciferase activity was measured using a luminometer (Microlumat Plus LB 96V, Berthold Technologies, Bad Wildbach, Germany).
Reporter gene assay for c-fos promoter activity
The reporter gene assay for firefly luciferase activity was performed using lysates from transfected cells. In addition, the reporter gene vector pRL-SV40 (Promega) was co-transfected into each cell line, with the transfection efficiencies normalized to the Renilla luciferase activity generated by this vector. Cell lysates were prepared by first washing the transfected JB6 P+ cells once in phosphate-buffered saline (PBS) at 37°C. After removing the PBS completely, 500 μl of passive lysis buffer (Promega Dual Luciferase Reporter Assay System) was added, and the cells were incubated for 1 h with gentle shaking. The lysate was then transferred to a reaction tube and the cellular debris was removed by centrifugation. The supernatant fraction was used to measure the firefly and Renilla luciferase activities. Cell lysates (20 μl each) were mixed with 100 μl of Luciferase Assay II reagent, and the emitted firefly luciferase light was measured (Luminoskan Ascent, Thermo Electron, Helsinki, Finland). Subsequently, the coelenterazine reagent (100 μl) containing the substrate for the emission of Renilla luciferase light was added for normalizing the firefly luciferase data. The c-fos luciferase promoter (pFos-WT GL3) and constructs were kindly provided by Dr. Ron Prywes (Columbia University, New York, NY).
Western blot analysis
After the cells (1.5×10⁶) were cultured in a 10-cm dish for 48 h, they were starved in serum-free medium for an additional 24 h. The cells were then treated with delphinidin at concentrations from 0 to 20 μM for the indicated durations before being exposed to 20 ng/ml TPA for another 30 min. Cells were disrupted, and the supernatant fractions were boiled for 5 min. The protein concentration was determined using a dye-binding protein assay kit (Bio-Rad Laboratories) as described in the manufacturer's manual. Lysate protein (20 μg) was subjected to 10% sodium dodecyl sulfate–polyacrylamide gel electrophoresis (SDS-PAGE) and then transferred to a polyvinylidene fluoride (PVDF) membrane. After blocking, the membrane was incubated with the appropriate specific primary antibody at 4°C overnight. Protein bands were visualized by a chemiluminescence detection kit after hybridization with the appropriate horseradish-peroxidase-conjugated secondary antibody. The relative amounts of proteins associated with specific antibodies were quantified using Scion Image (NIH, Bethesda, MD).
In vitro MEK1, Raf1, ERK2, and JNK1 kinase assays
The in vitro kinase assays were performed in accordance with the instructions provided by Upstate Biotechnology. Briefly, each reaction contained 20μl of assay dilution buffer [20 mM MOPS (pH 7.2), 25 mM β-glycerol phosphate, 5 mM EGTA, 1 mM sodium orthovanadate (Na3VO4), and 1 mM DTT] and a magnesium-ATP cocktail buffer. For MEK1, 1 μg of inactive ERK2 substrate peptide was included; for Raf1, 0.4 μg of inactive MEK substrate peptide and 1 μg of inactive ERK2 substrate peptide were included; and for ERK2, 0.33 mg/ml MBP substrate peptide was included. A 4-μl aliquot was removed after the reaction mixture had incubated at 30°C for 30 min, to which 20 μg of the MBP substrate peptide and 10 μl of diluted [γ-32P]ATP solution were added. This mixture was incubated for 10 min at 30°C, and then 25-μl aliquots were transferred onto p81 filter paper and washed 3 times with 0.75% phosphoric acid for 5 min per wash and once with acetone for 2 min. For JNK1, the activating transcription factor-2 (ATF2) substrate peptide was included at 3 μM. An active JNK1 protein (20 ng) and 10 μl of diluted [γ-32P]ATP solution were incubated at 30°C for 10 min with the above assay buffer and substrate peptide, and then 15-μl aliquots were transferred onto p81 paper and washed 3 times with 0.75% phosphoric acid for 5 min and once with acetone for 5 min. The radioactive incorporation was determined using a scintillation counter (LS6500, Beckman Coulter, Fullerton, CA). Each experiment was performed 3 times.
Ex vivo Raf1 and MEK1 immunoprecipitation and kinase assays
JB6 P+ cells were cultured to 80% confluence and then starved in 0.1% FBS/MEM for 24 h at 37°C. Cells were treated or not treated with delphinidin for 1 h, and then exposed to 20 ng/ml TPA for 30 min, disrupted with lysis buffer [20 mM Tris-HCl (pH 7.4), 1 mM EDTA, 150 mM NaCl, 1 mM EGTA, 1% Triton X-100, 1 mM β-glycerophosphate, 1 mg/ml leupeptin, 1 mM Na3VO4, and 1 mM phenylmethylsulfonyl fluoride (PMSF)], and centrifuged at 14,000 rpm for 10 min in a microcentrifuge. The lysates (500 μg protein each) were used for immunoprecipitation with an antibody against Raf1 or MEK1 and then incubated at 4°C overnight. Protein A/G Plus agarose beads were then added, and the mixture was continuously rotated for an additional 3 h at 4°C. The beads were washed 3 times with kinase buffer [20 mM MOPS (pH 7.2), 25 mM β-glycerol phosphate, 5 mM EGTA, 1 mM Na3VO4, and 1 mM DTT], and then resuspended in 20 μl of 1×kinase buffer supplemented with 1 μg of inactive ERK2 (for MEK1) or 0.4 μg of inactive MEK1 and 1 μg of inactive ERK2 (for Raf1) and incubated for an additional 30 min at 30°C. MBP (20 μg) and 10 μl of diluted [γ-32P]ATP solution were then added, and the mixture was incubated for 10 min at 30°C. A 20-μl aliquot was transferred onto p81 paper and washed 3 times with 0.75% phosphoric acid for 5 min/wash and once with acetone for 2 min. The radioactive incorporation was determined using a scintillation counter. Each experiment was performed 3 times.
In vitro and ex vivo pull-down assays
Recombinant Raf1 (or MEK1) (2 μg) or a JB6 P+ cellular supernatant fraction (500 μg protein) was incubated with delphinidin/Sepharose 4B beads (100 μl, 50% slurry) or Sepharose 4B beads (as a control) in reaction buffer [50 mM Tris-HCl, (pH 7.5), 5 mM EDTA, 150 mM NaCl, 1 mM DTT, 0.01% Nonidet P-40, 2 μg/ml bovine serum albumin, 0.02 mM PMSF, and 1× protease inhibitor mixture]. After incubation with gentle rocking overnight at 4°C, the beads were washed 5 times with buffer [50 mM Tris-HCl (pH 7.5), 5 mM EDTA, 150 mM NaCl, 1 mM DTT, 0.01% Nonidet P-40, and 0.02 mM PMSF], and proteins bound to the beads were analyzed by immunoblotting.
ATP and delphinidin competition assay
Recombinant Raf1 (or MEK1) (0.2 μg) was incubated with 100 μl of delphinidin/Sepharose 4B or 100 μl of Sepharose 4B in a reaction buffer (see in vitro and ex vivo pull-down assays) for 12 h at 4°C; and ATP was added at either 10 or 100 μM to a final volume of 500 μl and incubated for 30 min. The samples were washed and then proteins were detected by Western blotting.
Molecular modeling
Insight II (Accelrys, San Diego, CA) was used for the docking study and structure analysis with the crystal coordinates of MEK1 (accession code 1S9J) and B-Raf (accession code 1UWH) available in the Protein Data Bank (http://www.rcsb.org/pdb/).
Statistical analysis
As necessary, data are presented as mean and S.D. values, and the Student's t test was used for single statistical comparisons. A probability value of p < 0.01 was used as the criterion for statistical significance.
Results
Delphinidin inhibits TPA-induced transformation of JB6 P+ cells
Delphinidin had no effect on the proliferation of JB6 P+ cells when applied at concentrations from 0 to 20 μM at 1, 3, or 5 days after treatment (Fig. 1B). TPA is a typical tumor promoter that has been shown to induce two-stage skin carcinogenesis and potently stimulate COX-2 expression in various cell lines (24, 25). That treatment with delphinidin markedly inhibited TPA-promoted transformation of JB6 P+ cells in a dose-dependent manner (Fig. 1C) and at 10 μM inhibited TPA-induced neoplastic transformation by 43% (Fig. 1D).
Delphinidin suppresses TPA-induced COX-2 expression and PGE2 generation in JB6 P+ cells
Delphinidin at 5–20 μM inhibited TPA-induced COX-2 expression in JB6 P+ cells (Fig. 2A). The production of PGE2 peaked at 16 h following exposure to TPA (data not shown), and delphinidin suppressed the TPA-induced PGE2 production (Fig. 2B). Delphinidin attenuated TPA-induced COX-2 expression at the mRNA level (Fig. 2C) and also suppressed TPA-induced COX-2 promoter activity in a dose-dependent manner in JB6 P+ cells stably transfected with a COX-2 luciferase plasmid (Fig. 2D). These results indicated that delphinidin could effectively repress TPA-induced COX-2 expression and PGE2 production in JB6 P+ cells.
Fig. 2.

Effects of delphinidin on TPA-induced COX-2 expression, PGE2 production, mRNA expression, and COX-2 promoter activity in JB6 P+ cells. A, Delphinidin downregulates TPA-induced COX-2 expression in JB6 P+ cells. JB6 P+ cells were treated for 30 min with delphinidin at the indicated concentrations (0, 5, 10, 20 μM) before being exposed to TPA for an additional 4 h. Cells were lysed, and the expression of COX-2 was analyzed by a Western blot assay as described in “Materials and Methods”. B, Delphinidin inhibits TPA-induced production of PGE2 in JB6 P+ cells. JB6 P+ cells were pretreated with delphinidin at the indicated concentrations (0, 10, 20 μM) for 30 min before incubation with TPA for 16 h. PGE2 generation was determined by a PGE2 assay kit as described in “Materials and Methods”. The asterisk (*) indicates a significant difference (p < 0.01) between groups treated with TPA and delphinidin and the group exposed to TPA alone. C, Delphinidin inhibits TPA-induced COX-2 mRNA expression in JB6 P+ cells. Cells were treated for 2 h with TPA alone or together with delphinidin at the indicated concentrations (0, 10, 20 μM). The COX-2 mRNA level was determined by RT-PCR as described in “Materials and Methods”. Data are representative of two independent experiments. D, Delphinidin inhibits TPA-induced COX-2 promoter activity in JB6 P+ cells. JB6 P+ cells, which were stably transfected with COX-2 luciferase reporter plasmids, were pretreated with delphinidin for 30 min at the indicated concentrations (0, 5, 10, 20 μM) before being exposed to TPA for 24 h. The relative COX-2 activity was measured by a luciferase assay as described in “Materials and Methods”. The asterisk (*) indicates a significant difference (p < 0.01) between groups treated with TPA and delphinidin and the group exposed to TPA alone.
Delphinidin suppresses TPA-induced AP-1 and NF-κB transactivation and c-fos promoter activity in JB6 P+ cells
We next measured AP-1 transactivation using JB6 P+ cells stably transfected with an AP-1 luciferase reporter plasmid. Consistent with the above results for cell transformation and COX-2 expression, delphinidin inhibited TPA-induced transactivation of AP-1 (Fig. 3A) and NF-κB (Fig. 3B) in a dose-dependent manner. Because TPA induces c-fos expression mainly through the ERK signaling pathway and subsequently induces AP-1 transactivation, we next investigated whether delphinidin could inhibit c-fos promoter activation using the reporter plasmid carrying the luc gene under the control of the c-fos promoter. Results indicated that delphinidin attenuated TPA-induced c-fos promoter activity (Fig. 3C), These results indicated that delphinidin could effectively suppress AP-1 and NF-κB transactivation and c-fos promoter activity in JB6 P+ cells, which may contribute to delphinidin's antitumor-promoting and anti-inflammatory activities.
Fig. 3.

Effects of delphinidin on TPA-induced AP-1 and NF-κB transactivation and c-fos promoter activity in JB6 P+ cells. A and B, Delphinidin inhibits TPA-induced AP-1 (A) and NF-κB (B) transactivation. The JB6 P+ cells, which were stably transfected with an AP-1 or NF-κB luciferase reporter plasmid, were pretreated with delphinidin for 1 h at the indicated concentrations (0, 5, 10, 20 μM) before being exposed to TPA for 24 h. The relative activity was measured by a luciferase assay as described in “Materials and Methods”. Data are presented as mean and S.D. values of the AP-1 and NF-κB luciferase activities from three independent experiments. For A and B, the asterisk (*) indicates a significant difference (p < 0.01) between groups treated with TPA and delphinidin and the group exposed to TPA alone. C, Delphinidin suppresses TPA-induced c-fos promoter activity. For the reporter-gene assay, JB6 P+ cells were transfected with a plasmid mixture containing the c-fos luciferase reporter gene (0.5 μg) and the pRL-SV40 gene (0.5 μg). At 24 h after transfection, cells were starved for 24 h by incubation in 0.1% FBS/MEM at 37°C in a 5% CO2 atmosphere. Cells were then treated with delphinidin at the indicated concentrations (0, 5, 10, 20 μM) for 1 h before being exposed to TPA for 12 h. Firefly luciferase activity was determined in cell lysates and normalized to Renilla luciferase activity, and c-fos luciferase activity is expressed relative to control cells not exposed to TPA. Data are presented as mean and S.D. values of the c-fos luciferase activity from three independent experiments. The asterisk (*) indicates a significant difference (p < 0.01) between groups treated with TPA and delphinidin and the group exposed to TPA alone.
Delphinidin inhibits TPA-induced phosphorylation of MEK, ERK, p90RSK, and MSK in JB6 P+ cells
We next found that delphinidin inhibited TPA-induced phosphorylation of MEK, and also strongly suppressed the phosphorylation of the MEK downstream kinases, including ERK, p90RSK, and MSK (Fig. 4A). These results suggested that the inhibition of the ERK pathways by delphinidin leads to the suppression of AP-1 and NF-κB activity, resulting in decreased neoplastic transformation.
Fig. 4.

The TPA-stimulated Raf/MEK/ERK/p90RSK/MSK signaling cascade is downregulated by delphinidin through the direct inhibition of both Raf1 and MEK1 activities. A, Delphinidin inhibits TPA-induced phosphorylation of MEK, ERK, p90RSK, and MSK in JB6 P+ cells. JB6 P+ cells were treated with delphinidin (0, 10, 20 μM) for 1 h before being exposed to TPA for an additional 15 min. The cells were lysed, and the levels of phosphorylated and total MEK, ERK, p90RSK, and MSK proteins were determined by Western blot analysis as described in “Materials and Methods” using specific antibodies against the respective phosphorylated and total proteins. Data are representative of three independent experiments that gave similar results. B and C, Delphinidin inhibits Raf1 or MEK1 activities more than ERK2 or JNK1 activities in vitro. In vitro Raf1, MEK1, ERK2, and JNK1 kinase assays were performed as described in “Materials and Methods”, and the kinase activity is expressed as the percent inhibition by delphinidin relative to the activity of untreated Raf1, MEK1, ERK2, or JNK1 control. D, Delphinidin inhibits Raf1 and MEK1 activities ex vivo. For the ex vivo MEK1 and Raf1 kinase assays, cells were pretreated with delphinidin at the indicated concentrations (0, 10, 20, 40 μM) for 1 h before being exposed to TPA for 30 min. Cells were harvested, and immunoprecipitation and ex vivo Raf1 and MEK1 kinase assays were performed. The kinase activity is expressed as the percent inhibition by delphinidin relative to cells exposed to TPA only. The data are presented as mean and S.D. values of the 32P count from three separate experiments. For in vitro kinase assays, the asterisk (*) indicates a significant decrease (p < 0.01) in kinase activity between the groups treated with active Raf1 (or MEK1, ERK2, or JNK1) and delphinidin together and the group containing active Raf1 (or MEK1, ERK2, or JNK1) alone. For ex vivo kinase assays, the asterisk (*) indicates a significant decrease (p < 0.01) in kinase activity between groups treated with TPA and delphinidin together and the groups exposed to TPA alone.
Delphinidin inhibits Raf1 and MEK1 activities more strongly compared to its inhibition of ERK2 and JNK1 activities
Because the ERK signaling pathway was strongly blocked by delphinidin, we investigated the effects of delphinidin on the kinase activities of Raf1 and MEK1, upstream kinases of ERK. Kinase assay data revealed that delphinidin strongly suppressed Raf1 and MEK1 activities in vitro (Fig. 4B). Delphinidin at 10 μM blocked Raf1 and MEK1 activities by 67.2% and 64.3%, respectively, but either had no significant effect or only slightly inhibited ERK2 or JNK1 activities (Fig. 4C). Consistent with results from an in vitro kinase assay, an ex vivo kinase assay revealed that delphinidin inhibited TPA-induced Raf1 and MEK1 activities in JB6 P+ cells (Fig. 4D). These results indicated that the inhibition of cell transformation and COX-2 expression by delphinidin was mainly attributable to the suppression of Raf1 or MEK1 activities and to a lesser extent to the inhibition of ERK or JNK activities.
Delphinidin directly binds with Raf1 or MEK1 noncompetitively with ATP
Because delphinidin can inhibit Raf1 or MEK1 activity, we determined whether delphinidin directly interacts with Raf1 or MEK1. In an in vitro pull-down assay, Raf1 and MEK1 were found in the delphinidin/Sepharose 4B beads but not in Sepharose 4B beads (Fig. 5A). We also found ex vivo binding between delphinidin and Raf1 or MEK1 in JB6 P+ cell lysates (Fig. 5B). Competition data revealed that ATP did not compete with delphinidin for binding with Raf1 or MEK1 (Fig. 5C). These results indicated that delphinidin interacts with Raf1 or MEK1, and results in downregulation of their respective kinase activities.
Fig. 5.

Delphinidin specifically binds with Raf1 or MEK1 noncompetitively with ATP. A, Binding of Raf1 or MEK1 with delphinidin in vitro was confirmed by immunoblotting using antibodies against Raf1 (left panel) or MEK1 (right panel): lane 1 (input control)–Raf1 and MEK1 protein standards; lane 2 (control)–Sepharose 4B was used to pull down Raf1 or MEK1 as described in “Materials and Methods”; and lane 3–delphinidin/Sepharose 4B affinity beads were used to pull down Raf1 or MEK1. B, Binding of Raf1 or MEK1 with delphinidin ex vivo was confirmed by immunoblotting using an antibodies against Raf1 (left panel) or MEK1 (right panel): lane 1 (input control)–whole-cell lysates from JB6 P+ cells; lane 2 (control)–a lysate of JB6 P+ cells precipitated with Sepharose 4B beads; and lane 3–whole-cell lysates from JB6 P+ cells precipitated by delphinidin/Sepharose 4B affinity beads. C, Delphinidin did not compete with ATP for binding with Raf1 or MEK1. Active Raf1 (100 ng) or MEK1 (2 μg) was incubated with ATP at two concentrations (10 or 100 μM) and 100 μl of delphinidin/Sepharose 4B or 100 μl of Sepharose 4B (as a negative control) in a reaction buffer to a final volume of 500 μl. The mixtures were incubated at 4°C overnight with shaking. After washing, the pulled-down proteins were detected by Western blotting: lane 2 is the negative control, which indicates that Raf1 and MEK1 do not bind with Sepharose 4B; and lane 3 is the positive control, which indicates that Raf1 and MEK1 bind with delphinidin/Sepharose 4B.
Delphinidin inhibits H-Ras- or EGF-induced neoplastic transformation of JB6 P+ cells
To confirm that inhibition of the Raf/MEK/ERK signaling pathway by delphinidin leads to the suppression of neoplastic transformation, we examined whether delphinidin could inhibit H-Ras- or EGF-induced JB6 P+ cell transformation. Results indicate that delphinidin at 10 μM blocked H-Ras- or EGF-induced cell transformations by 53.7% or 40.3%, respectively (Fig. 6A and B). Together these findings provided evidence that delphinidin suppresses cell transformation mainly by targeting Raf1 or MEK1 (Fig. 6C).
Fig. 6.

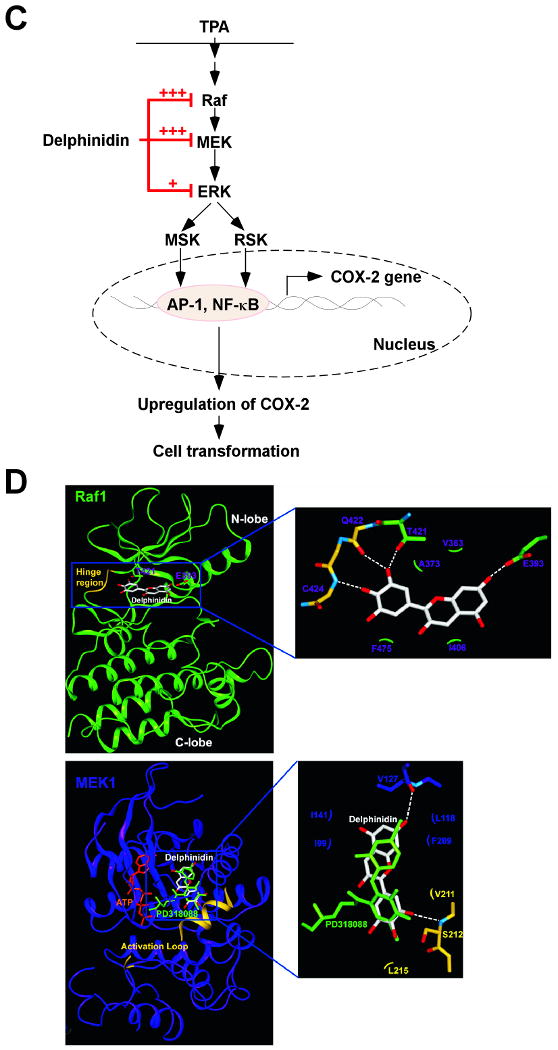
Effects of delphinidin on H-Ras- or EGF-induced cell transformations and the proposed molecular mechanisms for inhibition of neoplastic cell transformation by delphinidin. A, (left panel) H-Ras- transformed JB6 cells were treated as described in “Materials and Methods”, and colonies were counted 14 days later: (a) untreated control; (b) 5 μM delphinidin; (c) 10 μM delphinidin; (d) 20 μM delphinidin; and (e) 40 μM delphinidin. (right panel) Delphinidin inhibits H-ras-induced cell transformation. Cell colonies were counted under a microscope with the aid of Image-Pro Plus software (v.4). The effects of delphinidin on cell transformation of JB6 P+ cells are presented as the percent inhibition of cell transformation in soft agar by delphinidin relative to untreated H-ras-transformed cells. Data are presented as mean and S.D. values from three independent experiments. The asterisk (*) indicates a significant difference (p < 0.01) between groups treated with delphinidin and the untreated control group. B, (left panel) Delphinidin inhibits EGF-induced cell transformation. JB6 P+ cells were treated as described in “Materials and Methods”, and colonies were counted 14 days later: (a) untreated control; (b) EGF alone; (c) EGF and 5 μM delphinidin; (d) EGF and 10 μM delphinidin; (e) EGF and 20 μM delphinidin; and (f) EGF and 40 μM delphinidin. (right panel) Cell colonies were counted under a microscope with the aid of Image-Pro Plus software. The effects of delphinidin on cell transformation of JB6 P+ cells are presented as the percent inhibition of cell transformation in soft agar relative to cell stimulated by only EGF. Data are presented as mean and S.D. values from three independent experiments. The asterisk (*) indicates a significant difference (p < 0.01) between groups treated with EGF and delphinidin and the group treated with EGF alone. C, Delphinidin inhibits TPA-induced neoplastic transformation by directly targeting Raf1 and MEK1 activities. The “+” indicates a greater inhibition of kinase activity. D, Modeling study of the binding of delphinidin to Raf1 or MEK1. Upper panel, Hypothetical model of the B-Raf–ATP–delphinidin complex. Delphinidin (with green carbon atoms) binds to the pocket adjacent to the ATP (white carbon atoms)-binding site. BAY43-9006 (yellow) is overlaid on the model structure. The partially disordered activation loop is colored white. The residues involved in the interactions with delphinidin are indicated. The hydrogen bond is depicted as a dashed line. Lower panel, Hypothetical model of the MEK1–ATP–delphinidin complex. Delphinidin (atomic color) binds to the pocket adjacent to the ATP (orange)-binding site. PD318088 (green) is overlaid on the model structure of the complex for comparison. The partially disordered activation loop is colored yellow. The residues involved in the interactions with delphinidin are indicated. The hydrogen bond is depicted as a dashed line.
Discussion
Epidemiological investigations indicate that moderate consumption of anthocyanin-containing foodstuffs such as red wine and bilberry extract is associated with a lower risk of cancer (26, 27). A previous study showed that delphinidin exerted the strongest anticarcinogenic effects among six types of anthocyanidins, including delphinidin, cyanidin, petunidin, pelargonidin, peonidin, and malvidin (23), which is consistent with our finding that delphinidin inhibited TPA-induced neoplastic transformation. Our results showed that delphinidin suppresses TPA-induced COX-2 expression and PGE2 production in JB6 P+ cells. However, the application of resveratrol, a well-known chemopreventive polyphenol in red wine and berries, at the same concentration as delphinidin used in this study had no effect on neoplastic transformation or COX-2 expression induced by TPA (data not shown). Chemopreventive strategies for suppressing tumor promotion (a reversible, long-term process) will be more practical than those for inhibiting tumor initiation (an irreversible, short-term process). Evidence suggests that inflammation is associated with the transformation of normal cells into tumors (28). Overexpression of COX-2 was found to be a general feature of neoplasms, particularly those of epithelial origin, in both experimental animals and humans. Accumulating evidence suggests that high levels of COX-2 expression and PGE2 production play a role in tumorigenesis, particularly in skin cancer (3, 4, 29). Previous studies also demonstrated that COX-2 inhibitors suppress neoplastic transformation and that COX-2 overexpression induces neoplastic transformation (6, 30). Therefore, the suppression of prostaglandin synthesis by selectively inhibiting COX-2 was suggested as a promising strategy for deveoping chemopreventive agents. Our results indicated that delphinidin exerts potent antitumor-promoting and anti-inflammatory effects.
The AP-1 and NF-κB signal transduction pathways are important in tumor progression, and both AP-1 and NF-κB are activated by tumor promoters (31-33). Recent studies showed that COX-2 expression is primarily regulated by AP-1, NF-κB, and their upstream kinases, MAPKs (13, 31, 32). The activated form of each MAPK phosphorylates and activates other kinases or transcription factors, thereby altering the expression of the target genes. The induction of neoplastic transformation and COX-2 expression was abolished by the pharmacological inhibition or dominant-negative knockout of MEK, suggesting that the MEK pathway is partially responsible for cell transformation and COX-2 expression (9, 34). Therefore, inhibition of signal transduction involving MEK, AP-1, and NF-κB might be functionally linked to the antitumor promotion effects of delphinidin. The present study demonstrated that delphinidin inhibits TPA-induced AP-1 and NF-κB transactivation and c-fos promoter activity in JB6 P+ cells. Further, we found that the MEK/ERK/p90RSK/MSK signaling cascade was blocked by delphinidin, suggesting that other upstream effectors serve as target(s) for delphinidin.
The Ras/Raf/MEK/ERK signaling pathway is responsible for the coordination and regulation of cell growth and differentiation in response to extracellular stimulation (35-38). The ERK or MAPK group is considered the classical MAPK signaling pathway, and consists of a MAPK (e.g., ERK1 and ERK2), a MEK (e.g., MEK1 and MEK2), and a MAPK kinase kinase (e.g., Raf or MKKK). MEK1 and MEK2 are dual-specificity protein kinases that phosphorylate the downstream target ERK on specific tyrosine and threonine residues. MEKs function as key components of this evolutionarily conserved signaling module and are activated by the phosphorylation of key serine residues on the catalytic domain by the upstream serine kinase, Raf. Constitutively activated MEK or Raf results in neoplastic transformation (39). Our results clearly showed that delphinidin was effective at inhibiting Raf1 and MEK1 activities in vitro and ex vivo and resulted in the suppression of ERK phosphorylation. In addition to the ERK pathway, JNK also was reported to be involved in neoplastic transformation and COX-2 overexpression in JB6 P+ cells (6, 32). A previous study showed that TPA did not induce skin tumorigenesis in JNK2-deficient mice, which also supports the important role of JNK in skin tumorigenesis (40). We found that although delphinidin inhibited TPA-induced JNK phosphorylation (data not shown), delphinidin slightly inhibited JNK1 activity but no effect on ERK2 activity was detected. Also, in vitro and ex vivo pull-down assays revealed that delphinidin directly bound Raf1 and MEK1 noncompetitively with ATP, which might account for reduced kinase activities of Raf1 and MEK1. Delphinidin also suppressed H-Ras- and EGF-induced neoplastic transformation, supporting the idea that delphinidin inhibits the Raf/MEK/ERK pathway irrespective of the type of inducers stimulating this pathway. Collectively, these findings indicated that the inhibition of cell transformation and COX-2 expression by delphinidin was mainly caused by the suppression of Raf1 or MEK1 activities and to a lesser extent by inhibition of ERK or JNK. However, this does not eliminate the possibility that delphinidin has another potent molecular target, such as an upstream kinase of JNK.
Because abnormal activation of the ERK pathway was reported to be pivotal in human tumors (17, 18), putative chemoprevention strategies have focused on targeted inhibition of the Raf/MEK/ERK pathway by small molecules. Actually, because most cancers result from only a small number of mutations (41), agents targeting multiple kinases might more effective than highly selective kinase inhibitors administered as single agents. The discovery of inhibitors targeting multiple kinases has been largely empirical in the sense that many such inhibitors have evolved from drug-discovery programs in which nonselective ATP competition was identified at the outset. BAY43-9006 is a multi-target kinase inhibitor that was recently approved for the treatment of metastatic renal cancer, and suppresses B-Raf and vascular endothelial growth factor receptor (VEGFR) activities (42, 43). Crystallographic studies showed that BAY43-9006 binds to the ATP pocket of B-Raf, interacting with residues in both the P and kinase-activation loops. BAY43-9006 is believed to inhibit Raf catalytic activity by preventing the activation loop and the catalytic residues from adopting a conformation that is competent to bind and phosphorylate the substrate (44). On the other hand, PD318088 binds with MEK1 in a region of the kinase active site that is adjacent to the ATP-binding site (45).
Based on the observations above, we modeled the binding mode of delphinidin to MEK1 and Raf1. Because the crystal structure of Raf1 is not available, a docking study was carried out using the crystal structure of B-Raf, which is highly homologous to Raf1 (80% homologous amino acid sequence). In the crystal structure of B-Raf complexed with BAY43-9006, the compound occupied the adenine-binding site and promoted the inactive conformation of the activation loop by interacting with the phenyl ring of Phe594 (44), suggesting that delphinidin was an ATP-noncompetitive inhibitor. Therefore, the binding of delphinidin to B-Raf cannot be similar to that of BAY43-9006 without occupying the ATP-binding site of B-Raf. In the hypothetical structure of the B-Raf/ATP/delphinidin ternary complex, delphinidin could be docked to the pocket separate from but adjacent to the ATP-binding site of B-Raf, as predicted for the model structure of the MEK1/ATP/delphinidin ternary complex (Fig. 6D). The hydroxyl groups at the 3, 5, and 7 positions form hydrogen bonds with the side chains of Lys482, Thr528, and Thr507, respectively. This group also forms hydrophobic interactions with Leu504 and Val503. The inactive conformation of the activation loop of B-Raf can also be stabilized by forming hydrogen bonds with delphinidin, with BAY43-9006 contributing to the inactive conformation by an hydrophobic interaction. The C-ring moiety of delphinidin forms hydrogen bonds with the backbone carbonyl group of Gly595 and the side chain of Thr598, and thus holds the activation loop of B-Raf in an inactive conformation. Interestingly, delphinidin could be docked to the pocket separate from but adjacent to the ATP-binding site of MEK1, which is similar to that observed for PD318088 in the crystal structure of the MEK1/PD318088 complex (Fig. 6D) (45). The predicted binding mode of delphinidin is also similar to that of PD318088. The hydroxyl group at the 7 position forms a hydrogen bond with the backbone carbonyl group of Val127 in the ATP-noncompetitive binding site of MEK1. In addition, several van der Waals interactions exist with the hydrophobic surface formed by Ile99, Ile141, Phe209, and Leu118. The C ring interacts with the residues in the activation loop of the inactive MEK1, and Val211 and Leu215 experience van der Waals interactions with the C ring of the inhibitor. The hydroxyl group at the 3′ or 5′ position of the C ring can form a critical hydrogen bond with the backbone amide group of Ser212. These interactions of delphinidin with the activation loop would lock MEK1 into a catalytically inactive species by stabilizing the inactive conformation of the activation loop.
In summary, delphinidin inhibits tumor-promoter-induced neoplastic transformation and COX-2 expression in JB6 P+ cells. This inhibition is mediated mainly by the blockage of the Raf/MEK/ERK pathway and subsequent suppression of AP-1 and NF-κB activities. Delphinidin binds with Raf1 and MEK1 and strongly inhibits their kinase activity. Collectively, these results suggested that Raf1 and MEK1 are the most potent molecular targets of delphinidin for suppressing neoplastic transformation. These results provide insight into the biological actions of delphinidin and the molecular basis for the development of new chemoprotective agents.
Acknowledgments
We thank Andria Hansen for secretarial assistance.
Grant support: This work is supported in part by The Hormel Foundation; NIH grants CA027502, CA120388, CA111536, CA077646, and CA081064; and by grants of the BioGreen21 Program (no. 20070301-034-042), Rural Development Administration, Republic of Korea.
Footnotes
Disclosure of Potential Conflicts of Interest: No potential conflicts of interest were disclosed.
References
- 1.Balkwill F, Mantovani A. Inflammation and cancer: back to Virchow? Lancet. 2001;357:539–45. doi: 10.1016/S0140-6736(00)04046-0. [DOI] [PubMed] [Google Scholar]
- 2.Coussens LM, Werb Z. Inflammation and cancer. Nature. 2002;420:860–7. doi: 10.1038/nature01322. [DOI] [PMC free article] [PubMed] [Google Scholar]
- 3.Higashi Y, Kanekura T, Kanzaki T. Enhanced expression of cyclooxygenase (COX)-2 in human skin epidermal cancer cells: evidence for growth suppression by inhibiting COX-2 expression. Int J Cancer. 2000;86:667–71. doi: 10.1002/(sici)1097-0215(20000601)86:5<667::aid-ijc10>3.0.co;2-y. [DOI] [PubMed] [Google Scholar]
- 4.Lee JL, Mukhtar H, Bickers DR, Kopelovich L, Athar M. Cyclooxygenases in the skin: pharmacological and toxicological implications. Toxicol Appl Pharmacol. 2003;192:294–306. doi: 10.1016/s0041-008x(03)00301-6. [DOI] [PubMed] [Google Scholar]
- 5.Williams CS, DuBois RN. Prostaglandin endoperoxide synthase: why two isoforms? Am J Physiol. 1996;270:G393–400. doi: 10.1152/ajpgi.1996.270.3.G393. [DOI] [PubMed] [Google Scholar]
- 6.Wong BC, Jiang XH, Lin MC, et al. Cyclooxygenase-2 inhibitor (SC-236) suppresses activator protein-1 through c-Jun NH2-terminal kinase. Gastroenterology. 2004;126:136–47. doi: 10.1053/j.gastro.2003.10.063. [DOI] [PubMed] [Google Scholar]
- 7.Liu G, Bode A, Ma WY, Sang S, Ho CT, Dong Z. Two novel glycosides from the fruits of Morinda citrifolia (noni) inhibit AP-1 transactivation and cell transformation in the mouse epidermal JB6 cell line. Cancer Res. 2001;61:5749–56. [PubMed] [Google Scholar]
- 8.Dong Z, Birrer MJ, Watts RG, Matrisian LM, Colburn NH. Blocking of tumor promoter-induced AP-1 activity inhibits induced transformation in JB6 mouse epidermal cells. Proc Natl Acad Sci USA. 1994;91:609–13. doi: 10.1073/pnas.91.2.609. [DOI] [PMC free article] [PubMed] [Google Scholar]
- 9.Huang C, Ma WY, Young MR, Colburn N, Dong Z. Shortage of mitogen-activated protein kinase is responsible for resistance to AP-1 transactivation and transformation in mouse JB6 cells. Proc Natl Acad Sci USA. 1998;95:156–61. doi: 10.1073/pnas.95.1.156. [DOI] [PMC free article] [PubMed] [Google Scholar]
- 10.Young MR, Li JJ, Rincon M, et al. Transgenic mice demonstrate AP-1 (activator protein-1) transactivation is required for tumor promotion. Proc Natl Acad Sci U S A. 1999;96:9827–32. doi: 10.1073/pnas.96.17.9827. [DOI] [PMC free article] [PubMed] [Google Scholar]
- 11.Sebolt-Leopold JS, Herrera R. Targeting the mitogen-activated protein kinase cascade to treat cancer. Nat Rev Cancer. 2004;4:937–47. doi: 10.1038/nrc1503. [DOI] [PubMed] [Google Scholar]
- 12.Nomura M, Ichimatsu D, Moritani S, et al. Inhibition of epidermal growth factor-induced cell transformation and Akt activation by caffeine. Mol Carcinog. 2005;44:67–76. doi: 10.1002/mc.20120. [DOI] [PubMed] [Google Scholar]
- 13.Suzukawa K, Weber TJ, Colburn NH. AP-1, NF-kappa-B, and ERK activation thresholds for promotion of neoplastic transformation in the mouse epidermal JB6 model. Environ Health Perspect. 2002;110:865–70. doi: 10.1289/ehp.02110865. [DOI] [PMC free article] [PubMed] [Google Scholar]
- 14.Thompson N, Lyons J. Recent progress in targeting the Raf/MEK/ERK pathway with inhibitors in cancer drug discovery. Curr Opin Pharmacol. 2005;5:350–6. doi: 10.1016/j.coph.2005.04.007. [DOI] [PubMed] [Google Scholar]
- 15.Roberts PJ, Der CJ. Targeting the Raf-MEK-ERK mitogen-activated protein kinase cascade for the treatment of cancer. Oncogene. 2007;26:3291–310. doi: 10.1038/sj.onc.1210422. [DOI] [PubMed] [Google Scholar]
- 16.Schreck R, Rapp UR. Raf kinases: oncogenesis and drug discovery. Int J Cancer. 2006;119:2261–71. doi: 10.1002/ijc.22144. [DOI] [PubMed] [Google Scholar]
- 17.Gioeli D, Mandell JW, Petroni GR, Frierson HF, Jr, Weber MJ. Activation of mitogen-activated protein kinase associated with prostate cancer progression. Cancer Res. 1999;59:279–84. [PubMed] [Google Scholar]
- 18.Oka H, Chatani Y, Hoshino R, et al. Constitutive activation of mitogen-activated protein (MAP) kinases in human renal cell carcinoma. Cancer Res. 1995;55:4182–7. [PubMed] [Google Scholar]
- 19.Mazza G. Anthocyanins in grapes and grape products. Crit Rev Food Sci Nutr. 1995;35:341–71. doi: 10.1080/10408399509527704. [DOI] [PubMed] [Google Scholar]
- 20.Nagase H, Sasaki K, Kito H, Haga A, Sato T. Inhibitory effect of delphinidin from Solanum melongena on human fibrosarcoma HT-1080 invasiveness in vitro. Planta Med. 1998;64:216–9. doi: 10.1055/s-2006-957412. [DOI] [PubMed] [Google Scholar]
- 21.Chen S, Ruan Q, Bedner E, et al. Effects of the flavonoid baicalin and its metabolite baicalein on androgen receptor expression, cell cycle progression and apoptosis of prostate cancer cell lines. Cell Prolif. 2001;34:293–304. doi: 10.1046/j.0960-7722.2001.00213.x. [DOI] [PMC free article] [PubMed] [Google Scholar]
- 22.Fotsis T, Pepper MS, Aktas E, et al. Flavonoids, dietary-derived inhibitors of cell proliferation and in vitro angiogenesis. Cancer Res. 1997;57:2916–21. [PubMed] [Google Scholar]
- 23.Hou DX, Kai K, Li JJ, et al. Anthocyanidins inhibit activator protein 1 activity and cell transformation: structure-activity relationship and molecular mechanisms. Carcinogenesis. 2004;25:29–36. doi: 10.1093/carcin/bgg184. [DOI] [PubMed] [Google Scholar]
- 24.Bode AM, Dong Z. Signal transduction pathways in cancer development and as targets for cancer prevention. Prog Nucleic Acid Res Mol Biol. 2005;79:237–97. doi: 10.1016/S0079-6603(04)79005-4. [DOI] [PubMed] [Google Scholar]
- 25.Bode AM, Dong Z. Signal transduction pathways: targets for chemoprevention of skin cancer. Lancet Oncol. 2000;1:181–8. doi: 10.1016/s1470-2045(00)00029-2. [DOI] [PubMed] [Google Scholar]
- 26.Muth ER, Laurent JM, Jasper P. The effect of bilberry nutritional supplementation on night visual acuity and contrast sensitivity. Altern Med Rev. 2000;5:164–73. [PubMed] [Google Scholar]
- 27.Renaud S, de Lorgeril M. Wine, alcohol, platelets, and the French paradox for coronary heart disease. Lancet. 1992;339:1523–6. doi: 10.1016/0140-6736(92)91277-f. [DOI] [PubMed] [Google Scholar]
- 28.Dubois RN, Abramson SB, Crofford L, et al. Cyclooxygenase in biology and disease. Faseb J. 1998;12:1063–73. [PubMed] [Google Scholar]
- 29.Prosperi JR, Mallery SR, Kigerl KA, Erfurt AA, Robertson FM. Invasive and angiogenic phenotype of MCF-7 human breast tumor cells expressing human cyclooxygenase-2. Prostaglandins Other Lipid Mediat. 2004;73:249–64. doi: 10.1016/j.prostaglandins.2004.03.004. [DOI] [PubMed] [Google Scholar]
- 30.Liu G, Ma WY, Bode AM, Zhang Y, Dong Z. NS-398 and piroxicam suppress UVB-induced activator protein 1 activity by mechanisms independent of cyclooxygenase-2. J Biol Chem. 2003;278:2124–30. doi: 10.1074/jbc.M202443200. [DOI] [PubMed] [Google Scholar]
- 31.Bode AM, Dong Z. Signal transduction pathways in cancer development and as targets for cancer prevention. Prog Nucleic Acid Res Mol Biol. 2005;79:237–97. doi: 10.1016/S0079-6603(04)79005-4. [DOI] [PubMed] [Google Scholar]
- 32.Hsu TC, Young MR, Cmarik J, Colburn NH. Activator protein 1 (AP-1)- and nuclear factor kappaB (NF-kappaB)-dependent transcriptional events in carcinogenesis. Free Radic Biol Med. 2000;28:1338–48. doi: 10.1016/s0891-5849(00)00220-3. [DOI] [PubMed] [Google Scholar]
- 33.Cowley S, Paterson H, Kemp P, Marshall CJ. Activation of MAP kinase kinase is necessary and sufficient for PC12 differentiation and for transformation of NIH 3T3 cells. Cell. 1994;77:841–52. doi: 10.1016/0092-8674(94)90133-3. [DOI] [PubMed] [Google Scholar]
- 34.Sebolt-Leopold JS, Dudley DT, Herrera R, et al. Blockade of the MAP kinase pathway suppresses growth of colon tumors in vivo. Nat Med. 1999;5:810–6. doi: 10.1038/10533. [DOI] [PubMed] [Google Scholar]
- 35.Johnson JI, Decker S, Zaharevitz D, et al. Relationships between drug activity in NCI preclinical in vitro and in vivo models and early clinical trials. Br J Cancer. 2001;84:1424–31. doi: 10.1054/bjoc.2001.1796. [DOI] [PMC free article] [PubMed] [Google Scholar]
- 36.Voskoglou-Nomikos T, Pater JL, Seymour L. Clinical predictive value of the in vitro cell line, human xenograft, and mouse allograft preclinical cancer models. Clin Cancer Res. 2003;9:4227–39. [PubMed] [Google Scholar]
- 37.Brugge JS, Erikson RL. Identification of a transformation-specific antigen induced by an avian sarcoma virus. Nature. 1977;269:346–8. doi: 10.1038/269346a0. [DOI] [PubMed] [Google Scholar]
- 38.Collett MS, Erikson RL. Protein kinase activity associated with the avian sarcoma virus src gene product. Proc Natl Acad Sci U S A. 1978;75:2021–4. doi: 10.1073/pnas.75.4.2021. [DOI] [PMC free article] [PubMed] [Google Scholar]
- 39.Mansour SJ, Matten WT, Hermann AS, et al. Transformation of mammalian cells by constitutively active MAP kinase kinase. Science. 1994;265:966–70. doi: 10.1126/science.8052857. [DOI] [PubMed] [Google Scholar]
- 40.Chen N, Nomura M, She QB, et al. Suppression of skin tumorigenesis in c-Jun NH(2)-terminal kinase-2-deficient mice. Cancer Res. 2001;61:3908–12. [PubMed] [Google Scholar]
- 41.Hanahan D, Weinberg RA. The hallmarks of cancer. Cell. 2000;100:57–70. doi: 10.1016/s0092-8674(00)81683-9. [DOI] [PubMed] [Google Scholar]
- 42.Wilhelm SM, Carter C, Tang L, et al. BAY 43-9006 exhibits broad spectrum oral antitumor activity and targets the RAF/MEK/ERK pathway and receptor tyrosine kinases involved in tumor progression and angiogenesis. Cancer Res. 2004;64:7099–109. doi: 10.1158/0008-5472.CAN-04-1443. [DOI] [PubMed] [Google Scholar]
- 43.Adnane L, Trail PA, Taylor I, Wilhelm SM. Sorafenib (BAY 43-9006, Nexavar((R))), a Dual-Action Inhibitor That Targets RAF/MEK/ERK Pathway in Tumor Cells and Tyrosine Kinases VEGFR/PDGFR in Tumor Vasculature. Methods Enzymol. 2005;407:597–612. doi: 10.1016/S0076-6879(05)07047-3. [DOI] [PubMed] [Google Scholar]
- 44.Wan PT, Garnett MJ, Roe SM, et al. Mechanism of activation of the RAF-ERK signaling pathway by oncogenic mutations of B-RAF. Cell. 2004;116:855–67. doi: 10.1016/s0092-8674(04)00215-6. [DOI] [PubMed] [Google Scholar]
- 45.Ohren JF, Chen H, Pavlovsky A, et al. Structures of human MAP kinase kinase 1 (MEK1) and MEK2 describe novel noncompetitive kinase inhibition. Nat Struct Mol Biol. 2004;11:1192–7. doi: 10.1038/nsmb859. [DOI] [PubMed] [Google Scholar]