

Abstract
Watching the lips of a speaker enhances speech perception. At the same time, the 100 ms response to speech sounds is suppressed in the observer's auditory cortex. Here, we used whole-scalp 306-channel magnetoencephalography (MEG) to study whether lipreading modulates human auditory processing already at the level of the most elementary sound features, i.e., pure tones. We further envisioned the temporal dynamics of the suppression to tell whether the effect is driven by top-down influences. Nineteen subjects were presented with 50 ms tones spanning six octaves (125–8000 Hz) (1) during “lipreading,” i.e., when they watched video clips of silent articulations of Finnish vowels /a/, /i/, /o/, and /y/, and reacted to vowels presented twice in a row; (2) during a visual control task; (3) during a still-face passive control condition; and (4) in a separate experiment with a subset of nine subjects, during covert production of the same vowels. Auditory-cortex 100 ms responses (N100m) were equally suppressed in the lipreading and covert-speech-production tasks compared with the visual control and baseline tasks; the effects involved all frequencies and were most prominent in the left hemisphere. Responses to tones presented at different times with respect to the onset of the visual articulation showed significantly increased N100m suppression immediately after the articulatory gesture. These findings suggest that the lipreading-related suppression in the auditory cortex is caused by top-down influences, possibly by an efference copy from the speech-production system, generated during both own speech and lipreading.
Introduction
Our senses interact and usually support each other. For example, watching the lips of a speaker enhances speech perception in noisy conditions (Sumby and Pollack, 1954). On the other hand, the cortical 100 ms response to speech sounds (N100/N100m) is suppressed during audiovisual, compared with auditory-only, presentation in both electroencephalographic (EEG) (Klucharev et al., 2003; Besle et al., 2004; van Wassenhove et al., 2005; Stekelenburg and Vroomen, 2007) and magnetoencephalographic (MEG) recordings (Jääskeläinen et al., 2004). Lipreading-related suppression specific to formant components of speech sounds has also been found (Jääskeläinen et al., 2008), with modulation of hemodynamic activity even in primary auditory cortex (Calvert et al., 1997; MacSweeney et al., 2000; Pekkola et al., 2005), suggesting effects already at the level of elementary sound features.
The suppression of the neural population-level N100/N100m response with stimulus repetition has been attributed to active inhibition (Loveless et al., 1989). Hypothetically, the lipreading-related suppression could be due to top-down inhibitory influences that increase frequency specificity in the auditory system (Jääskeläinen et al., 2007), possibly via direct anatomical connections from visual areas (Falchier et al., 2002; Rockland and Ojima, 2003; Cappe and Barone, 2005). Alternatively, the suppression might be explained by subcortical projections (Cappe et al., 2009a), or by back-projections from heteromodal cortical areas (Lewis and Van Essen, 2000). Still another possibility is that a rather similar efference copy signal is sent from the speech-production system during both articulation and lipreading, because Broca's region is activated in both (for review, see Nishitani et al., 2005). This view is supported by a study showing that both silent articulation and lipreading modify perception of speech sounds similarly (Sams et al., 2005).
Recently, Skipper et al. (2007) addressed the role of efference copy signals in audiovisual speech perception by visually presenting /ka/, dubbed with auditory /pa/, to produce a McGurk illusion: perception of /ta/. The fMRI pattern in the auditory cortex initially resembled that of /pa/, but later matched that elicited by /ta/, thus paralleling categorization at the behavioral level as well as the neuronal activity patterns in frontal speech-production areas. Articulation-related efference copy signals suppress the auditory-cortex responses to both self-produced and externally produced sounds, as N100m to phonetic stimuli is suppressed during both overt and covert speech production (Numminen and Curio, 1999; Curio et al., 2000). While both lipreading and speech production may suppress auditory-cortex reactivity, it still remains unclear whether both these effects can be explained similarly because no studies have directly compared their specificity to sound features, such as frequency bands important to speech (Warren et al., 1995).
Here, we hypothesized that lipreading modulates auditory processing already at the level of the most elementary sound features, pure tones. We envisioned that the modulation could be different for frequencies critical for speech perception compared with other frequencies. We further hypothesized that lipreading and covert self-production of vowels have similar suppressive effects on the auditory-cortex reactivity, suggesting that the N100m suppression is caused by an efference copy from the speech-production system.
Materials and Methods
Subjects.
Twenty healthy subjects participated voluntarily in the study, out of which one subject was dropped due to technical problems. All subjects included in the analysis (n = 19) were right-handed native Finnish speakers with normal hearing and normal or corrected-to-normal sight (10 women, 9 men, age 20–32 years, mean ± SD 23.7 ± 3.2 years). The subset of subjects (n = 9) with an additional covert speech production task included four women and five men (21–32 years, mean ± SD 23.7 ± 3.3 years). The subjects gave an informed consent before the experiment and were not paid for their participation. The experiment was run in accordance with the Helsinki Declaration, and the MEG recordings had a prior approval by the Ethics Committee of the Hospital District of Helsinki and Uusimaa, Finland.
Experimental setup.
The visual stimuli used in the experiment were similar to ones used by Pekkola et al. (2005). Figure 1 depicts the summary of the stimuli and experimental paradigm. During the lipreading condition, video clips of a woman articulating Finnish vowels /a/, /i/, /o/, or /y/ were presented through a back-projector screen located 100 cm in front of the subject. The face extended ∼5.9° × 7.8° of visual angle (width of the mouth ∼1.7°). Each single vowel clip lasted for 1.28 s and was extended with 1–4 frames (0.04–0.16 s) of the still face to induce jitter to the presentation (i.e., the stimulus onset asynchrony, SOA, for each vowel was variable). These short video clips were concatenated in pseudorandom order to form a long, continuous video. One-tenth of the time, two identical vowels followed each other, constituting a target stimulus. During the “expanding rings” control condition, a blue ring with a diameter corresponding to 1.0° visual angle was overlaid on the still face. The ring was manipulated to change its shape to one of four directions: horizontal, vertical, or tilted ±45°. The ring transformation took place at approximately the same pace as the mouth openings during the lipreading condition. Similarly, the short video clips of ring transformations were extended with still frames to induce jitter, and combined to one long presentation in pseudorandom order: 10% of the clips were targets. During the still-face and covert-speech-production conditions, only the still face was continuously shown on the screen.
Figure 1.
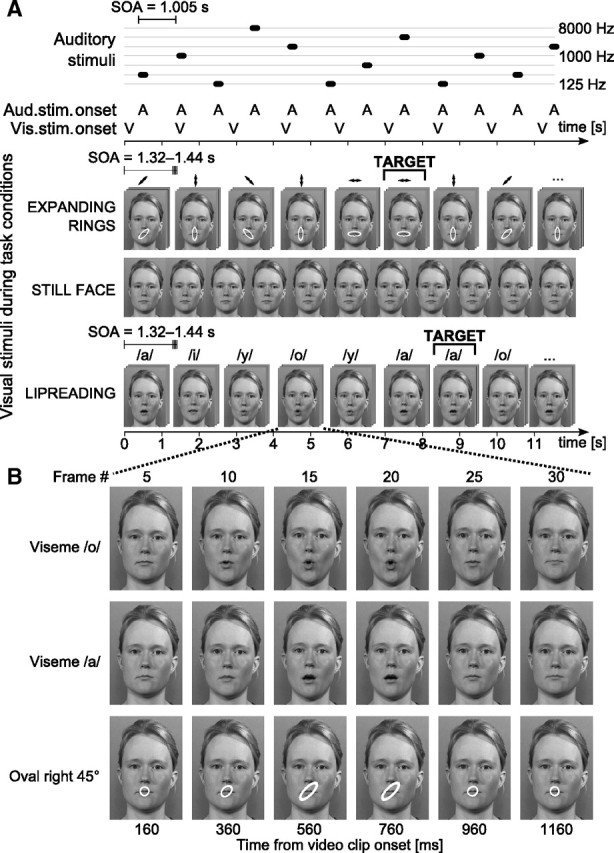
Schematic illustration of the experimental paradigm. A, Auditory stimuli, 50 ms tones of various frequencies, were played in random order with a constant SOA. During still-face and covert-speech conditions, the subjects were seeing the same static face on the screen. Visual stimuli consisted of video clips showing either an expanding ring overlaid on the still-face image mouth area or the face of a woman articulating different Finnish vowels. The SOA was slightly different for each video clip, inducing jitter in presentation and causing asynchrony between auditory and visual stimuli, as shown in common timeline below the illustration of auditory events. This asynchrony is also depicted in the placement of representative frames, as the auditory and visual stimulus illustrations have an identical time scale. During expanding-rings as well as lipreading conditions, subjects performed a one-back task. B, Breakdown of a single video clip. The video clips of articulations and ring expansions were edited so that they all occurred at the same pace. The example frames shown here were chosen at constant intervals from the video clip start. The mouth opening and closing with different vowels occurred at the same lag from the start, allowing the pooling of vowel stimuli for later analysis (see Figs. 5, 7).
Auditory stimuli were identical in all conditions: 50 ms sine-wave tones with a frequency of 125, 250, 500, 1000, 2000, 4000, and 8000 Hz and an interstimulus interval of 1005 ms were presented, in random order, through ear inserts (Etymotic Research). Each tone had 5 ms Hann-windowed rise and fall times. Sound files were generated with Matlab (R14, MathWorks) using a 44.1 kHz sampling rate with 16 bit precision. Random playback order of the tones was controlled so that two consecutive tones were at least two octaves apart. The sounds were played 55 dB above individual hearing threshold, measured separately at 1000 Hz for both ears.
Auditory and visual stimulus presentation rates differed (tones presented at a fixed rate of ∼1 Hz, video clips on average at ∼0.7 Hz) (Fig. 1) so that the stimuli were at constantly varying synchrony with respect to the other modality and thus could not be fused together to form an audiovisual object. Both stimuli were delivered using Presentation software (v10.1, Neurobehavioral systems). Each of the three conditions (still face, lipreading, expanding rings) was presented in short 6–7 min interleaved blocks with counterbalanced order across subjects. At least 100 artifact-free MEG epochs were collected for the online average.
The subjects were instructed to perform a one-back task during both the lipreading and expanding-rings conditions by lifting their right index finger whenever they detected the target, two identical vowels or ring transformations following each other: the response was detected with an optical response pad. During the still-face condition, the only instruction was to keep the gaze focused on the mouth area of the face. All 19 subjects were measured in three different experimental conditions: (1) lipreading, (2) expanding rings, and (3) still face. A subset of nine subjects additionally participated in a fourth condition: covert speech production, where the subjects were instructed to covertly produce the same Finnish vowels that were presented visually during the lipreading condition while the same still face of a woman was shown on the screen. The subjects were further instructed to avoid movements of the head and mouth to minimize artifacts caused by muscular activity, and to keep roughly the same pace as during lipreading and expanding rings (i.e., one vowel every 1.5 s).
The reaction times were measured from the onset of the video clips. As each video clip started with frames showing still face (Fig. 1), the visual movement did not start at 0 ms, and thus the onset times of visual motion differed slightly between the lipreading and expanding-rings conditions. The correction was 360 ms for all ring transformations in the expanding-rings condition (edited to occur in exact synchrony) and 440, 400, 400, and 440 ms for vowels /a/, /i/, /o/, and /y/, respectively (1- to 2-frame difference from the expanding-rings condition).
MEG acquisition.
MEG was measured with a 306-channel whole-head neuromagnetometer (Vectorview, Elekta Neuromag) in a magnetically shielded room. This device has 102 sensor elements, each with two orthogonal planar gradiometers and one magnetometer. The sampling rate for the recording was 601 Hz, and the passband was 0.01–172 Hz. Additionally, one electro-oculogram channel with electrodes placed below and on the outer canthus of the left eye was recorded to detect eye blinks and eye movements. The signals time locked to auditory events were averaged offline, with epochs exceeding 3000 fT/cm or 150 μV rejected as containing extracerebral artifacts. Each epoch lasted for 700 ms, starting 200 ms before the stimulus onset. All amplitudes were measured with respect to a 100 ms prestimulus baseline. The averaged MEG signals were low-pass filtered at 40 Hz.
Before MEG recording, the 3D locations of preauricular points and nasion were digitized to obtain a right-handed head-coordinate frame. After this, locations of four head-position indicator coils, fixated on the scalp, were digitized. The coils were energized in the beginning of each recording session, providing information about head position with respect to the MEG sensors. Finally, extra points along the subjects' scalp were digitized to obtain a better head shape for later coregistration with the individual MR image and to estimate head size and the origin of the spherical head model used in dipole fitting.
Data analysis.
The cortical current sources of the MEG signals were modeled as two equivalent current dipoles (ECDs) that were fitted, using a spherical head model, to left- and right-hemisphere planar-gradiometer data (Hämäläinen et al., 1993). For each subject and condition, ECDs were estimated for the N100m responses elicited by the 1000 Hz tones. Thereafter, the dipole locations and orientations were kept fixed and MEG signals across other auditory stimuli were projected to these dipoles to yield N100m source waveforms for each subject, condition, and stimulus. The N100m peak strengths and peak latencies were determined from the individual source waveforms using semiautomatic peak-seeking algorithm. Grand-average source waveforms were calculated by averaging the individual source waveforms.
The peak strengths and peak latencies of the current dipoles were statistically analyzed using the nonparametric Kruskal–Wallis test for the main effects. For specific effects, Mann–Whitney U tests were used. The tests were conducted separately for the whole three-condition dataset (n = 19 subjects) and for the four-condition subset of subjects with covert-speech-production condition (n = 9), here referred to as p4cond. All statistical analyses were done in SPSS (version 15.0 for Windows).
The impact of the onset time of the visual stimulus on the auditory responses was studied in the lipreading condition by selectively averaging the responses according to the time difference (lag) between the tone and the visual articulation. As the auditory and visual stimuli were presented asynchronously, the lags were evenly distributed. Then, the subsets of epochs that were presented during overlapping 300 ms sliding windows (later referred to as ranges) were pooled together and averaged. These averaged MEG signals were projected through the same per-subject current dipoles as in the normal analysis to obtain source waveforms across frequencies, hemispheres, and ranges. Thereafter, the ECD peak strengths and latencies were analyzed using Kruskal–Wallis and Mann–Whitney U tests.
As MRI images were not available for all subjects, we adopted a different method of normalizing the head-coordinate system to a stereotactic space, suitable for group-level studies (Steinstraeter et al., 2009). The procedure included finding, by means of least-squares fitting for each individual, a sphere to the digitized anatomical landmarks (nasion and preauricular points), the locations of the four coils, and a number of extra points on the scalp (7–34, median 15 points). In this fitting procedure, points below nasion were discarded. For normalization, the head-coordinate system was first 3D rotated to match the MNI space obtained from “colin27” MRI image. Second, the coordinate system was transformed so that the spheres of “colin27” template and the MEG coordinates coincided. Third, the sphere size was matched to the sphere from the MNI template. These steps were combined to a 4 × 4 matrix defining an affine transform, which was then used to convert the dipole locations from the MEG head-coordinate system to the MNI space.
Results
Source strength reduction during lipreading and covert speech production
Figure 2 displays grand-average source waveforms for the 1 kHz tones (for a single-subject field pattern of the responses, see supplemental Fig. S1, available at www.jneurosci.org as supplemental material). A clear N100m response peaks at ∼100 ms in all conditions, without latency jitter, but with amplitude reduction during lipreading and covert speech production. N100m was suppressed at all tested sound frequencies (Fig. 3).
Figure 2.

The dipole locations overlaid on a tilted coronal MRI slice of a representative subject show the superior temporal lobe structures containing the auditory cortical areas. The grand-average ECD source waveforms for a 1 kHz tone are displayed beside the MRI slice and show clearly the N100m peak at ∼100 ms for both hemispheres.
Figure 3.

Mean (±SEM; shaded areas) ECD source waveforms at around the N100m peak across the nine subjects that were measured in all four conditions including the covert self-production of speech. The data from all 19 subjects are shown in supplemental Figure S2A (available at www.jneurosci.org as supplemental material). The full timescale of the evoked responses are available in supplemental Figure S3 (available at www.jneurosci.org as supplemental material); the close-up at around N100m peak is used here for clarity given the space constraints.
During the lipreading task and covert speech production task, the sources of auditory responses to task-irrelevant tones were on average 20–25% [6–7 nA·m (nanoampere-meters)] weaker than in the still-face condition across all frequencies (frequencies pooled together). The sources overall were 40% (8–9 nA·m) stronger in the right hemisphere than in the left, and 18–120% (5–20 nA·m) stronger for the 1000 Hz tone than for other frequencies used, resulting in an inverted V-shape curve for source strengths as a function of frequency (Fig. 4). Table 1 summarizes the results of Kruskal–Wallis statistical tests for the main effects of task condition, frequency and hemisphere. Paired Mann–Whitney U tests showed no significant differences between the expanding-rings and still-face conditions, but confirmed significant differences between expanding-rings and lipreading and between still-face and lipreading conditions (see Table 1). Further, for the four-condition subset, differences were statistically significant between expanding-rings and covert-speech and between still-face and covert-speech conditions, but not between the lipreading and covert-speech conditions.
Figure 4.
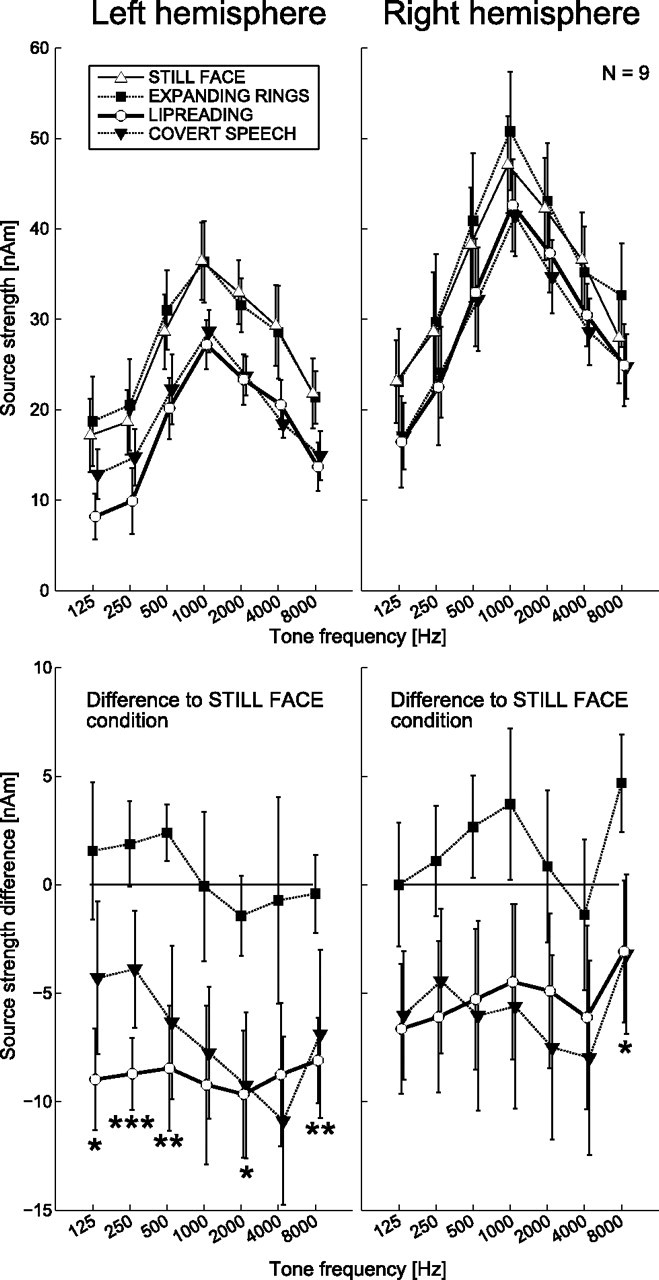
N100m peak amplitudes specified by mean (±SEM) ECD source strengths in different task conditions. The bottom shows the mean (±SEM) differences in active task conditions relative to the passive still-face baseline. Asterisks indicate significant differences at a given frequency between the lipreading and expanding-rings tasks (*p < 0.05, **p < 0.01, ***p < 0.001).
Table 1.
Results of statistical tests comparing peak N100m source strengths (Fig. 4, top)
| Tested main effect/specific comparison | Three conditions (n = 19) | Four conditions (n = 9) |
|---|---|---|
| Condition | *** | *** |
| Expanding rings versus still face | n.s. (p = 0.80) | n.s. (p = 0.68) |
| Expanding rings versus lipreading | *** | *** |
| Expanding rings versus covert speech | — | *** |
| Still face versus lipreading | *** | *** |
| Still face versus covert speech | — | ** (p = 0.0010) |
| Lipreading versus covert speech | — | n.s. (p = 0.57) |
| Frequency | *** | *** |
| Hemisphere | *** | *** |
The p values are from Kruskal–Wallis (main effect) or Mann–Whitney U tests (contrasts). n.s., Not significant.
**p < 0.01,
***p < 0.001.
The suppression of N100m in the lipreading and covert-speech conditions became even clearer when the source strengths were computed with respect to the passive still-face condition (Fig. 4, bottom). During both lipreading and covert self-production, N100m was on average suppressed by 7 nA·m (range 3–11 nA·m), approximately similarly at all frequencies (see Table 2).
Table 2.
Results of statistical tests comparing peak N100m source strength differences to still-face condition (Fig. 4, bottom)
| Tested main effect/specific comparison | Three conditions (n = 19) | Four conditions (n = 9) |
|---|---|---|
| Condition | *** | *** |
| Expanding rings versus lipreading | *** | *** |
| Expanding rings versus covert speech | — | *** |
| Lipreading versus covert speech | — | n.s. (p = 0.21) |
| Frequency | n.s. (p = 0.41) | n.s. (p = 0.57) |
| Hemisphere | * (p = 0.010) | * (p = 0.033) |
The p values are from Kruskal–Wallis (main effect) or Mann–Whitney U tests (contrasts). n.s., Not significant.
*p < 0.05,
***p < 0.001.
Effect of visual stimulus onset during lipreading
In a subsequent analysis, only nonoverlapping time ranges (−200 to 100 ms, 100–400 ms, 400–700 ms, 700–1000 ms, 1000–1300 ms) were selected. Figure 5 shows that following the mouth opening gesture in vowel clips, at 700–1000 ms when the mouth was still open, the strength of the auditory response transiently decreased by 10% (∼2 nA·m). In other words, the general suppression effect observed during lipreading transiently increased. A paired Mann–Whitney U test showed a significant difference between time windows 400–700 ms and 700–1000 ms (p = 0.011) and a nearly significant difference between 700–1000 ms and 1000–1300 ms (p = 0.059), as depicted in Figure 5.
Figure 5.

Mean (±SEM) ECD source strengths as a function of lag from video clip start during lipreading condition shows a significant effect of lag. The responses were calculated for 300 ms time ranges with 100 ms steps, but only nonoverlapping time ranges, indicated by filled circle, were used in the analysis. The representative frames shown in top are taken from the middle of the time range. The data points were averaged across tested tone frequencies and hemispheres. The gray area shows the baseline as mean (±SEM) ECD source strength during the lipreading condition across all frequencies and hemispheres with no selective averaging as a function of lag.
Differences in N100m peak latency
Latency differences were found depending on tone frequency: at low-frequency (125–500 Hz) tones and at the highest 8 kHz tone, N100m peaked 5–25 ms later, forming a U-shaped curve as a function of frequency (Fig. 6). At middle frequencies (1000–4000 Hz), N100m peaked at 93–97 ms. No consistent differences were found between the task conditions. The frequency dependency of latency was statistically significant (p < 0.001; p4cond < 0.001). Further, N100m peaked on average 5 ms later in the left than right hemisphere across all conditions (p = 0.003), but this effect failed to reach significance in the subset of subjects tested on all four conditions (average latency prolongation for the left hemisphere 1.7 ms, p4cond = 0.34).
Figure 6.

Mean (±SEM) N100m ECD peak latency from the subset of nine subjects with all four conditions.
Figure 7 shows that following the mouth opening in the video clip, N100m peak latencies were delayed by ∼2 ms at the same 700–1000 ms range where the sources were significantly weaker (Fig. 5). The Mann–Whitney U test showed a significant difference between the 400–700 ms and 700–1000 ms windows (p = 0.029).
Figure 7.

Mean (±SEM) N100m peak latency as a function of lag from video clip start during lipreading condition. Similar to Figure 5, the gray area shows the baseline as mean (±SEM) of N100m peak latency during lipreading condition across all frequencies and hemispheres.
Dipole locations
The N100m source locations did not differ significantly across conditions (p > 0.95; Kruskal–Wallis test; see supplemental Figure S4 (available at www.jneurosci.org as supplemental material), for mean coordinates, see supplemental Table S1, available at www.jneurosci.org as supplemental material). The mean locations of the dipoles corresponded to nonprimary auditory areas (Brodmann area 42) in the supratemporal plane. The dipole coordinates showed a trend to higher intersubject variation in the left than in the right hemisphere but this effect did not reach statistical significance (Levene's test).
Behavioral data
The subjects detected targets similarly during the lipreading [mean hit rate (HR) ± SEM 83.7 ± 2.8%] and expanding-rings (86.1 ± 3.0%) tasks, with no significant difference in performance. The subjects responded ∼230 ms slower during the lipreading task (1293 ± 26 ms vs 1066 ± 25 ms for expanding rings; p < 0.001), when the reaction time was calculated from the video clip start. During the lipreading task, the opening of the mouth on the screen allowed vowels to be identified 40–80 ms (1–2 frames) later than when the ring deformation direction could be judged during the expanding-rings condition (see Materials and Methods). Reaction time (RT) difference, corrected for visual motion onset, was ∼170 ms (879 ± 26 ms vs 706 ± 25 ms; p < 0.001). The discrimination index d′ measure showed a statistically significant (p = 0.046) difference between lipreading (d′ = 3.70 ± 0.17) and expanding rings (d′ = 4.23 ± 0.17) task conditions. As the d′ difference between task conditions was significant, we tested whether any behavioral measure (RT, HR, or d′) would be correlated with the amplitude suppression. We calculated the correlation between the behavioral measures (RT, HR, d′) and N100m amplitude suppression, but no significant correlations emerged (highest correlation for d′ difference vs amplitude suppression at 1000 Hz; p = 0.35, Spearman's ρ = 0.226, explaining ∼5% of the variance). In tests for possible effects of task difficulty on N100m suppression between the lipreading and expanding-rings conditions, the results remained significant when the behavioral measures (RT, HR, d′) were entered as covariates in a separate ANCOVA test.
Discussion
In the present study, we observed that the auditory cortical neuromagnetic N100m response was robustly suppressed during lipreading compared with a visual control task. The suppression was more prominent in the left than the right hemisphere of our right-handed subjects, and it involved all tested sound frequencies that ranged from 125 to 8000 Hz. Because the N100m response arises from the supratemporal plane, lipreading modulated auditory processing at a relatively low cortical level. Notably, the transient N100m suppression effect was time locked to the mouth-opening gesture in the video clip (Fig. 5), and the N100m peak latencies were also prolonged 300–600 ms after mouth opening (Fig. 7), implying a cross-modal inhibitory effect that is partially time locked to the phase of articulation. Despite differences in species, stimuli, and methodology, the present results resemble those documented in nonhuman primates (Ghazanfar et al., 2005), where the multisensory integration effect (enhancement vs suppression) seen in local field potentials (LFPs) depended on the voice-onset times relative to the visual stimulus. Ghazanfar et al. (2005) found response enhancement more likely with short voice-onset times and response suppression more likely with longer voice-onset times.
Convergence of multisensory information in early auditory cortices has important functional consequences (for review, see Schroeder et al., 2003), as it can integrate information from different levels of cortical processing and enhance behavioral performance, for instance detection of speech in noise. What has remained obscure is the origin of the top-down inputs that cause N100/N100m suppression during lipreading. At least three possibilities exist: (1) visual information is relayed to auditory cortex from the visual system, including the multisensory posterior superior temporal sulcus (Schroeder and Foxe, 2002; Cappe and Barone, 2005; Kayser and Logothetis, 2009); (2) the suppression effects during lipreading are due to an efference copy from the speech-production system (Sams et al., 2005; Skipper et al., 2007); (3) visual information is relayed via subcortical routes, e.g., via medial pulvinar or nonspecific thalamic inputs, such as the medial interlaminar nuclei (Cappe et al., 2009a) [for review, see Sherman and Guillery (2002), Hackett et al. (2007), and Cappe et al. (2009b)].
Previous human studies have documented suppressant effects of both overt and covert speech production on the N100m amplitude (Numminen and Curio, 1999; Curio et al., 2000; Houde et al., 2002), but they have not examined the relationship between lipreading and covert speech production. In the present study, N100m was similarly suppressed when the subjects were lipreading silent vowel articulations and when the subjects covertly self-produced the same vowels (Fig. 4). Thus, these results agree with the view that the suppression of auditory cortex is caused by an efference copy (Paus et al., 1996; Curio et al., 2000; Houde et al., 2002; Heinks-Maldonado et al., 2005, 2006; Martikainen et al., 2005; Christoffels et al., 2007) from the speech-production system. Tentatively, such an efference copy could arise during lipreading when the observers do not speak themselves but their inferior frontal gyrus is activated through “mirroring” of the other person's actions (Rizzolatti and Arbib, 1998; Nishitani and Hari, 2002; Rizzolatti and Craighero, 2004). In this specific case, the efference copy could also increase the signal-to-noise ratio of auditory processing through modification of auditory cortex response patterns (Heinks-Maldonado et al., 2005, 2006) during both monitoring of own speech production and lipreading. It is important to realize that suppression of mass-action level responses such as the evoked responses recorded in the present study might reflect more selective and efficient responses from neurons with sparse population coding (Wang et al., 2005; Hromádka et al., 2008; Otazu et al., 2009).
In the present study, we estimated the source locations of the auditory cortical N100m responses using a fixed two-dipole model. The locations were in line with previous studies showing N100m generation in the posterior supratemporal plane (for review, see Hari, 1990). Obviously, a fixed two-dipole model is an oversimplification, as the neuromagnetic N100m is generated by multiple, both temporally and spatially overlapping, distributed sources (Sams et al., 1993). Further, the applied identical source location for tones of different frequencies simplifies the underlying functional organization of the auditory cortex where multiple tonotopic fields are known to exist (Pantev et al., 1995; Rauschecker et al., 1995; Kaas and Hackett, 2000; Lütkenhöner et al., 2003; Talavage et al., 2004). Since N100m reflects an auditory processing stage that occurs after brainstem and middle-latency cortical responses, we cannot even exclude the possibility of contributions from lower levels of the auditory pathway (Papanicolaou et al., 1986; Musacchia et al., 2006).
The effects observed here for the neuromagnetic N100m response were for incongruent stimuli, as the lipreading task had no relevance for the asynchronously presented tones with different frequencies. This finding contradicts previous findings where audiovisual interactions were observed only when visual motion preceded the sound presentation (Stekelenburg and Vroomen, 2007). The suppressions of auditory-evoked N100m responses were probably not caused by visual attention or visual motion (Hertrich et al., 2009) alone, as shown by the lack of suppression during the control task with expanding rings compared with the silent lipreading task. Further, a concurrent visual task has previously been shown to have no effect on N100 amplitude to auditory stimuli, but the effect has been restricted to visually evoked responses (Woods et al., 1992) or enhancements of auditory responses at latencies over 200 ms (Busse et al., 2005). Interestingly, a memory task using visual stimuli actually increases the N100m amplitude to task-irrelevant tones (Valtonen et al., 2003). Together, these results suggest that visual attention itself or an increase in visual attentional demand should actually enhance rather than suppress tone-evoked responses.
Our analysis on temporal asynchrony between visual articulations and tones showed that the auditory cortex was transiently modulated by the dynamic mouth opening gesture, in addition to an ongoing suppression by the lipreading task. The time scale of this effect was in line with the relatively long temporal window of integration of several hundred milliseconds for visual speech input (e.g., Massaro et al., 1996; van Wassenhove et al., 2007). Importantly, this suppression effect could in part explain discrepancies between previous studies showing either auditory response enhancement (Giard and Peronnet, 1999; Hertrich et al., 2007), suppression (Klucharev et al., 2003; Besle et al., 2004; Jääskeläinen et al., 2004; van Wassenhove et al., 2005), or no effect (Miki et al., 2004) during audiovisual stimulation compared with auditory-only responses. Some of the recent studies in humans have addressed this issue by presenting audiovisual stimuli with variable asynchrony in addition to simultaneous presentation (Stekelenburg and Vroomen, 2005; van Atteveldt et al., 2007). Our findings support the notion that when analyzing the audiovisual integration effects elicited by both congruent and incongruent stimuli the synchrony of the auditory and visual stimuli should be carefully controlled. Theoretically, the timing-dependent suppression effect could also be due to reduced synchrony of neuronal signaling underlying the N100m response, in line with recent results in monkeys demonstrating resetting of the phase of ongoing auditory cortex activity by somatosensory input (Lakatos et al., 2007; Schroeder et al., 2008). However, the present study was not designed to effectively address this hypothesis.
In conclusion, the observed transient modulation after mouth opening, together with the similarity of the suppressant effects caused by covert speech and lipreading, suggests that an efference copy signal from the speech-production system underlies the N100m response suppression during lipreading.
Footnotes
This study was financially supported by the Academy of Finland (National Programme for Centers of Excellence 2006-2011, Grants 213464, 213470, 213938, FiDiPro program), the Finnish Graduate School of Neuroscience, the Emil Aaltonen Foundation, the U.S. National Science Foundation (BCS-0519127), and the U.S. National Institutes of Health (R01 NS052494).
References
- Besle J, Fort A, Delpuech C, Giard MH. Bimodal speech: early suppressive visual effects in human auditory cortex. Eur J Neurosci. 2004;20:2225–2234. doi: 10.1111/j.1460-9568.2004.03670.x. [DOI] [PMC free article] [PubMed] [Google Scholar]
- Busse L, Roberts KC, Crist RE, Weissman DH, Woldorff MG. The spread of attention across modalities and space in a multisensory object. Proc Natl Acad Sci U S A. 2005;102:18751–18756. doi: 10.1073/pnas.0507704102. [DOI] [PMC free article] [PubMed] [Google Scholar]
- Calvert GA, Bullmore ET, Brammer MJ, Campbell R, Williams SCR, McGuire PK, Woodruff PWR, Iversen SD, David AS. Activation of auditory cortex during silent lipreading. Science. 1997;276:593–596. doi: 10.1126/science.276.5312.593. [DOI] [PubMed] [Google Scholar]
- Cappe C, Barone P. Heteromodal connections supporting multisensory integration at low levels of cortical processing in the monkey. Eur J Neurosci. 2005;22:2886–2902. doi: 10.1111/j.1460-9568.2005.04462.x. [DOI] [PubMed] [Google Scholar]
- Cappe C, Morel A, Barone P, Rouiller EM. The thalamocortical projection systems in primate: an anatomical support for multisensory and sensorimotor interplay. Cereb Cortex. 2009a;19:2025–2037. doi: 10.1093/cercor/bhn228. [DOI] [PMC free article] [PubMed] [Google Scholar]
- Cappe C, Rouiller EM, Barone P. Multisensory anatomical pathways. Hear Res. 2009b;258:28–36. doi: 10.1016/j.heares.2009.04.017. [DOI] [PubMed] [Google Scholar]
- Christoffels IK, Formisano E, Schiller NO. Neural correlates of verbal feedback processing: an fMRI study employing overt speech. Hum Brain Mapp. 2007;28:868–879. doi: 10.1002/hbm.20315. [DOI] [PMC free article] [PubMed] [Google Scholar]
- Curio G, Neuloh G, Numminen J, Jousmäki V, Hari R. Speaking modifies voice-evoked activity in the human auditory cortex. Hum Brain Mapp. 2000;9:183–191. doi: 10.1002/(SICI)1097-0193(200004)9:4<183::AID-HBM1>3.0.CO;2-Z. [DOI] [PMC free article] [PubMed] [Google Scholar]
- Falchier A, Clavagnier S, Barone P, Kennedy H. Anatomical evidence of multimodal integration in primate striate cortex. J Neurosci. 2002;22:5749–5759. doi: 10.1523/JNEUROSCI.22-13-05749.2002. [DOI] [PMC free article] [PubMed] [Google Scholar]
- Ghazanfar AA, Maier JX, Hoffman KL, Logothetis NK. Multisensory integration of dynamic faces and voices in rhesus monkey auditory cortex. J Neurosci. 2005;25:5004–5012. doi: 10.1523/JNEUROSCI.0799-05.2005. [DOI] [PMC free article] [PubMed] [Google Scholar]
- Giard MH, Peronnet F. Auditory-visual integration during multimodal object recognition in humans: a behavioral and electrophysiological study. J Cogn Neurosci. 1999;11:473–490. doi: 10.1162/089892999563544. [DOI] [PubMed] [Google Scholar]
- Hackett TA, De La Mothe LA, Ulbert I, Karmos G, Smiley J, Schroeder CE. Multisensory convergence in auditory cortex, II. Thalamocortical connections of the caudal superior temporal plane. J Comp Neurol. 2007;502:924–952. doi: 10.1002/cne.21326. [DOI] [PubMed] [Google Scholar]
- Hämäläinen M, Hari R, Ilmoniemi RJ, Knuutila J, Lounasmaa OV. Magnetoencephalography—theory, instrumentation, and applications to noninvasive studies of the working human brain. Rev Mod Phys. 1993;65:413–497. [Google Scholar]
- Hari R. The neuromagnetic method in the study of the human auditory cortex. In: Grandori F, Hoke M, Romani G, editors. Auditory evoked magnetic fields and potentials. Advances in audiology. Vol 6. Basel: Karger; 1990. pp. 222–282. [Google Scholar]
- Heinks-Maldonado TH, Mathalon DH, Gray M, Ford JM. Fine-tuning of auditory cortex during speech production. Psychophysiology. 2005;42:180–190. doi: 10.1111/j.1469-8986.2005.00272.x. [DOI] [PubMed] [Google Scholar]
- Heinks-Maldonado TH, Nagarajan SS, Houde JF. Magnetoencephalographic evidence for a precise forward model in speech production. Neuroreport. 2006;17:1375–1379. doi: 10.1097/01.wnr.0000233102.43526.e9. [DOI] [PMC free article] [PubMed] [Google Scholar]
- Hertrich I, Mathiak K, Lutzenberger W, Menning H, Ackermann H. Sequential audiovisual interactions during speech perception: a whole-head MEG study. Neuropsychologia. 2007;45:1342–1354. doi: 10.1016/j.neuropsychologia.2006.09.019. [DOI] [PubMed] [Google Scholar]
- Hertrich I, Mathiak K, Lutzenberger W, Ackermann H. Time course of early audiovisual interactions during speech and nonspeech central auditory processing: a magnetoencephalography study. J Cogn Neurosci. 2009;21:259–274. doi: 10.1162/jocn.2008.21019. [DOI] [PubMed] [Google Scholar]
- Houde JF, Nagarajan SS, Sekihara K, Merzenich MM. Modulation of the auditory cortex during speech: an MEG study. J Cogn Neurosci. 2002;14:1125–1138. doi: 10.1162/089892902760807140. [DOI] [PubMed] [Google Scholar]
- Hromádka T, DeWeese MR, Zador AM. Sparse representation of sounds in the unanesthetized auditory cortex. PLoS Biol. 2008;6:e16. doi: 10.1371/journal.pbio.0060016. [DOI] [PMC free article] [PubMed] [Google Scholar]
- Jääskeläinen IP, Ojanen V, Ahveninen J, Auranen T, Levänen S, Möttönen R, Tarnanen I, Sams M. Adaptation of neuromagnetic N1 responses to phonetic stimuli by visual speech in humans. Neuroreport. 2004;15:2741–2744. [PubMed] [Google Scholar]
- Jääskeläinen IP, Ahveninen J, Belliveau JW, Raij T, Sams M. Short-term plasticity in auditory cognition. Trends Neurosci. 2007;30:653–661. doi: 10.1016/j.tins.2007.09.003. [DOI] [PubMed] [Google Scholar]
- Jääskeläinen IP, Kauramäki J, Tujunen J, Sams M. Formant transition-specific adaptation by lipreading of left auditory cortex N1m. Neuroreport. 2008;19:93–97. doi: 10.1097/WNR.0b013e3282f36f7a. [DOI] [PubMed] [Google Scholar]
- Kaas JH, Hackett TA. Subdivisions of auditory cortex and processing streams in primates. Proc Natl Acad Sci U S A. 2000;97:11793–11799. doi: 10.1073/pnas.97.22.11793. [DOI] [PMC free article] [PubMed] [Google Scholar]
- Kayser C, Logothetis NK. Directed interactions between auditory and superior temporal cortices and their role in sensory integration. Front Integr Neurosci. 2009;3:7. doi: 10.3389/neuro.07.007.2009. [DOI] [PMC free article] [PubMed] [Google Scholar]
- Klucharev V, Möttönen R, Sams M. Electrophysiological indicators of phonetic and non-phonetic multisensory interactions during audiovisual speech perception. Brain Res Cogn Brain Res. 2003;18:65–75. doi: 10.1016/j.cogbrainres.2003.09.004. [DOI] [PubMed] [Google Scholar]
- Lakatos P, Chen CM, O'Connell MN, Mills A, Schroeder CE. Neuronal oscillations and multisensory interaction in primary auditory cortex. Neuron. 2007;53:279–292. doi: 10.1016/j.neuron.2006.12.011. [DOI] [PMC free article] [PubMed] [Google Scholar]
- Lewis JW, Van Essen DC. Corticocortical connections of visual, sensorimotor, and multimodal processing areas in the parietal lobe of the macaque monkey. J Comp Neurol. 2000;428:112–137. doi: 10.1002/1096-9861(20001204)428:1<112::aid-cne8>3.0.co;2-9. [DOI] [PubMed] [Google Scholar]
- Loveless N, Hari R, Hämäläinen M, Tiihonen J. Evoked responses of human auditory cortex may be enhanced by preceding stimuli. Electroencephalogr Clin Neurophysiol. 1989;74:217–227. doi: 10.1016/0013-4694(89)90008-4. [DOI] [PubMed] [Google Scholar]
- Lütkenhöner B, Krumbholz K, Seither-Preisler A. Studies of tonotopy based on wave N100 of the auditory evoked field are problematic. Neuroimage. 2003;19:935–949. doi: 10.1016/s1053-8119(03)00172-1. [DOI] [PubMed] [Google Scholar]
- MacSweeney M, Amaro E, Calvert GA, Campbell R, David AS, McGuire P, Williams SC, Woll B, Brammer MJ. Silent speechreading in the absence of scanner noise: an event-related fMRI study. Neuroreport. 2000;11:1729–1733. doi: 10.1097/00001756-200006050-00026. [DOI] [PubMed] [Google Scholar]
- Martikainen MH, Kaneko K, Hari R. Suppressed responses to self-triggered sounds in the human auditory cortex. Cereb Cortex. 2005;15:299–302. doi: 10.1093/cercor/bhh131. [DOI] [PubMed] [Google Scholar]
- Massaro DW, Cohen MM, Smeele PMT. Perception of asynchronous and conflicting visual and auditory speech. J Acoust Soc Am. 1996;100:1777–1786. doi: 10.1121/1.417342. [DOI] [PubMed] [Google Scholar]
- Miki K, Watanabe S, Kakigi R. Interaction between auditory and visual stimulus relating to the vowel sounds in the auditory cortex in humans: a magnetoencephalographic study. Neurosci Lett. 2004;357:199–202. doi: 10.1016/j.neulet.2003.12.082. [DOI] [PubMed] [Google Scholar]
- Musacchia G, Sams M, Nicol T, Kraus N. Seeing speech affects acoustic information processing in the human brainstem. Exp Brain Res. 2006;168:1–10. doi: 10.1007/s00221-005-0071-5. [DOI] [PMC free article] [PubMed] [Google Scholar]
- Nishitani N, Hari R. Viewing lip forms: cortical dynamics. Neuron. 2002;36:1211–1220. doi: 10.1016/s0896-6273(02)01089-9. [DOI] [PubMed] [Google Scholar]
- Nishitani N, Schürmann M, Amunts K, Hari R. Broca's region: from action to language. Physiology. 2005;20:60–69. doi: 10.1152/physiol.00043.2004. [DOI] [PubMed] [Google Scholar]
- Numminen J, Curio G. Differential effects of overt, covert and replayed speech on vowel-evoked responses of the human auditory cortex. Neurosci Lett. 1999;272:29–32. doi: 10.1016/s0304-3940(99)00573-x. [DOI] [PubMed] [Google Scholar]
- Otazu GH, Tai LH, Yang Y, Zador AM. Engaging in an auditory task suppresses responses in auditory cortex. Nat Neurosci. 2009;12:646–654. doi: 10.1038/nn.2306. [DOI] [PMC free article] [PubMed] [Google Scholar]
- Pantev C, Bertrand O, Eulitz C, Verkindt C, Hampson S, Schuierer G, Elbert T. Specific tonotopic organizations of different areas of the human auditory cortex revealed by simultaneous magnetic and electric recordings. Electroencephalogr Clin Neurophysiol. 1995;94:26–40. doi: 10.1016/0013-4694(94)00209-4. [DOI] [PubMed] [Google Scholar]
- Papanicolaou AC, Raz N, Loring DW, Eisenberg HM. Brain stem evoked response suppression during speech production. Brain Lang. 1986;27:50–55. doi: 10.1016/0093-934x(86)90004-0. [DOI] [PubMed] [Google Scholar]
- Paus T, Perry DW, Zatorre RJ, Worsley KJ, Evans AC. Modulation of cerebral blood flow in the human auditory cortex during speech: role of motor-to-sensory discharges. Eur J Neurosci. 1996;8:2236–2246. doi: 10.1111/j.1460-9568.1996.tb01187.x. [DOI] [PubMed] [Google Scholar]
- Pekkola J, Ojanen V, Autti T, Jääskeläinen IP, Möttönen R, Tarkiainen A, Sams M. Primary auditory cortex activation by visual speech: an fMRI study at 3 T. Neuroreport. 2005;16:125–128. doi: 10.1097/00001756-200502080-00010. [DOI] [PubMed] [Google Scholar]
- Rauschecker JP, Tian B, Hauser M. Processing of complex sounds in the macaque nonprimary auditory cortex. Science. 1995;268:111–114. doi: 10.1126/science.7701330. [DOI] [PubMed] [Google Scholar]
- Rizzolatti G, Arbib MA. Language within our grasp. Trends Neurosci. 1998;21:188–194. doi: 10.1016/s0166-2236(98)01260-0. [DOI] [PubMed] [Google Scholar]
- Rizzolatti G, Craighero L. The mirror-neuron system. Annu Rev Neurosci. 2004;27:169–192. doi: 10.1146/annurev.neuro.27.070203.144230. [DOI] [PubMed] [Google Scholar]
- Rockland KS, Ojima H. Multisensory convergence in calcarine visual areas in macaque monkey. Int J Psychophysiol. 2003;50:19–26. doi: 10.1016/s0167-8760(03)00121-1. [DOI] [PubMed] [Google Scholar]
- Sams M, Hari R, Rif J, Knuutila J. The human auditory sensory memory trace persists about 10 sec: neuromagnetic evidence. J Cogn Neurosci. 1993;5:363–370. doi: 10.1162/jocn.1993.5.3.363. [DOI] [PubMed] [Google Scholar]
- Sams M, Möttönen R, Sihvonen T. Seeing and hearing others and oneself talk. Brain Res Cogn Brain Res. 2005;23:429–435. doi: 10.1016/j.cogbrainres.2004.11.006. [DOI] [PubMed] [Google Scholar]
- Schroeder CE, Foxe JJ. The timing and laminar profile of converging inputs to multisensory areas of the macaque neocortex. Brain Res Cogn Brain Res. 2002;14:187–198. doi: 10.1016/s0926-6410(02)00073-3. [DOI] [PubMed] [Google Scholar]
- Schroeder CE, Smiley J, Fu KG, McGinnis T, O'Connell MN, Hackett TA. Anatomical mechanisms and functional implications of multisensory convergence in early cortical processing. Int J Psychophysiol. 2003;50:5–17. doi: 10.1016/s0167-8760(03)00120-x. [DOI] [PubMed] [Google Scholar]
- Schroeder CE, Lakatos P, Kajikawa Y, Partan S, Puce A. Neuronal oscillations and visual amplification of speech. Trends Cogn Sci. 2008;12:106–113. doi: 10.1016/j.tics.2008.01.002. [DOI] [PMC free article] [PubMed] [Google Scholar]
- Sherman SM, Guillery RW. The role of the thalamus in the flow of information to the cortex. Philos Trans R Soc Lond B Biol Sci. 2002;357:1695–1708. doi: 10.1098/rstb.2002.1161. [DOI] [PMC free article] [PubMed] [Google Scholar]
- Skipper JI, van Wassenhove V, Nusbaum HC, Small SL. Hearing lips and seeing voices: how cortical areas supporting speech production mediate audiovisual speech perception. Cereb Cortex. 2007;17:2387–2399. doi: 10.1093/cercor/bhl147. [DOI] [PMC free article] [PubMed] [Google Scholar]
- Steinstraeter O, Teismann IK, Wollbrink A, Suntrup S, Stoeckigt K, Dziewas R, Pantev C. Local sphere-based co-registration for SAM group analysis in subjects without individual MRI. Exp Brain Res. 2009;193:387–396. doi: 10.1007/s00221-008-1634-z. [DOI] [PubMed] [Google Scholar]
- Stekelenburg JJ, Vroomen J. An event-related potential investigation of the time-course of temporal ventriloquism. Neuroreport. 2005;16:641–644. doi: 10.1097/00001756-200504250-00025. [DOI] [PubMed] [Google Scholar]
- Stekelenburg JJ, Vroomen J. Neural correlates of multisensory integration of ecologically valid audiovisual events. J Cogn Neurosci. 2007;19:1964–1973. doi: 10.1162/jocn.2007.19.12.1964. [DOI] [PubMed] [Google Scholar]
- Sumby WH, Pollack I. Visual contribution to speech intelligibility in noise. J Acoust Soc Am. 1954;26:212–215. [Google Scholar]
- Talavage TM, Sereno MI, Melcher JR, Ledden PJ, Rosen BR, Dale AM. Tonotopic organization in human auditory cortex revealed by progressions of frequency sensitivity. J Neurophysiol. 2004;91:1282–1296. doi: 10.1152/jn.01125.2002. [DOI] [PubMed] [Google Scholar]
- Valtonen J, May P, Mäkinen V, Tiitinen H. Visual short-term memory load affects sensory processing of irrelevant sounds in human auditory cortex. Brain Res Cogn Brain Res. 2003;17:358–367. doi: 10.1016/s0926-6410(03)00137-x. [DOI] [PubMed] [Google Scholar]
- van Atteveldt NM, Formisano E, Blomert L, Goebel R. The effect of temporal asynchrony on the multisensory integration of letters and speech sounds. Cereb Cortex. 2007;17:962–974. doi: 10.1093/cercor/bhl007. [DOI] [PubMed] [Google Scholar]
- van Wassenhove V, Grant KW, Poeppel D. Visual speech speeds up the neural processing of auditory speech. Proc Natl Acad Sci U S A. 2005;102:1181–1186. doi: 10.1073/pnas.0408949102. [DOI] [PMC free article] [PubMed] [Google Scholar]
- van Wassenhove V, Grant KW, Poeppel D. Temporal window of integration in auditory-visual speech perception. Neuropsychologia. 2007;45:598–607. doi: 10.1016/j.neuropsychologia.2006.01.001. [DOI] [PubMed] [Google Scholar]
- Wang X, Lu T, Snider RK, Liang L. Sustained firing in auditory cortex evoked by preferred stimuli. Nature. 2005;435:341–346. doi: 10.1038/nature03565. [DOI] [PubMed] [Google Scholar]
- Warren RM, Riener KR, Bashford JA, Jr, Brubaker BS. Spectral redundancy: intelligibility of sentences heard through narrow spectral slits. Percept Psychophys. 1995;57:175–182. doi: 10.3758/bf03206503. [DOI] [PubMed] [Google Scholar]
- Woods DL, Alho K, Algazi A. Intermodal selective attention. I. Effects on event-related potentials to lateralized auditory and visual stimuli. Electroencephalogr Clin Neurophysiol. 1992;82:341–355. doi: 10.1016/0013-4694(92)90004-2. [DOI] [PubMed] [Google Scholar]