Abstract
Acute physical stresses can occur in the procurement and isolation process and potentially can contribute to islet death or malfunction upon transplantation. A contractional flow device, previously used to subject suspended cells to well-defined hydrodynamic forces, has been modified and used to assess the vulnerability of porcine islets of Langerhans to hydrodynamic forces. The flow profiles and velocity gradients in this modified device were modeled using commercial CFD software and characterized, as in previous studies, with the scalar parameter, energy dissipation rate (EDR). Porcine islets were stressed in a single pass at various stress levels (i.e., values of EDR). Membrane integrity, oxygen uptake rate, caspase 3/7 activity, and insulin release were not affected by the levels of fluid stress tested up to an EDR of 2 × 10³ W/m3. Visual observation of the stressed islets suggested that cells at the islet exterior were peeled away at EDR greater than 10,000 W/m3, however, this observation could not be confirmed using image analysis software, which determined the ratio of surface perimeter to total area. The result of this study suggests an upper limit in fluid stress to which islets can be subjected. Such upper limits assist in the design and operation of future islet processing equipment and processes.
Keywords: energy dissipation rate, islets of Langerhans, computational fluid dynamics, shear stress
Introduction
Diabetes is a heterogeneous category of metabolic diseases that cause hyperglycemia, or elevated blood sugar. The most prevalent form, type 2 diabetes, involves both deficient insulin secretion as well as insulin resistance. Insulin resistance refers to the reduced effectiveness of insulin to control the uptake of glucose by tissues, especially muscle and liver. In contrast, type 1 diabetes accounts for 5–10% of diagnosed diabetics and is characterized by autoimmune destruction of the insulin-producing islet beta cells. Type 1 diabetics secrete no insulin and so require exogenous insulin to survive. The consequences of chronic hyperglycemia include retinopathy (vision loss), nephropathy (kidney damage), and peripheral neuropathy, which lead to nerve damage and, eventually, amputation (Gavin et al., 2003). It has been suggested that treatments that reverse hyperglycemia may retard or even reverse these diabetic complications (Markmann et al., 2003).
Diabetes may be reversed by transplanting purified pancreatic islets (Berney et al., 2001). Islets are transplanted by percutaneous infusion of the portal vein; they lodge in the portal microcirculatory system and revascularize (Blake and Cagliero, 2002). Typically, donor pancreata are dissected from the duodenum and canulated at the main pancreatic duct through which digestive enzymes are excreted. When all the accessory ducts are clamped, the organ is distended by the injection of a solution of collagenase enzyme through the main duct. The dilated organ is then placed in a conical “Ricordi” chamber, through which heated enzyme solution is circulated. Glass or ceramic marbles inside the chamber coax liberated islets from the organ.
Islet transplantation, that is, procurement, digestion, purification, and injection, exposes the pancreatic tissues to various chemical and hydrodynamic challenges such as anoxia, metabolic enzymes, centrifugation, peristaltic suction, and shear and extensional stresses. It is estimated that cellular mortality resulting from these stresses affects as many as half of transplanted islets. This observation raises the basic question: What is the highest level of stress that an islet can sustain before its insulin regulatory function is impaired? A further question: How can these stresses be further quantified?
Cellular Response to Hydrodynamic Forces
The field of cellular response to an external hydrodynamic force has received a considerable amount of attention, especially cells of human medical relevance, primarily focused on human endothelial cells; therefore a complete review is not possible in this report. However, it can be stated that cellular responses can range from no effect to significant physiological, genetic, and finally, rapid cell lysis (Haga et al., 2007; Li et al., 2005).
With respect to cells suspended in medium, in vitro, and subjected to hydrodynamic forces, particularly those processed for transplantation, significantly less is known. A majority of the studies have focused on cellular necrosis and/or apoptosis in response to mechanical and chemical stressors (Goswami et al., 1999; Laken and Leonard, 2001; Mastrangelo et al., 2000; Zhangi et al., 2000). In an attempt to characterize and quantify the typically complex hydrodynamic forces in bioprocesses, energy dissipation rate (EDR) has been proposed as a scalar value to characterize these hydrodynamic conditions (Gregoriades et al., 2000; Mollet et al., 2004). EDR, in units of W/m3, accounts for shear and extensional forces within viscous fluid flows, either laminar or turbulent; it may be thought of as the rate at which work is done on a fluid element (Mollet et al., 2007).
For an incompressible Newtonian fluid EDR, ε, is defined as (Bird et al., 2001):
| (1) |
where τ is the stress tensor, μ is the viscosity, ▽U is the velocity gradient tensor, and ▽UT is the transpose of ▽U. This function may be expanded into an algebraic form that can be solved by commercial computational fluid dynamics (CFD) solvers such as Fluent® and CFX®:
| (2) |
Experimental Device to Relate EDR to Cell Damage
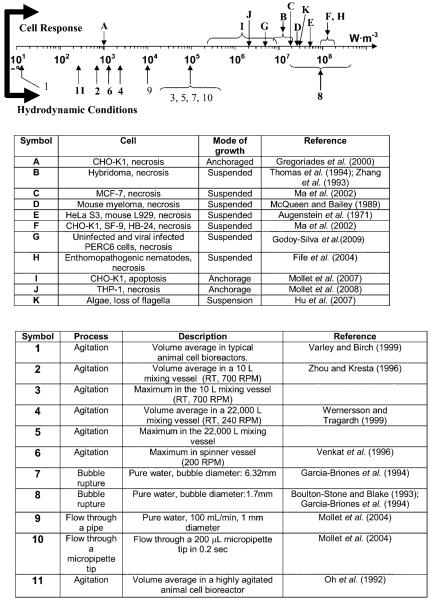
Assuming that both shear and extensional hydrodynamic forces are damaging to cells and that CFD packages can provide quantitative estimates of these forces in specific geometries and flow conditions, a microfluidic contraction device was developed (Ma et al., 2002), and subsequently improved (Mollet et al., 2007), which is informally referred to as a “torture chamber,” TC. Studies of subjecting cells to hydrodynamic forces in the TC have been conducted on a number of commonly used mammalian cell lines (CHO, SF-9, hybridoma), human cancer lines (MCF-7, THP-1), and less common algae and nematode lines (Fife et al., 2004; Hu et al., 2007). With respect to this current report, CHO cells attached to microcarriers were also studied. Figure 1, adapted from Mollet et al. (2007), summarizes the effect of EDR on these various cell types.
Figure 1.
Summary of the effect of a range of magnitudes of EDR on various cells types (above the line) and typical values of EDR in various bioprocessing equipment (adapted from Mollet et al., 2007).
While most suspended cell lines lose their membrane integrity at EDR greater than 107 W/m3, anchored CHO cells have a much lower EDR threshold than suspended cultures. Specifically, at an EDR greater than 103 W/m3, CHO cells bound to 175 μm Cytodex® 3 microcarriers (Pharmacia Fine Chemicals, Piscataway, NJ) were sheared away from the microcarriers (Gregoriades et al., 2000). This is consistent with estimates of EDR made by Venkat et al. (1996) who removed CHO cells, attached to microcarriers, as a result of the physical agitation in a spinner vessel. Given that a typical islet is about 150 μm across, it is plausible to assume that this same level of EDR, roughly 103 W/m3, will disaggregate the constituent cells of an islet.
With this background, the objective of this study was to determine the level of EDR that would begin to damage islets. As with any stress response study, a key aspect of the study is the type and accuracy of the assays used to measure the stress response. In this study we assayed for metabolic activity, membrane integrity, and caspase activation. Islets were also inspected visually and by image analysis to corroborate any damage caused by EDR exposure.
Materials and Methods
Contractional Flow Device
The contractional flow device, or “Torture Chamber” (TC), used in this study was specifically designed for cell clusters such as islets. It was based on previous designs for suspended cells (Mollet et al., 2007), consisting of a 760 μm thick machined stainless steel, SS, plate clamped between two PMMA blocks (Fig. 2). The plate was machined by CCP Tooling Technologies, Inc. (Columbus, OH). The channel throat was 762 μm across, approximating a symmetrical contracting throttle. This throttle was significantly larger than previous designs, which were only 200–300 μm at the throttle. The upper block was drilled to provide 45° inlet and outlet fluid ports to the steel plate. A photograph of the TC is presented in Figure 2A; Figure 2B provides a schematic diagram with dimensions.
Figure 2.
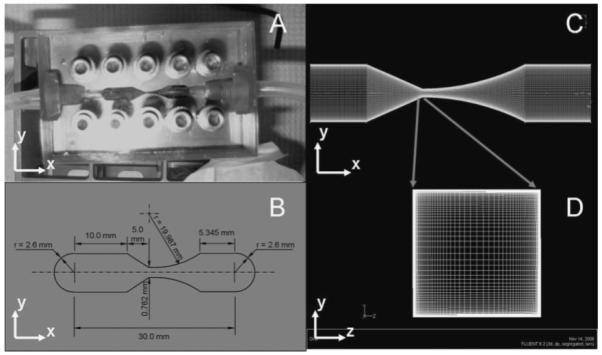
A: Photograph and (B) schematic of the 762 μm torture chamber. The channel was modeled in CFD software with 2,800,000 nodes (C) using a 90 × 90 progressive nod grid at the throttle (D).
Computation Fluid Dynamic Simulations
The internal geometry of the TC was modeled as a 3D grid of approximately 2.8 × 10⁶ total nodes and entered into the Fluent® preprocessor, Gambit®. Velocity profiles within the TC of a liquid, modeled as water, were solved for varying flow rates with Fluent® 6.2.16, 3ddp, in three dimensions utilizing parallel processing. The distribution of these nodes can be seen in Figure 2C, D. The exploded view of the throttle plane shows the progressive meshing scheme in which there is a greater mesh density at the contact walls where the flow profiles require greater resolution.
The simulations used the segregated, implicit, solver model without heating effects. Laminar flow and viscous fluid models were assumed. The fluid inlet was modeled as a constant velocity inlet; the outlet at ambient pressure. The solution discretization values were set to standard pressure, simple pressure–velocity coupling, and second order upwind momentum. The under-relaxation factors were kept at default values except for momentum, which was reduced as needed to speed convergence of the highest flow simulation (100 mL/min). Solution convergence was accepted when all residuals fell below 1 × 10⁻⁶ which usually occurred after between 1,000 and 10,000 iterations. Simulations were carried out on a dual Quad-core Xeon® (8 processor) Dell® workstation with 3 GB system memory and 6 GB swap file.
Determination of EDR
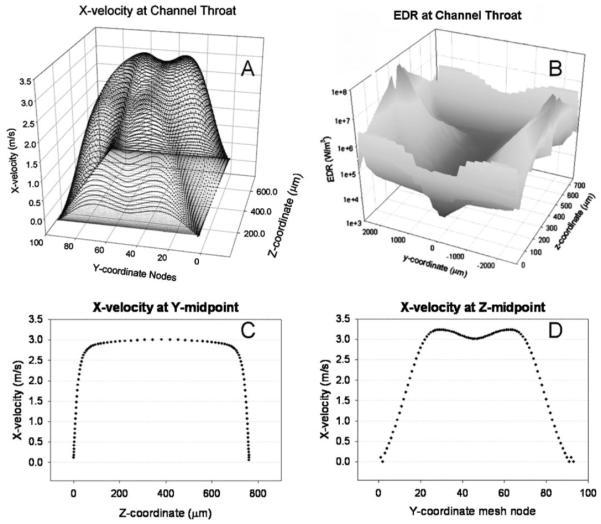
As in previous reports (Mollet et al., 2007), the progress of inert, 10 μm, particles was modeled as they traversed the TC. Figure 3A presents the x-velocity at the channel throat, which is consistent with expectations: particles move more quickly near the middle of the channel and accelerate as they approach the throttle. Along the z-axis (Fig. 2) there is a pure plug flow along the y-axis centerline (Fig. 3C). Along the contracting y-axis the fluid velocity dips slightly at the midpoint (Fig. 3D). This is believed to be due to the sloping walls pushing fluid toward the middle of the channel. We attempted to simulate larger particles (on the order 100 μm); however the simulated particle exhibited unrealistic behavior by erratically bouncing off the walls.
Figure 3.
Fluent® velocity and EDR simulation results for flow at 100 mL/min. Fluid velocity is highest at the center of the channel (A) but EDR is greatest near the channel walls (B). Along the z-coordinate (C) the forward flow is well developed while along the y-coordinate (D) the narrowing channel walls distort the typical plug flow profile.
As in previous simulations (Mollet et al., 2007), a user defined function within Fluent® was utilized to calculate the partial derivatives of the velocity, and corresponding EDR values at each node location. While the absolute values of EDR are lower than those obtained in simulations of the 230 μm channel, the same general distribution of high EDR values from extensional flow, prior to the entrance of the flow contraction as well as high EDR from shear along the walls of the channel, were observed. This association of EDR values with each node point allows EDR profiles for each of the tracked particles as they progressed through the mesh. These data were subsequently exported to data files. A maximum EDR was then assigned to each tracked particle by comparing the local EDR of every node along its flow path. Histograms of the maximum EDR experienced by a simulated particle are shown in Figure 4.
Figure 4.
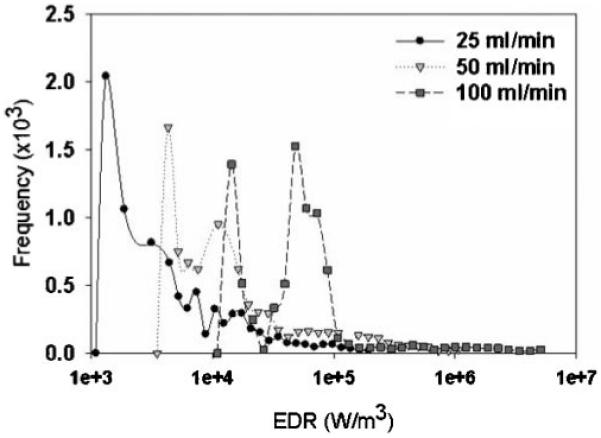
Log-bin histogram of the maximum EDR that each simulated particle experienced as it flowed through the TC at a flow rate of 25, 50, and 100 mL/min.
Since Fluent® converges at nodal points, the mesh was optimized such that nodes were concentrated near the walls, where velocity gradients are typically the highest and the need for a precise solution greatest. The mesh density was left lower in the bulk interior regions to reduce the computing load. This scheme is adequate for quantitative descriptions of the velocity profile within the TC, but causes difficulties for EDR assessment; a simple tally of every calculated EDR skews the statistic toward the extreme, simply because there are so many node points close to the walls where EDR is highest. Thus, the meshing scheme that bolstered the accuracy of the velocity profiles was not idealfor finding the mean spatial EDR to which most cells and islets are exposed.
This effect has been ameliorated (Mollet et al., 2007) by ignoring mesh points within 10 μm of the TC walls, i.e., the approximate diameter of a mammalian cell. This restriction normalized the contribution of mesh points closer to an even distribution of EDR within the TC volume and was used in the creation of the histograms in Figure 4. The median value of the maximum EDR that a simulated particle experienced as it flows through the TC from each histogram at a given flow rate was found to be proportional to volumetric flow rate, as expected (Fig. 5).
Figure 5.
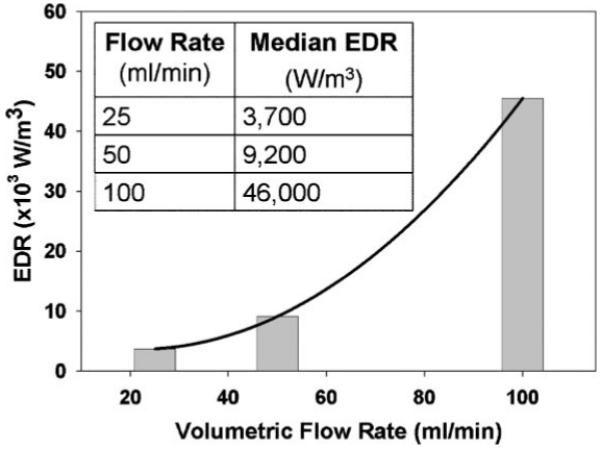
The median EDR from the histograms presented in Figure 6, as function of the volumetric flow rate.
Islet Isolation and Purification
Porcine islets from five donor animals were purified via density gradient from digested splenic lobes as per the standard protocol (Kirchhof et al., 2004) at the Schulze Diabetes Institute of the University of Minnesota (Minneapolis, MN). Freshly purified islets were stored in serum-free E199 medium for approximately 2 h prior to evaluation.
Operation of Torture Chamber
Purified islet suspensions were drawn from manually agitated 50 mL conical centrifuge tubes through the torture chamber with a 60 mL Harvard syringe pump (Harvard Apparatus, Holliston, MA), operating between 25 and 100 mL/min. The torture chamber was connected to the syringe pump with 3/8” OD silicon tubing. The centrifuge tube was manually agitated to minimize islet settling. Samples used in the torture chamber were usually 15–20 mL in volume with concentrations of 500–700 islet equivalents (IEQ)/mL. The torture chamber and tubing were primed before use with E199 medium.
Islet Health Assays
The ubiquitous lactate dehydrogenase (LDH) viability assay could not be used in this study since LDH is not expressed at a significant level in islet cells (Sekine et al., 1994). Instead, the following assays were used.
Oxygen Consumption Rate (OCR)
OCR was measured as previously described (Papas et al., 2007). Greater values of OCR normalized to cellular DNA imply greater tissue viability. Briefly, islets were suspended in DMEM containing 4.5 g/L glucose and 0.6 g/L l-glutamine without serum and supplemented with 100 μg/mL penicillin, 100 μg/mL streptomycin, and 10 mM HEPES. These islet suspensions were then placed in a 200-μL stirred titanium chamber (Micro Oxygen Uptake System, FO/SYSZ-P250, Instech Laboratories, Plymouth Meeting, PA) maintained at 37°C. After the chamber was sealed, the time dependent oxygen partial pressure (pO2) within the chamber was recorded with a fluorescence-based oxygen sensor (Ocean Optics, Dunedin, FL), and the data at high pO2 were fit to a straight line. The maximal OCR was evaluated from
| (3) |
where ΔpO2/Δt is the data slope, Vch is the chamber volume, and α is the Bunsen solubility coefficient for oxygen in medium (Avgoustiniatos et al., 2007).
FDA-PI Viability
FDA/PI is a membrane integrity assay that uses two dyes to differentiate between intact and compromised cellular membranes. Measures of fluorescence are reported in terms of percent viability.
Caspase Assay
Caspase 3/7 concentrations were determined via the Promega APO-ONE® assay kit. These were normalized to DNA as assayed by PicoGreen. Caspase activity is indicative of cellular apoptosis.
Image Analysis
Representative samples of purified islets were digitally photographed (4.5 MB bitmaps) through a 40 × bright field microscope before and after passage through the TC. SigmaScan Pro© version 5.0.0 (SPSS Inc., Chicago, IL) is used to quantify visible changes in the tissue periphery following EDR exposure. One 8-bit grayscale image was used for each test case. A two-point color calibration was applied to each image over a 255 level grayscale to normalize the contrast between images.
An attempt to quantify the surface irregularity of the imaged islets was determined as the ratio of the calculated total tissue perimeter to the total tissue area. Correspondingly, an increase in perimeter/area ratio was interpreted as an increase in surface irregularity implying islet dismemberment. If exposure to high levels of EDR dismembered an islet by removing cells from the outer surface, it was assumed that the mean surface irregularity of the islet tissue would measurably increase.
Since many islets in the images were touching each other, islets could not be analyzed individually. Instead, the software summed the perimeter and area of all tissue within the image into a global average. Triplicate measurements of area and perimeter were made for several levels of software discrimination threshold. The calculated perimeter/area ratios were compared via standard least squares across discrimination thresholds and EDR exposure in JMP 6.0.0 (SAS Institute, Inc., Cary, NC). Model parameters were assumed to be significant for P-values less than 0.05.
Results
A total of five, independent islet isolations (P608, P609, P610, P648, and P649) were subjected to three different flow rates, 25, 50, and 100 mL/min, corresponding to minimal, median, and maximum EDR values of 3.7 × 10³, 9.2 × 10³, and 4.6 × 10⁴ W/m3, respectively. As stated previously, these values of EDR were chosen based on previous experience with suspended cells and CHO cells attached to 200 μm microcarriers. Given the method of removal and subsequent suspension of porcine islets, islet size and degree of fragmentation can differ considerably between runs. A simple quantification of the islets’ size and shape would not be possible.
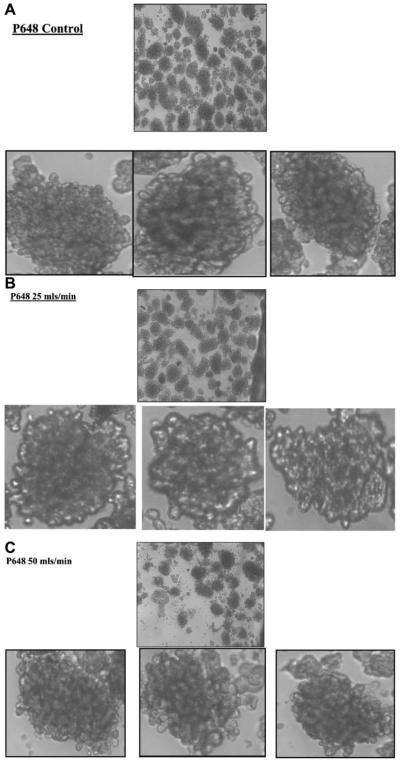
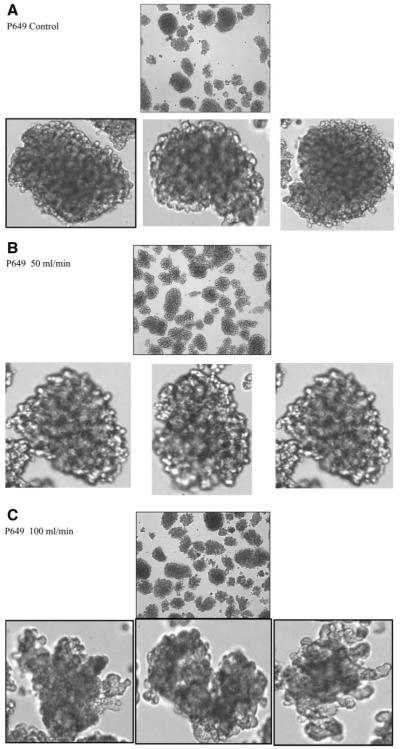
After being subjected to a single pass through the TC, the five islet populations did not reveal obvious changes in aggregate size. However, after experiencing each of the different flow rates islets demonstrated an increase in surface irregularities (Figs. 6 and 7). At the highest EDR values (100 mL/min), Figure 7C demonstrates that the surface of the islets clearly has a “rougher” appearance. Qualitatively, the 50 mL/min studies (Figs. 6C and 7B) show early indications of increased surface roughness, but not nearly as much as the higher EDR studies. In addition to an increased surface topography, some of the islets appear to have begun to disintegrate.
Figure 6.
Photographs of the islets from donor P648, before (A) and after flowing through the TC at 25 and 50 mL/min (B, C). For each of these three conditions, the top photo is at a low magnification, which shows many islets, while the three lower photos are enlargements focused on one specific islet.
Figure 7.
Photographs of the islets from donor P649, before (A) and after flowing through the TC at 50 and 100 mL/min (B, C). For each of these conditions the photos at top photo show the general state of the islets; the lower photos are enlargements of a particular islet. The morphology of the islets exposed to the 100 mL/min flow through the TC is clearly more rough on the edges, and in one case, the islets are partially split into two parts. Visual inspection of the 50 mL/min in (B) and (C) indicates that this “roughing” of the edges is beginning.
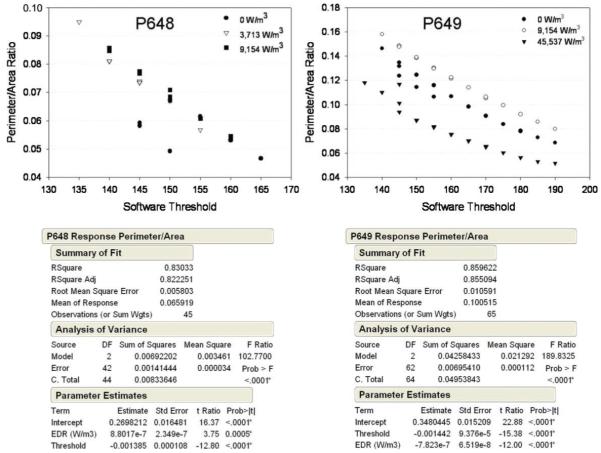
These subjective observations could not, however, be consistently corroborated by the image analysis algorithm which used the previously described, total tissue perimeter to the total tissue area ratio. The analysis of the islets from donor P648, after being subjected to high levels of EDR, demonstrated a greater perimeter/area ratio than the corresponding control, suggesting that the software was able to capture the increased surface complexity in surface roughness (Fig. 8). However, islets from donor P649 first showed an increase in this ratio at the moderate EDR level, but had the smallest area to perimeter ratio after being subjected to the highest EDR.
Figure 8.
Results and statistical analysis of tortured islet image analysis (SigmaScan®/JMP®). Both software discrimination threshold (in arbitrary units) and EDR exposure were significant model parameters. For donor P648, control islets had a significantly different perimeter/area ratio than tortured islets. Donor P649 control islets, however, had a perimeter/area ratio significantly higher than highly tortured islets.
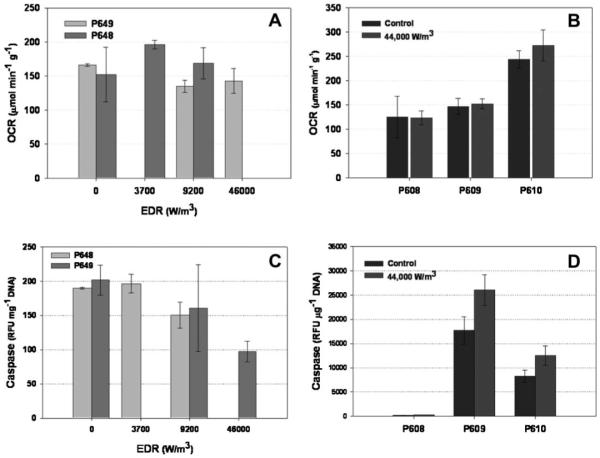
No discernable trends could be observed in the cellular assays with respect to different levels of EDR exposure. Figure 9A presents the OCR rate, in units of μmole of O2 consumed/mass of islet/min for a control and two of the three EDR exposures levels for donors P648 and P649. No statistically measurable difference was observed. For the three other runs (Fig. 9B), only the highest level of EDR relative to the control was tested for OCR, and again, no statistically measurable difference was observed. These same samples were also tested for caspase activity (Fig. 9C,D) and again, no conclusions can be made. In fact, for several runs, the level of caspase decreased after being subjected to the various levels of EDR.
Figure 9.
OCR as a function of EDR exposure for donor P648 and P649 (A), and for donor P608, P609, and P610, for the control and the highest level of EDR (B). Caspase assay results, in units of RFU per mg DNA as a function of EDR (C) and the highest EDR, for the same donors as in (A) and (B).
Discussion
While the lack of supporting functional assay measurements for cell damage is disappointing from the perspective of verification of the threshold at which physiological effect can be detected, it is not surprising. Very little evidence in the literature exists for any effect of a single, acute, exposure of high hydrodynamic forces to a cell beyond outright cell rupture. In fact, Mollet et al. (2007) conducted an extensive study to determine if such an acute exposure could elicit an apoptotic response in suspended Chinese Hamster ovary cells. While a very low response was observed, it was concluded that it was not significant; consequently, it is not surprising that the caspase assay in this study was negative.
The qualitative and visual observations indicate that some damage can occur with respect to hydrodynamic forces at the higher levels tested, and this damage is only on the outer layer of cells of the islet since on a per cell basis, the OCR and caspase assay did not indicate any effects. The mixed results with image analysis in quantifying this visual observation is most probably the result of heterogeneity of the size of the islets initially, as well as the difficulty in determining the perimeters of the islets. While islet size distribution statistics were estimated from several samples, the actual size distribution of any particular sample could be quite far from the weighted mean. Thus, samples with different islet size distributions will have different perimeter/area ratios irrespective of altered surface roughness. Moreover, variation in islet size distribution may be random or may be a result of islet disintegration due to EDR. The simplistic perimeter/area ratio could not take any of these complexities into account.
It may be desirable to further develop this imaging technique by developing an alternative approach. We considered attempting to manually highlight islet perimeter and let the program determine the distance. However, this turned out be unreasonably subjective. Given the scarcity of human islets and the cost per porcine isolation (on the order of $15,000), a limited number of experiments dedicated to this study could be conducted. However, in terms of determining upper limits of EDR to which islets can be exposed, this study provides significant information.
The maximum EDR tested in this study, 4.4 × 10⁴ W/m3, is sufficiently high that it is possible to design and operate bioprocessing equipment that will stay significantly below this value. For example, it is well established that CHO cells on microcarriers are sensitive to EDR values of less than 4.4 × 10⁴ W/m3.
A further practical demonstration of the significance of this level of EDR can be obtained (Mollet et al., 2004). A Masterflex™ 16 silicone tubing has a diameter of approximately 3 mm. It would take a flow rate greater than100 mL/min, which is near the transition to turbulent flow before 4.4 × 10⁴ W/m3 is attained. For the moderate EDR level used in this study, 9 × 10³ W/m3, a flow rate of greater than 100 mL/min is needed. However, as demonstrated in this study, flow through a contraction can create significantly higher values of EDR at lower flow rates. Practical examples of flow through contractions include fittings to connect tubing, as well as a number of different types of valves.
Ideally, a more accurate threshold of hydrodynamic forces above which islets should not be exposed ought to be determined. The visual observations in this study provided the best estimates of the potential for damage; however, one could make an argument that if the islets on a per cell basis were not affected, even the highest levels of EDR studied were not detrimental. As mentioned previously, given the scarcity of human islets, and the cost of procuring and isolating porcine islets, the results in this study are sufficient to allow processing systems to be designed that do not create detectable islet damage. However, future studies in our lab will include xenotransplantation of islets subjected to high level of EDR into animal models to further demonstrate the maximum threshold to which islet can be subjected without apparent damage.
Acknowledgments
The authors wish to thank the National Institute of Diabetes, Digestive, and Kidney Diseases (R01 DK068757-01) and the National Science Foundation, Division of Education and Centers (EEC-0425626) for financial support.
Contract grant sponsor: National Institute of Diabetes, Digestive and Kidney Diseases
Contract grant number: R01 DK068757-01
Contract grant sponsor: National Science Foundation, Division of Education and Centers
Contract grant number: EEC-0425626
References
- Augenstein DC, Sinskey AJ, Wang DIC. Effect of shear on the death of two strains of mammalian tissue cells. Biotechnol Bioeng. 1971;13:409–418. doi: 10.1002/bit.260130308. [DOI] [PubMed] [Google Scholar]
- Avgoustiniatos E, Dionne K, Wilson D, Yarmush M, Colton C. Measurements of the effective diffusion coefficient of oxygen in pancreatic islets. Ind Eng Chem Res. 2007;46:6157–6163. [Google Scholar]
- Berney T, Buhler L, Caulfeld A, Oberholzer J, Toso Ch, Alejandro R, Cooper DKC, Ricordi C, Morel Ph. Transplantation of islets of Langerhans: New developments. Swiss Med Wkly. 2001;47–48:671–680. doi: 10.4414/smw.2001.09738. [DOI] [PubMed] [Google Scholar]
- Bird RB, Steward WE, Lightfoot EN. Transport phenomena. 2nd edn. John Wiley & Sons; New York: 2001. p. 920. [Google Scholar]
- Blake DR, Cagliero E. Islet transplantation: A viable therapy for type 1 diabetes? Endocrinol Rounds. 2002;1(4):1–6. [Google Scholar]
- Boulton-Stone GM, Blake GR. Gas bubble bursting at a free surface. J Fluid Mech. 1993;154:437–466. [Google Scholar]
- Fife JP, Derksen RC, Ozkan HE, Grewal PS, Chalmers JJ, Krause CR. Evaluation of a contraction flow field on hydrodynamic damage to entompathogenic nematodes—A biological pest control agent. Biotechnol Bioeng. 2004;86(1):96–107. doi: 10.1002/bit.10879. [DOI] [PubMed] [Google Scholar]
- Garcia-Briones MA, Brodkey RS, Chalmers JJ. Computer simulations of the rupture of a gas bubble at a gas-liquid interface and its implications in animal cell damage. Chem Eng Sci. 1994;49:2301–2320. [Google Scholar]
- Gavin JR, Alberti K, Davidson MB, DeFronzo RA, Drash A, Gabbe SG, Genuth S, Harris MI, Kahn R, Keen H, Knowler WC, Lebovitz H, Maclaren NK, Palmer JP, Raskin P, Rizza RA, Stern MP. Report of the expert committee on the diagnosis and classification of diabetes mellitus: Committee Report. Diabetes Care. 2003;26(S1):S5–S20. doi: 10.2337/diacare.26.2007.s5. [DOI] [PubMed] [Google Scholar]
- Godoy-Silva R, Mollet M, Chalmers JJ. Evaluation of the effect of chronic hydrodynamic stresses on cultures of suspended CHO cells. Biotechnol Bioeng. 2009;102:1119–1130. doi: 10.1002/bit.22146. [DOI] [PubMed] [Google Scholar]
- Goswami J, Sinskey AJ, Steller H, Stephanopoulus GN, Wang DIC. Apoptosis in batch cultures of Chinese Hamster ovary cells. Biotechnol Bioeng. 1999;62:632–640. doi: 10.1002/(sici)1097-0290(19990320)62:6<632::aid-bit2>3.0.co;2-i. [DOI] [PubMed] [Google Scholar]
- Gregoriades N, Clay J, Ma N, Koelling K, Chalmers JJ. Cell damage of microcarrier cultures as a function of local energy dissipation created by a rapid extensional flow. Biotechnol Bioeng. 2000;69:171–182. doi: 10.1002/(sici)1097-0290(20000720)69:2<171::aid-bit6>3.0.co;2-c. [DOI] [PubMed] [Google Scholar]
- Haga JH, Li Y-SJ, Chien S. Molecular basis of the effects of mechanical stretch on vascular smooth muscle cells. J Biomech. 2007;40:947–960. doi: 10.1016/j.jbiomech.2006.04.011. [DOI] [PubMed] [Google Scholar]
- Hu W, Gladue R, Hansen J, Wojnar C, Chalmers JJ. The sensitivity of the dinoflagellate Crypthecodinium cohnii to transient hydrodynamic forces. Biotechnol Prog. 2007;23:1355–1362. doi: 10.1021/bp070306a. [DOI] [PubMed] [Google Scholar]
- Kirchhof N, Shibata S, Wijkstrom M, Kulick DM, Salerno CT, Clemmings SM, Heremans Y, Galili U, Sutherland DE, Dalmasso AP, Hering BJ. Reversal of diabetes in nonimmunosuppressed rhesus macaques by intraportal porcine islet xenografts precedes acute cellular rejection. Xenotransplantation. 2004;11(5):396–407. doi: 10.1111/j.1399-3089.2004.00157.x. [DOI] [PubMed] [Google Scholar]
- Laken HA, Leonard MW. Understanding and modulating apoptosis in industrial cell culture. Curr Opin Biotechnol. 2001;12:175–179. doi: 10.1016/s0958-1669(00)00196-8. [DOI] [PubMed] [Google Scholar]
- Li YS, Haga JH, Chien S. Molecular basis of the effects of shear stress on vascular endothelial cells. J biomech. 2005;38:1949–1971. doi: 10.1016/j.jbiomech.2004.09.030. [DOI] [PubMed] [Google Scholar]
- Ma N, Koelling K, Chalmers JJ. The fabrication and use of a transient contraction flow device to quantify the sensitivity of mammalian and insect cells to hydrodynamic forces. Biotechnol Bioeng. 2002;80:428–437. doi: 10.1002/bit.10387. [DOI] [PubMed] [Google Scholar]
- Markmann JF, Deng S, Huang X, Desai NM, Velidedeoglu EH, Lui C, Frank A, Markmann E, Palanjian M, Brayman K, Wolf B, Bell E, Vitamaniuk M, Doliba N, Matschinsky F, Barker CF, Naji A. Insulin independence following isolated islet transplantation and single islet infusions. Ann Surg. 2003;237(6):741–751. doi: 10.1097/01.SLA.0000072110.93780.52. [DOI] [PMC free article] [PubMed] [Google Scholar]
- Mastrangelo AJ, Hardwick JM, Zou S, Betenbaugh MJ. Part II. Overexpression of bcl-2 family members enhances survival of mammalian cells in response to various culture insults. Biotechnol Bioeng. 2000;67:544–554. doi: 10.1002/(sici)1097-0290(20000305)67:5<555::aid-bit6>3.0.co;2-t. [DOI] [PubMed] [Google Scholar]
- McQueen A, Bailey JE. Influence of serum level, cell-line, flow type and viscosity on flow-induced lysis of suspended mammalian-cells. Biotechnol Lett. 1989;11:531–536. [Google Scholar]
- Mollet M, Ma N, Zhao Y, Brodkey R, Taticek R, Chalmers JJ. Bioprocess equipment: Characterization of energy dissipation rate and its potential to damage cells. Biotechnol Prog. 2004;20:1437–1448. doi: 10.1021/bp0498488. [DOI] [PubMed] [Google Scholar]
- Mollet M, Godoy-Silva R, Berdugo C, Chalmers JJ. Acute hydrodynamic forces induce apoptosis: A complex question. Biotechnol Bioeng. 2007;98(4):772–788. doi: 10.1002/bit.21476. [DOI] [PubMed] [Google Scholar]
- Mollet M, Godoy-Silva R, Berdugo C, Chalmers JJ. Computer simulations of the energy dissipation rate in a fluorescence activated cell sorter: Implications to cells. Biotechnol Bioeng. 2008;100(2):260–272. doi: 10.1002/bit.21762. [DOI] [PubMed] [Google Scholar]
- Oh SKW, Nienow AW, Al-Rubeai M, Emery AN. Further studies of the culture of mouse hybridoma in an agitated bioreactor with and without continuous sparging. J Biotechnol. 1992;22:245–270. doi: 10.1016/0168-1656(92)90144-x. [DOI] [PubMed] [Google Scholar]
- Papas K, Pisania A, Wu H, Weir G, Colton C. A stirred microchamber for oxygen consumption rate measurements with pancreatic islets. Biotechnol Bioeng. 2007;98(5):1071–1082. doi: 10.1002/bit.21486. [DOI] [PMC free article] [PubMed] [Google Scholar]
- Sekine N, Cirulli V, Regazzi R, Brown LJ, Gine E, Tamarit-Rodriguez J, Girotti M, Marie S, MacDonald MJ, Wollheim CB. Low lactate dehydrogenase and high mitochondrial glycerol phosphate dehydrogenase in pancreatic beta-cells. Potential role in nutrient sensing. J Biol Chem. 1994;269(7):4895–4902. [PubMed] [Google Scholar]
- Thomas CR, Al-Rubeai M, Zhang Z. Prediction of mechanical damage to animal cells in turbulence. Cytotechnology. 1994;15:329–335. doi: 10.1007/BF00762408. [DOI] [PubMed] [Google Scholar]
- Varley J, Birch J. Reactor design for large scale suspension animal cell culture. Cytotechnology. 1999;29:177–205. doi: 10.1023/A:1008008021481. [DOI] [PMC free article] [PubMed] [Google Scholar]
- Venkat RV, Stock LR, Chalmers JJ. Study of hydrodynamic in microcarrier culture spinner vessels: A particle tracking velocimetry approach. Biotechnol Bioeng. 1996;49:456–466. doi: 10.1002/(SICI)1097-0290(19960220)49:4<456::AID-BIT13>3.0.CO;2-8. [DOI] [PubMed] [Google Scholar]
- Wernersson ES, Tragardh C. Scale-up of Rushton turbine-agitated tanks. Chem Eng Sci. 1999;54:4245–4256. [Google Scholar]
- Zhangi JA, Rener WA, Bailey JE, Fussenegger M. The growth factor inhibitor saramin reduces apoptosis and cell aggregation in protein-free CHO cell batch cultures. Biotechnol Prog. 2000;16:319–325. doi: 10.1021/bp0000353. [DOI] [PubMed] [Google Scholar]
- Zhou G, Kresta SM. Impact of tank geometry on the maximum turbulence energy dissipation rate for impellers. AIChE J. 1996;42:2476–2490. [Google Scholar]


