Abstract
Many non-glutamatergic synaptic terminals in the mammalian brain contain the vesicular glutamate transporter 3 (VGLUT3), indicating that they co-release the excitatory neurotransmitter glutamate. However, the functional role of glutamate co-transmission at these synapses is poorly understood. In the auditory system, VGLUT3 expression and glutamate co-transmission are prominent in a developing GABA/glycinergic sound localization pathway. Here we show that mice with a genetic deletion of VGLUT3 exhibit disrupted glutamate-co-transmission and severe impairment in the refinement of this inhibitory pathway. Specifically, loss of glutamate co-transmission disrupts synaptic silencing and the strengthening of GABA/glycinergic connections that normally occur with maturation. Functional mapping studies further revealed that these deficits markedly degrade the precision of tonotopy in this inhibitory auditory pathway. These results demonstrate the crucial role of glutamate co-transmission in the synaptic reorganization and topographic specification of a developing inhibitory circuit.
Elimination of inappropriate neuronal connections and strengthening of appropriate ones are major steps in the development of precisely organized neuronal circuits. Both excitatory and inhibitory circuits undergo this synaptic reorganization but in contrast to excitatory circuits, the mechanisms mediating refinement of inhibitory circuits are poorly understood. The events that occur during the reorganization of inhibitory circuits have been well characterized in the developing lateral superior olive (LSO), a nucleus of the primary sound localization system in the mammalian brainstem. Neurons in the LSO encode interaural sound level differences by integrating excitatory, glutamatergic, inputs from the cochlear nucleus (CN) with inhibitory, glycinergic, inputs from medial nucleus of the trapezoid body (MNTB) 1. Both pathways are tonotopically organized and converge in the LSO in a tonotopically aligned manner, an organization which enables LSO neurons to extract interaural level differences in a frequency specific manner.
The precise organization of inhibitory inputs to the mature LSO emerges gradually during development by processes that include synaptic silencing and strengthening, followed by axonal and dendritic pruning. Synaptic silencing and strengthening occur primarily before hearing onset (in rats and mice at the end of second postnatal week) 2, the period when individual MNTB terminals in the LSO not only release the two inhibitory neurotransmitters glycine and GABA 3, 4 but also express the vesicular glutamate transporter 3 and release glutamate 5. Release of glutamate from MNTB terminals activates both AMPA and NMDA receptors on post-synaptic LSO neurons 5. However, the functional role of this glutamate co-transmission is unknown.
Accumulating evidence suggests that a variety of neurons classically considered to be non-glutamatergic are able to co-release glutamate. Although direct physiological evidence for glutamate co-transmission at these synapses is still rare outside the LSO 6–8, a growing line of anatomical studies demonstrates that discrete classes of GABAergic, cholinergic, and serotonergic neurons in several brain regions express the vesicular glutamate transporter 3 (VGLUT3), suggesting that these neurons also release glutamate 9–16. However, despite the widespread expression of VGLUT3 by non-glutamatergic neurons, the biological significance of glutamate co-transmission at these synapses has remained largely obscure 17.
In order to shed light on the functional role of glutamate co-transmission in the assembly of an inhibitory circuit we investigated the refinement of the MNTB-LSO pathway in mice in which VGLUT3 has been genetically deleted (VGLUT3−/− mice) 18. We found that disruption of glutamate co-transmission interfered with developmental synapse elimination and impaired the strengthening of maintained connections. This resulted in a severe degradation of the tonotopic organization of the MNTB-LSO pathway and a disruption of the excitation/inhibition balance in the LSO. The findings thus demonstrate a novel role for VGLUT3 and glutamate co-transmission in the developmental organization of an inhibitory pathway.
Results
Disruption of glutamate co-transmission at MNTB-LSO synapses in VGLUT3−/− mice
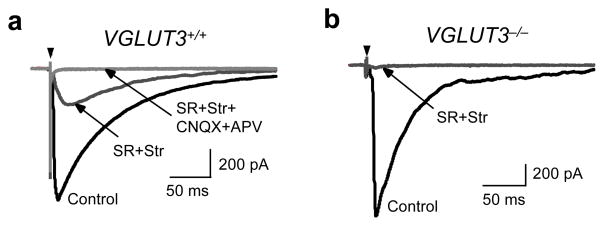
We first verified that loss of VGLUT3 expression in VGLUT3−/− animals affects glutamatergic transmission at developing GABA/glycinergic MNTB-LSO synapses. In brainstem slices prepared from 4–6 day old mice, electrical stimulation of the MNTB elicited short-latency, monosynaptic inward currents in LSO neurons 2, 19 (Fig. 1). In wild-type VGLUT3+/+ mice, specific antagonists to GABAA receptors (10 μM SR95531) and glycine receptors (1 μM strychnine) reduced MNTB-elicited responses by 81% (from 1058 ± 126 pA to 166 ± 37 pA; P4–6 n=10). The residual synaptic currents were abolished by the ionotropic glutamate receptor antagonists CNQX (20 μM) and APV (100 μM), indicating that they were mediated by glutamate. Therefore, similar to newborn rats 5, glutamate release from MNTB-LSO synapses contributes to about 20% of the synaptic peak amplitudes. In contrast, in VGLUT3−/− mice, GABAA/glycine receptor antagonists reduced MNTB-elicited responses by 96% (from 1404 ± 218 pA to 61 ± 17 pA; P4–6, n=13), significantly different from wild-type mice (P < 0.005, student’s t-test). The small residual glutamatergic component that was present in some neurons may reflect the stimulation of a sparse projection from glutamatergic neurons in the contralateral cochlear nucleus 20 or may indicate some glutamate transport into synaptic vesicles by mechanisms other than VGLUT3. Together with previous anatomical data 5, 15 our physiological results demonstrate that VGLUT3 is the primary vesicular glutamate transporter responsible for the filling of synaptic vesicles with glutamate in MNTB terminals.
Figure 1.
VGLUT3 expression is required for glutamate co-transmission at GABA/glycinergic MNTB-LSO synapses. MNTB-elicited synaptic currents recorded from LSO neurons in Mg2+-free solution. (a) In VGLUT3+/+ mice (P4–6), the specific GABAA receptor antagonist SR95531 and the glycine receptors antagonist strychnine (SR+Str, dark grey trace) partially blocked responses. The SR+Str insensitive response was abolished by the addition of the specific NMDA receptor antagonist APV and the AMPA receptor antagonist CNQX (SR+Str+CNQX+APV, light gray trace). Arrowhead; stimulation artifact. (b) In VGLUT3−/− mice, MNTB-elicited responses were almost completely blocked by SR+Str (grey trace; control, 1404 ± 218 pA; SR+Str, 61 ± 17 pA; n=13). Current traces in (a) and (b) are averages of 5–10 consecutive single responses.
Disrupted glutamate co-transmission impairs developmental strengthening of single MNTB-LSO connection
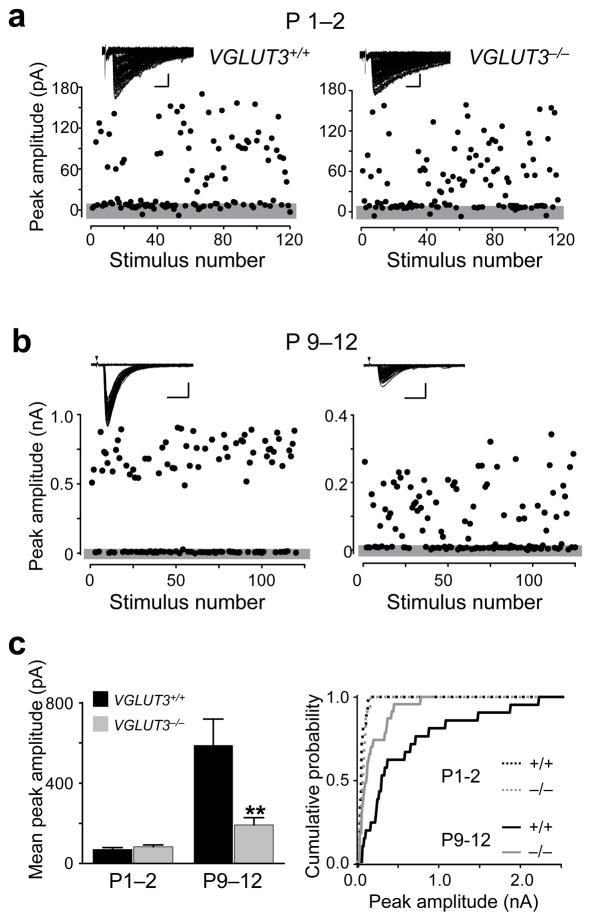
As a first step to test whether glutamate co-transmission is important for the normal development of MNTB-LSO connections, we investigated whether strengthening of MNTB-LSO connections, which in rats occurs before hearing onset during the first two postnatal weeks 2, is impaired in VGLUT3−/− mice. The strength of single-fiber MNTB-LSO connections was determined in P1–P2 and P9–12 mice using minimal stimulation techniques 2, 21. In newborn animals (P1–2), we found no difference in the amplitude of single-fiber responses between VGLUT3+/+ and VGLUT3−/− mice (P > 0.3, Student’s t-test) (Fig. 2a,c, supplemental figure 1) indicating that the initial formation of MNTB-LSO connections occurs independently from glutamate co-release. In VGLUT3+/+ mice, the amplitudes of single-fiber responses increased over 8–fold during the following 10–12 postnatal days. In VGLUT3−/− mice, single-fiber responses became larger as well but this increase was much smaller than in wild-type mice, accounting for only a 2–fold increase (P < 0.005, Student’s t-test) (Fig. 2b,c). The data thus indicate that the developmental strengthening of single-fiber MNTB-LSO connections depends on glutamatergic co-transmission.
Figure 2.
Strengthening of single-fiber MNTB-LSO connections is impaired in VGLUT3−/− mice. (a) Examples of minimal stimulation responses in LSO neurons from VGLUT3+/+ and VGLUT3−/− mice aged P1–2. Gray bar indicates noise level; Insert: Superposition of 120 consecutive current traces. Scale bar 50 pA, 10 ms. (b) Minimal stimulation responses in mice aged P9–12 mice (Left, VGLUT3+/+; Right, VGLUT3−/−). Scale bars 200 pA, 10 ms. (c) Population data. At P1–2, single-fiber responses (mean of averaged response per cells) were not significantly different between VGLUT3+/+ (71 ± 9 pA, n = 12 cells) and VGLUT3−/− mice (83 ± 10 pA, n = 16 cells; P > 0.3, Students’s t-test). At P9–12, responses were significantly larger in VGLUT3+/+ (587 ± 130 pA, n = 21 cells) than in VGLUT3−/− mice (192 ± 38 pA, n = 23 cells; **P<0.005, Left). Right: Cumulative probability histograms for single-fiber responses at P1–2 and P9–12 in VGLUT3+/+ and VGLUT3−/− mice (P1–2, P > 0.2; P9–12, P < 0.005; Kolmogorov-Smirnov test).
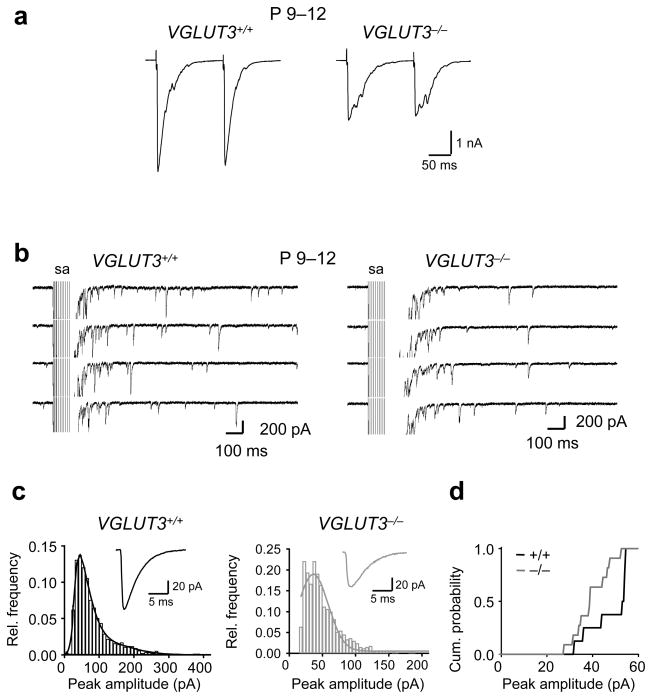
The decreased strength of single MNTB-LSO fibers in VGLUT3−/− animals can be a function of a decrease in the probability of vesicle release, quantal amplitude, or the number of functional release sites. To investigate changes in the probability of release, we determined paired pulse ratios of MNTB-LSO connections in VGLUT3+/+ and VGLUT3−/− mice (P9–11, Fig. 3a). The paired pulse ratio was 0.9 in both VGLUT3+/+ (n=7 cells) and VGLUT3−/− mice (n=5 cells, P > 0.8 arguing against a decreased probability of release as the underlying mechanism for the decreased strength of MNTB-LSO fibers in VGLUT3−/− animals. We next compared the quantal amplitudes of miniature events by stimulating MNTB-LSO fibers in the presence of extracellular Sr2+, a condition which promotes desynchronized vesicular release 22. We observed a small but significant decrease in the amplitude of MNTB-evoked miniature currents in VGLUT3−/− mice (VGLUT3+/+: 47.8 ± 3.3 pA, n=8; VGLUT3 −/−: 39.6 ± 2.3, n=12; P<0.05; decrease 17%;, Fig. 3b–d). The 17% decrease in quantal content, however, cannot fully account for the 50% reduction of the amplitude of single-fiber responses in VGLUT3−/− mice, suggesting that deficits in glutamate co-release also impair the developmental addition of new release sites formed by single MNTB-LSO fiber connections.
Figure 3.
Paired-pulse responses in LSO neurons from VGLUT3+/+ and VGLUT3−/− mice (P9–12). (a) Example traces of MNTB-elicited synaptic currents. (b–d) MNTB-evoked miniature postsynaptic currents (mPSCs) in Sr2+. (c) Example traces of evoked mPSCs. sa, stimulus artifacts (truncated). (c) Amplitude histograms of evoked mPSCs with Gaussian fits. Insets show averaged traces of evoked mPSCs. (d) Cumulative plot of amplitudes as determined from Gaussian fits. The amplitudes of mPSCs were about 17% smaller in VGLUT3−/− mice compared to VGLUT3+/+ (VGLUT3+/+: 47.8 ± 3.3 pA, n = 8 cells; VGLUT3−/−: 39.6 ± 2.3, n=12, n = 12 cells; P < 0.05 K-S test).
Glutamate co-transmission is necessary for normal elimination of MNTB-LSO connections
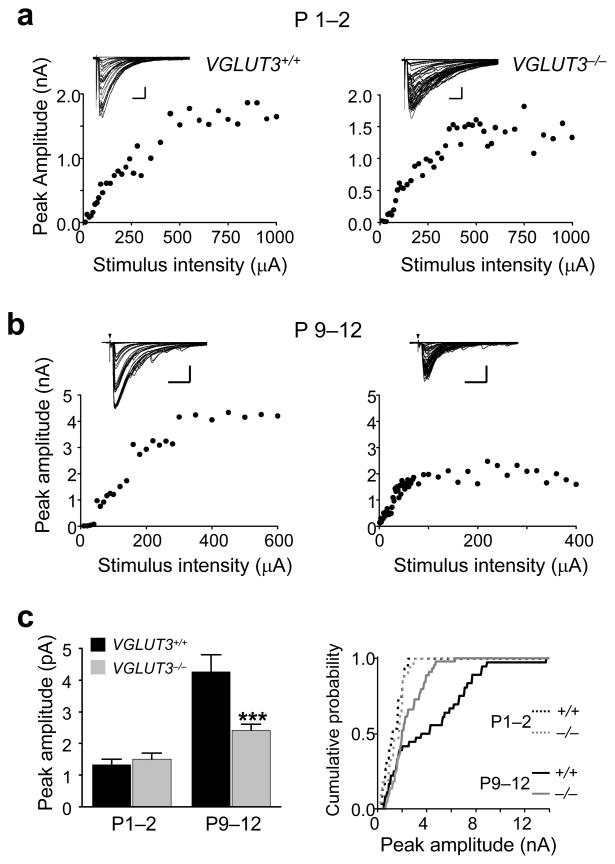
Another hallmark of the pre-hearing refinement of the MNTB-LSO pathway is the functional silencing of most connections which results in a decrease in the MNTB-LSO convergence ratio 2. To determine whether glutamate co-transmission is important for synaptic silencing, we estimated the number of MNTB axons that converge on individual LSO neurons. To this end we first compared the synaptic currents elicited by activation of all converging MNTB-inputs (maximal responses). The maximal MNTB-LSO response amplitudes at P1–2 were 1.3 ± 0.2 nA in VGLUT3+/+ mice (n = 15 neurons) and 1.5 ± 0.2 nA in VGLUT3−/− mice (n = 17 neurons), statistically not different from each other (P > 0.4, students’t –test; Fig. 4a,c). However, decay times in VGLUT3−/− mice were longer than in VGLUT3+/+ mice (VGLUT3+/+: 45.2 ± 3.7 ms; n=15; VGLUT3−/−: 85.5 ± 5.1 ms; n=17; P<0.01). Since the decay times and rise times at all other ages and stimulus conditions, were not significantly different between VGLUT3+/+ and VGLUT3−/− mice, the longer decay times of maximal responses at P1–2 are difficult to explain but may point to a higher density of extrasynaptic GABA and/or glycine receptors in VGLUT3−/− mice that are activated by spillover with strong synaptic activation. At P9–12, maximal MNTB-LSO response amplitudes were 4.3 ± 0.5 nA in VGLUT3+/+ mice (n = 36 neurons), but only 2.4 ± 0.2 nA in VGLUT3−/− mice (n = 44 neurons), a 42 % difference (P < 0.001, Students’ t-test) (Fig. 4c). It is unlikely that the smaller amplitudes observed in VGLUT3−/− mice are result from an increased variability of responses of individual fibers (desynchronization of responses due different conduction velocities of MNTB axons) or that they result from more distal dendritic location of MNTB inputs because rise times of responses were indistinguishable between VGLUT3+/+ and VGLUT3−/− mice. Thus, the smaller amplitudes in VGLUT3−/− mice is primarily attributable to a population of larger-amplitude fibers that is present in VGLUT3+/+ mice but not VGLUT3−/− mice and which gives rise to a second component in the distribution of peak amplitudes in wild type animals (Fig. 4c). The presence of a subpopulation of strong fibers in VGLUT3+/+ mice at hearing onset is reminiscent to the innervation pattern in rats at hearing onset 2.
Figure 4.
Disruption of glutamate co-transmission impairs the developmental strengthening of all converging MNTB inputs. (a) Examples of stimulus-response relationship in LSO neurons from P1–2 mice. Insets: Superimposed consecutive traces. Scale bars 300 pA, 20 ms. Arrows – stimulation artifact. (b), Same as (a), but for mice aged P9–12. Scale bars 1000 pA, 20 ms (c) Population data. At P1–2, the mean amplitude of maximal responses was not significantly different between VGLUT3+/+ (1.3 ± 0.2 nA, n = 15) and VGLUT3−/− (1.5 ± 0.2 nA, n = 17; P > 0.4). At P9–12, the mean amplitude of maximal responses was significantly larger in VGLUT3+/+ mice (4.3 ± 0.5 nA, n = 36) than in VGLUT3−/− mice (2.4 ± 0.2 nA, n = 44; ***P<0.001, Student’s t-test). Right: Cumulative probability histograms for maximal responses at P1–2 and P9–12 in VGLUT3+/+ and VGLUT3−/− mice (P1–2, P > 0.5; P9–12, P < 0.002; Kolmogorov-Smirnov test).
The ratio between maximal and single-fiber response amplitudes provides a lower estimate for the number of MNTB fibers converging on individual LSO neurons. At P1–2, the estimated MNTB-LSO convergence was 19:1 for VGLUT3+/+ mice and 18:1 for VGLUT3−/− mice, slightly smaller than the convergence for neonatal rats 2. However, at P9–12, the estimated MNTB-LSO convergence was almost twice as high in VGLUT3−/− mice (13:1) than in VGLUT3+/+ mice (7:1). These results indicate that reorganization of the developing MNTB-LSO pathway via synaptic silencing and strengthening of maintained connections depends on the co-release of glutamate.
Glutamate co-transmission is crucial for the topographic organization of the MNTB-LSO pathway
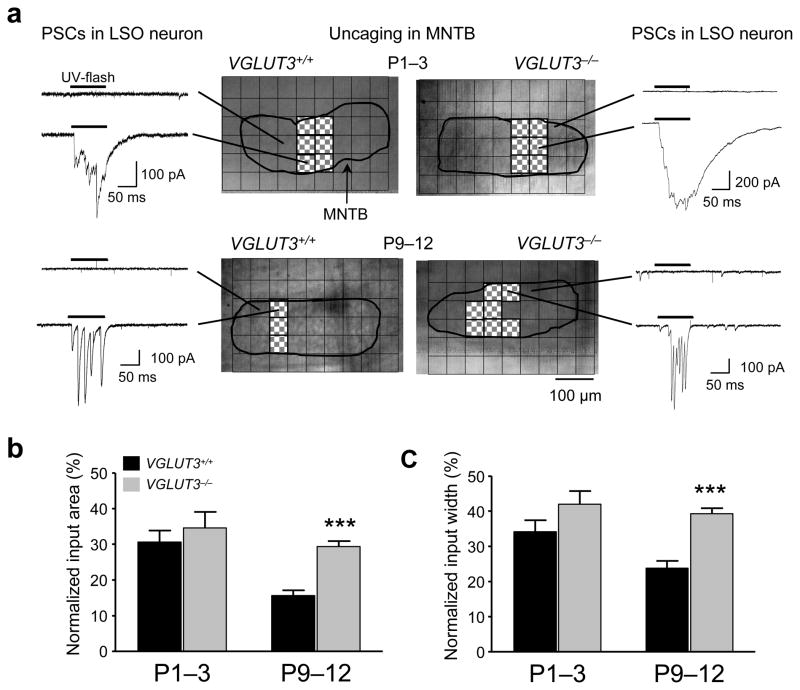
To investigate whether, and to what degree, impaired synapse elimination and strengthening in VGLUT3−/− mice affects the topographic organization and precision of the MNTB-LSO pathway, we mapped functional MNTB-LSO connectivity using focal photolysis of caged glutamate 23 (Fig. 5). In newborn mice (P1–3), the fraction of the MNTB that contained neurons synaptically linked to individual LSO neurons (MNTB input area) was about 30% and was similar in VGLUT3+/+ and VGLUT3−/− mice (VGLUT3+/+: 30.6 ± 3.3 %, n = 6; VGLUT3−/−: 34.6 ± 4.6 %, n = 6; P > 0.5, Student’s t-test; Fig. 5b). In VGLUT3+/+ mice, the size of MNTB input areas decreased by 50 % over the next 10 days (15.6 ± 1.5 % at P9–12, n = 13) indicating an increase in the precision of the topographic map. In contrast, in VGLUT3−/− mice there was only a slight and statistically non-significant decrease in input area by 15% (to 29.4 ± 1.6 %, n = 15). Therefore, at hearing onset, input maps in VGLUT3−/− mice were twice as large as inputs maps in VGLUT3+/+ mice (P < 0.0001, Student’s t-test). When measured along the medio-lateral axis, the tonotopic axis in the MNTB 24, input maps in VGLUT3+/+ animals spanned across a 65% wider “frequency range” than the maps in VGLUT3−/− animals, indicating a significant degradation of the tonotopic organization.
Figure 5.
Topographic sharpening of MNTB-LSO input maps is impaired in VGLUT3−/− mice. (a) Examples of MNTB input maps in VGLUT3+/+ and VGLUT3−/− mice. Scanning grid has been overlaid above a photograph of the MNTB in the slice. Uncaging sites inside the MNTB which elicited a synaptic response in the recorded LSO neuron are filled in red. For each map, example current traces are shown for connected (hatched) and non-connected areas (open). (b) Normalized size of inputs maps at P1–3 and P9–12. At P1–3, input areas were not different between VGLUT3+/+ (30.6 ± 3.3 %, n = 6) and VGLUT3−/− mice (34.6 ± 4.6 %, n = 6; P > 0.5, Student’s t-test). However, at P9–12, input areas were significantly smaller in VGLUT3+/+ mice(15.6 ± 1.5 %, n = 13) than in VGLUT3−/− (29.4 ± 1.6 %, n = 15; ***P < 0.001, Student’s t-test). (c) Normalized input widths along the medio-lateral direction, the tonotopic axis in the MNTB. At P1–3, there was no difference in input width between both groups (VGLUT3+/+, 34.2 ± 3.2 %, n = 6; VGLUT3−/−, 42.0 ± 3.8 %, n = 6; P > 0.1, Student’s t-test). At P9–12, input width of VGLUT3+/+ mice was significantly narrower than in VGLUT3−/− mice (VGLUT3+/+, 23.8 ± 2.1 %, n = 13; VGLUT3−/−,39.3 ± 1.6 %, n = 15; ***P < 0.0001, Student’s t-test).
Membrane properties of MNTB and LSO neurons are unaffected by the loss of glutamate co-transmission
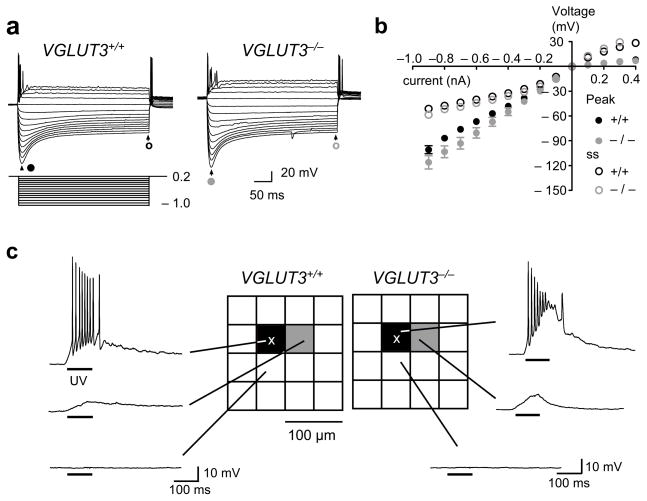
Changes in the activity levels or in the properties of synaptic transmission can alter neuronal membrane excitability and sensitivity to neurotransmitters 25–27. Because increased excitability or glutamate sensitivity of MNTB neurons could increase the measured size of MNTB-LSO maps we determined the membrane properties of MNTB and LSO neurons and the spatial resolution of glutamate uncaging in the MNTB. Hyperpolarizing and depolarizing current injections into MNTB neurons (P 9–11) produced membrane potential responses characteristic for this age 28, 29. Importantly, we detected no differences between VGLUT3+/+ and VGLUT3−/− mice with respect to input resistance (VGLUT3+/+: 88.7 ± 3.1 MΩ, n = 8; VGLUT3−/−: 103.7 ± 7.4 MΩ, n = 11; P > 0.1) or current-voltage response curves (Fig. 6a,b). Likewise, no differences in the membrane properties of LSO neurons between VGLUT3+/+ and VGLUT3−/− mice were found (P9–11; supplemental figure 2). To test for potential changes in the spatial resolution of uncaging, we recorded from MNTB-neurons while uncaging glutamate in their vicinity to determine the spike eliciting uncaging distance 2 (Fig. 6c). In both VGLUT3+/+ (n = 8) and VGLUT3−/− mice (n = 11) action potentials could only be elicited when uncaging occurred at distances less than 25μm from the MNTB cell body, a resolution similar to that observed in neonatal rats 2. These results indicate that deficits in glutamate co-transmission have no effect on the development of basic membrane properties of MNTB or LSO neurons and that the larger MNTB-inputs areas we measured in VGLUT3−/− mice indeed reflect a decrease in the precision of MNTB-LSO topography.
Figure 6.
Membrane properties of MNTB neurons and spatial resolution of glutamate photolysis in the MNTB are not different in VGLUT3+/+ and VGLUT3−/− mice. (a) Membrane voltage responses of MNTB neurons (P9–11) in current clamp in response to injection of current steps. Negative current injections generated a slowly relaxing hyperpolarization ‘sag’. (b) Current-voltage relationships. Inward rectification in response to hyperpolarizing current pulses was present in all neurons (VGLUT3+/+, black, n = 8; VGLUT3−/−, grey, n = 11; close circle - peak; open circle - steady-state, ss). The input resistance was not significantly different between VGLUT3+/+ (88.7 ± 3.1 MΩ, n = 8) and VGLUT3−/− mice (103.7 ± 7.4 MΩ, n = 11; P > 0.1, Student’s t-test). (c) The effective resolution of uncaging (spike eliciting uncaging distance 2) was not different between VGLUT3+/+ and VGLUT3−/− mice. Glutamate uncaging-elicited responses were recorded in MNTB neurons (location marked by X). UV flash durations (100 ms) and caged glutamate concentrations (1 mM) were the same as in the mapping experiments. In both VGLUT3+/+ (n = 8) and VGLUT3−/− mice (n = 11), action potentials occurred only when uncaging occurred in the square above the recorded MNTB neuron (n = 8).
Deletion of VGLUT3 has no effect on glutamatergic transmission of the CN-LSO pathway
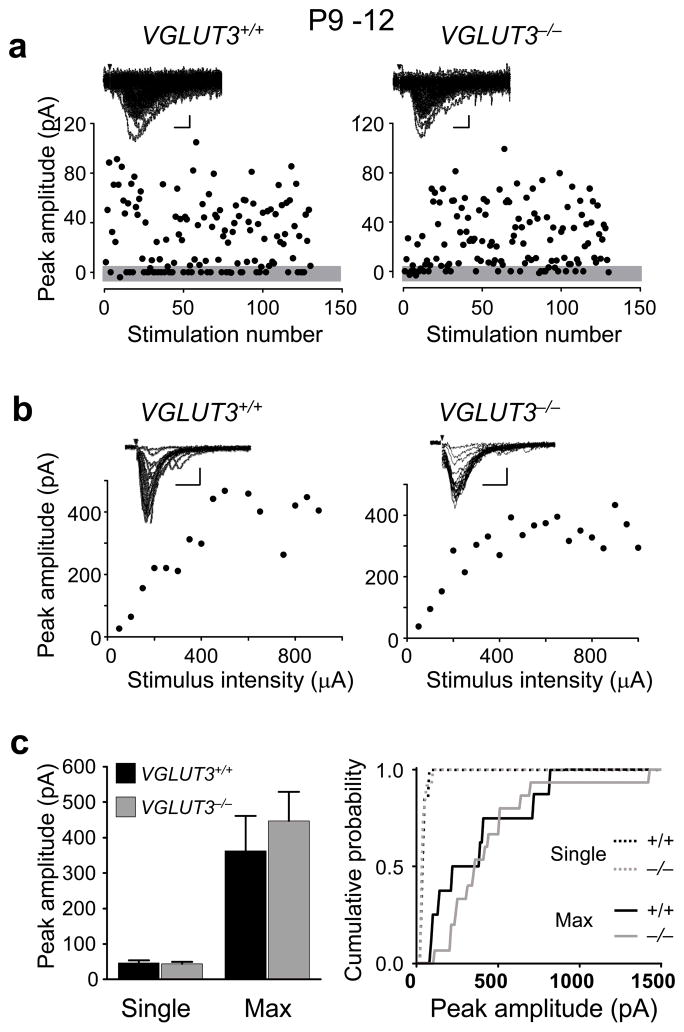
In addition to receiving inhibitory inputs from the MNTB, the LSO is also the target of a tonotopically organized excitatory (glutamatergic) pathway from the ipsilateral cochlear nucleus. These converging inhibitory and excitatory inputs are already tonotopically aligned at hearing onset, 30 suggesting that the alignment process occurs during the first two postnatal weeks. We therefore asked whether decreased synapse elimination and strengthening in the MNTB-LSO pathway of VGLUT3−/− affects the glutamatergic CN-LSO pathway. Because in the auditory brainstem, VGLUT3 expression is restricted to MNTB neurons 5, 15, genetic deletion of VGLUT3 is not expected to directly alter synaptic transmission in the CN-LSO pathway. Indeed, stimulation of CN axons in VGLUT3−/− mice produced normal glutamatergic responses in LSO neurons (Fig 7). Most importantly, we found no difference between VGLUT3−/− and VGLUT3+/+ mice with respect to the amplitudes of single-fiber or maximal responses (single-fiber: VGLUT3+/+: 47 ± 6 pA, n = 7; VGLUT3−/−: 44 ± 6 pA, n = 12; P > 0.7, Student’s t-test; Max. responses: VGLUT3+/+: 362 ± 99 pA, n = 8; VGLUT3−/−: 447 ± 82 pA, n = 15; P > 0.5, Student’s t-test). This indicates that the maturation of the CN-LSO pathway is not affected by impairments in the MNTB-LSO pathway. The impaired strength of GABA/glycinergic MNTB-LSO inputs in VGLUT3−/− animals in the face of a normal strength of glutamatergic CN-LSO inputs results in a severe disturbance of the excitation-inhibition balance towards excitation in VGLUT3−/− mice.
Figure 7.
Glutamatergic CN-LSO inputs are normal in VGLUT3−/− mice. (a) Examples of single-fiber CN-LSO responses in P9–12 animals. Gray bar indicates noise level. Insest: Superposition of 130 consecutive current traces. Scale bars 20 pA, 2 ms (b) Examples of maximal responses. Scale bars 100 pA, 5 ms. (c) Single-fiber and maximal responses were not different in VGLUT3+/+ and VGLUT3−/− mice (Single-fiber: VGLUT3+/+, 47 ± 6 pA, n = 7; VGLUT3−/−, 44 ± 6 pA, n = 12; P > 0.7, Student’s t-test; Max. responses: VGLUT3+/+, 362 ± 99 pA, n = 8; VGLUT3−/−, 447 ± 82 pA, n = 15; P > 0.5, Student’s t-test). Right: Cumulative amplitude histogram (Single-fiber, P > 0.7; Max., P > 0.6; Kolmogorov-Smirnov test).
Normal MNTB-LSO development in deaf otoferlin knockout animals
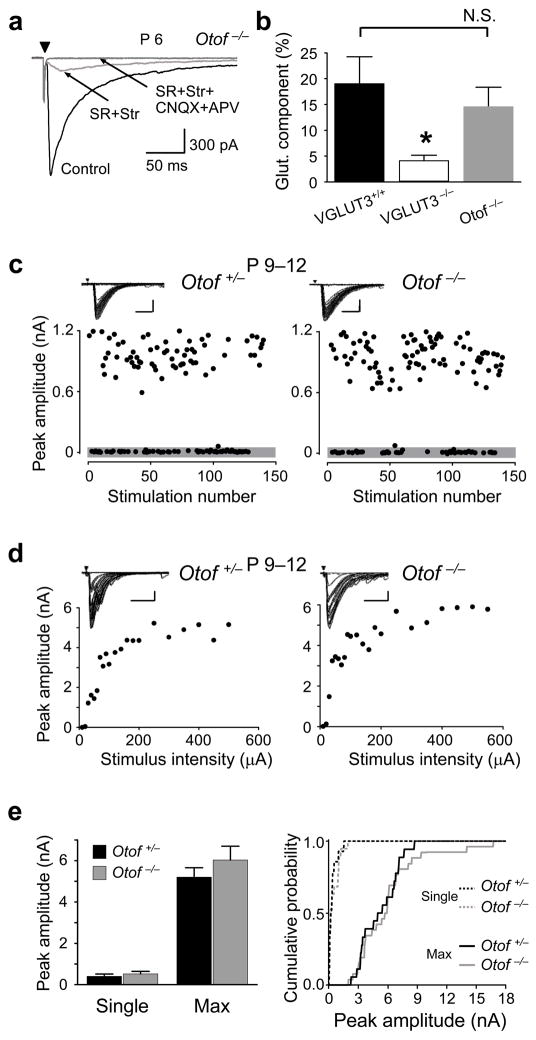
In the cochlea, VGLUT3 is expressed by inner hair cells (IHCs) in which it is necessary for loading synaptic vesicles with glutamate 18. VGLUT3−/− mice lack sound-evoked and spontaneous glutamate release from IHCs onto primary afferent fibers. This raises the possibility that the observed defects in MNTB-LSO refinement in VGLUT3−/− mice result from a lack of cochlear-generated activity that is generated before hearing onset 31, 32. To address this possibility we characterized the MNTB-LSO pathway in mice with a genetic deletion of Otoferlin (Otof−/−), the proposed calcium-sensor and vesicle-binding protein in hair cells 33, 34. Similar to VGLUT3−/− mice, Otof−/− mice lack glutamate release from hair cells 34–36 but in contrast to VGLUT3−/− mice, Otof−/− mice have normal glutamate co-transmission from MNTB terminals (Fig 8a,b). Heterozygote Otof+/− mice have normal hearing and no impairment in vesicle release from IHCs 35 and thus served as controls. We observed no differences either in single-fiber responses (Otof+/−: 406 ± 111 pA, n = 14; Otof−/−: 522 ± 124 pA, n = 19; P > 0.5; Student’s t-test) nor maximal responses (Otof+/−: 5.2 ± 0.5 nA, n = 18; Otof−/−: 6.0 ± 0.7 nA, n = 26; P > 0.3; Student t-test) between Otof+/− and Otof−/− mice (Fig 8c–e). Similar results were also obtained in another Otoferlin mutant strain (“pachanga” mutant) in which Otoferlin has a point mutation at a different site in the C2 domain 37 (Supplemental figure 3). These results indicate that the impairments of the MNTB-LSO pathway in VGLUT3−/− animals are not the result of an absence of cochlear-generated spontaneous activity, but are caused by the disruption of glutamate co-transmission at GABA/glycinergic MNTB terminals.
Figure 8.
Normal glutamate co-transmission at MNTB-LSO synapses in Otoferlin knockout mice (Otof−/−). (a) Example of MNTB-elicited synaptic responses in an LSO neuron from an Otof−/− mouse (P6). In Mg2+-free solution currents were partially blocked by SR95531 and strychnine (SR+Str, red traces) (Control, 1831 ± 79 pA; SR+Str, 254 ± 82 p A; n = 5). The remaining current was blocked by APV and CNQX (SR+Str+CNQX+APV, gray trace). Arrowhead; stimulation artifact. Traces are averages of 5–10 consecutive responses. (b) In average, 15±4 % of synaptic peak current in Otof −/− mice was mediated by glutamate receptors (n = 5). This value was not significantly different from VGLUT3+/+ mice (VGLUT3+/+:19 %, P > 0.5). Error bars indicate mean±S.E.M. (c–e) Undisturbed refinement of MNTB-LSO connectivity in Otof−/− mice. (c) Examples of single-fiber responses. Insets: Superposition of 150 consecutive traces. Scale bars 400 pA, 10 ms (d) Examples of stimulation-response curves. Scale bars 1000 pA, 20 ms. (e) Comparison of means and cumulative histograms show no difference in single-fiber and maximal response amplitudes in Otof+/− and Otof−/− mice (Means: Single-fiber: Otof+/−, 406 ± 111 pA, n = 14; Otof−/−, 522 ± 124 pA, n = 19; P > 0.5; Student’s t-test. Max.: Otof+/−, 5.2 ± 0.5 nA, n = 18; Otof−/−, 6.0 ± 0.7 nA, n = 26; P > 0.3; Student t-test; Cumulative probability: Single-fiber, P > 0.7; Max., P > 0.9; Kolmogorov-Smirnov test).
Discussion
This study reveals an essential role of glutamate co-release in the developmental organization of an inhibitory circuit. Loss of glutamate co-transmission at GABA/glycinergic synapses in the auditory MNTB-LSO pathway impaired synapse elimination and strengthening of maintained connections, the two major processes which underlie topographic refinement before hearing onset. Mapping studies revealed a significant degradation of the tonotopic organization of the MNTB-LSO pathway in VGLUT3−/− animals at the time of hearing onset. Finally, our results indicate that the role of glutamate co-release in inhibitory circuit development is specific to circuit refinement rather than initial circuit formation. Innervation of the LSO occurs during late embryonic ages 19, 38, 39 and appears to be independent of glutamate co-transmission because in newborn animals, the strength, synaptic properties, and topographic organization of the MNTB-LSO pathway were indistinguishable between VGLUT3+/+ and VGLUT3−/− mice. At present, it is unknown whether the impairment in topographic precision that are present at hearing onset are permanent or can be corrected or compensated by sound-evoked patterned activity. Because VGLUT3−/− animals are deaf 18 addressing this question will require MNTB-specific deletion of VGLUT3.
In the auditory system, VGLUT3 is not only expressed in MNTB neurons but is also expressed in inner hair cells (IHCs), the primary sensory cells in the cochlea. Since in IHCs, VGLUT3 is the only vesicular glutamate transporter, genetic deletion of VGLUT3 in mice leads to deafness 18 and in humans, a point mutation in SLC17A8, the gene encoding VGLUT3, underlies progressive nonsyndromic deafness 18, 40. Although our experiments were performed on animals before hearing onset and thus, are not affected by the deafness of VGLUT3−/− mice, disruption of glutamate release from IHCs is also expected to affect spontaneous cochlear activity, which is present before hearing onset 32, 41 and involves glutamate transmission from IHC to spiral ganglion cell dendrites31. Cochlear-generated spontaneous activity patterns are propagated along the auditory nerve and central auditory pathways and are thought to guide the synaptic refinement of central auditory connections before hearing onset 26, 31, 42, 43. One could, thus, argue that disrupted cochlear-generated activity, rather than disrupted glutamate co-transmission at MNTB-LSO synapses, underlies the impairments in the MNTB-LSO refinement we observed in VGLUT3−/− mice. If this argument holds true then one would expect that Otof−/− and pachanga mice, both of which lack glutamate release from IHCs 34–36, would show similar deficits in MNTB-LSO refinement as VGLUT3−/− mice. This, however, was not the case, as functional connectivity of the MNTB-LSO pathways in Otof−/− and pachanga mice was indistinguishable from control animals. Therefore, loss of glutamate co-transmission at MNTB-LSO synapses, rather than loss of glutamate release from IHCs, is responsible for the impaired MNTB-LSO refinement in VGLUT3−/− mice.
Glutamate released from GABA/glycinergic MNTB terminals activates postsynaptic AMPA and NMDA receptors 5, both of which can induce activity-dependent plasticity of GABAergic synapses 44. At conventional, ‘pure’ GABAergic synapses, glutamate receptor-dependent plasticity is heterosynaptic, requiring correlated activity at glutamatergic synapses to activate glutamate receptors. At developing MNTB-LSO synapses, glutamate co-transmission may enable a monosynaptic form of glutamate-dependent plasticity before hearing onset when activity in the afferent pathways to the LSO is driven primarily by spontaneously activity in both cochlea, which is not likely to be temporally correlated. While the nature of this glutamate-dependent plasticity remains to be investigated, the excitatory action of glycine and GABA in the LSO during the first postnatal week 19 facilitates the activation of NMDARs, thereby providing a favorable scenario for the induction of NMDAR-dependent developmental plasticity 45–48.
In VGLUT3−/− animals, the decreased strength of GABA/glycinergic MNTB inputs was not compensated for by a decreased strength of glutamatergic inputs from the CN, creating a disruption of the excitation-inhibition balance in the LSO. The obvious lack of a homeostatic regulation in the LSO is in contrast to many other developing systems in which synaptic scaling mechanisms maintain a stable excitation-inhibition balance 27. Perhaps homeostatic balancing of excitatory/inhibitory inputs occurs at later developmental stages in the LSO, when the pattern of activity of both inputs is temporally correlated and activity levels are determined by the actual sound levels at both ears. On the other hand, the increased excitation/inhibition ratio present in the LSO may reflect a more general inability of neuronal circuits to counterbalance decreased inhibition as a result of a loss of VGLUT3. In support of this idea, VGLUT3−/− mice express nonconvulsive electrographic seizures 18 which may result from an impaired development of inhibitory synaptic connections formed by VGLUT3-expressing GABAergic basket cells 10. This supports the idea that glutamate co-transmission is not only critical for the refinement of the MNTB-LSO pathway but also plays a role in the developmental maturation of other VGLUT3 expressing synaptic connections.
Methods
Animals and slice preparation
Experimental procedures were in accordance with US National Institutes of Health guidelines and were approved by the Institutional Animal Care and Use Committee at the University of Pittsburgh. Coronal brainstem slices (300 μm) were prepared from VGLUT3+/+, VGLUT3−/−, Otoferlin heterozygote (Otof+/−) and homozygote (Otof−/−) mice (obtained from http://jaxmice.jax.org), and pachanga mice 37, 37, as described previously 2. Artificial cerebrospinal fluid (ACSF) was composed of (in mM): 124 NaCl, 26 NaHCO3, 10 Glucose, 5 KCl, 1.25 KH2PO4, 1.3 MgSO4 and 2 CaCl2 (pH 7.4), and during slicing also contained 1 mM kynurenic acid.
Electrophysiological recordings
Whole-cell recordings were obtained from visually identified, bipolar principal neurons in the medial (high-frequency) part of the LSO. At all ages examined, the LSO and especially the MNTB were clearly recognizable and their borders defined. Recordings were performed in a submersion-type chamber (2–3 ml/min perfusion of oxygenated ACSF at 22–25 °C) mounted on an upright microscope (Olympus BW50). Pipette resistance was 2–3 MΩ. Electrode internal solution contained (in mM) 54 D-gluconic acid, 54 CsOH, 56 CsCl, 1 MgCl2, 1 CaCl2, 10 Hepes, 11 EGTA, 0.3 Na-GTP, 2 Mg-ATP, 5 QX-314 and 0.3% biocytin (pH 7.2, 280 mOsm/l). Biocytin (0.3%) was included in the pipette solution for the later identification of neuron location and morphology. Whole-cell currents in voltage-clamp were acquired with an Axoclamp-1D amplifier (Molecular Devices, CA) and a Digidata-1440A A/D converter (Molecular Devices) using pCLAMP10 (Molecular Devices). Currents were Bessel-filtered at a cutoff frequency of 5 KHz and digitally sampled at 10 KHz. Series resistance was compensated by 80%. Recordings were taken at a holding potential of −70 mV, unless otherwise specified. Afferent fiber bundles to the LSO from the CN or MNTB were stimulated with a low-resistance patch electrode (<2 MΩ, filled with ACSF). All pharmacological drugs were bath applied.
For minimal stimulation, electrical currents (duration 0.2 ms) were adjusted to produce a synaptic failure rate of > 40% (5–80 μA) and at this intensity, 120–150 responses were evoked at a rate of 0.1–0.2 Hz (Master 8 and Isoflex, AMPI, Israel). For maximum stimulation, stimulation currents were increased until peak amplitudes of synaptic responses reached a plateau. Maximum stimulation current was below 1000 μA. The mean of at least five consecutive plateau responses were used as the maximal synaptic input strength for a given LSO neuron. Although we tested very high stimulation strength, resulting in wide plateaus, we cannot exclude that some fibers were not excited by this approach. Thus, convergence ratios obtained by minimal-maximal responses represent lower estimates.
Paired pulse ratios were computed from response pairs (stimulus interval 150 ms). At least 10 trials were averaged and the mean of the second PSC peak amplitude was divided by the first amplitude to obtain paired pulse ratios. To determine the contribution of quantal size at MNTB-LSO synapses, we measured MNTB-evoked miniature PSPs by replacing extracellular Ca2+ with Sr2+ to promote asynchronous release 22, 49. Events were detected with template search methods (Clampfit) during a 3–3.5 s window after the stimulus. For each cell, 80–100 stimulus trains were given.
Following electrophysiological recordings, slices were immersion fixed in 4% paraformaldehyde for successive visualization of biocytin-filled neurons using standard procedures and DAB as a chromogen.
Glutamate photolysis
The spatial distribution of MNTB neurons providing presynaptic inputs to individual LSO neurons was determined using focal photolysis of γ-CNB-caged glutamate(1 mM, Invitrogen). Focal spots of UV-light (duration 100 ms) were created using an optical fiber based system as described previously 2. Each location of UV light spot on the slice was documented with a CCD camera and scanning of the MNTB was guided by a grid of 50 μm × 50 μm squares. MNTB boundaries were determined using the characteristic morphology of MNTB neurons as seen under IR illumination and boundaries were determined before starting uncaging. The input map for only one LSO neuron was determined per slice hemisphere to minimize potential UV damage to the MNTB. To account for the expansion of the MNTB during the first two postnatal weeks, input maps were normalized to the cross sectional area. In the experiments for measuring the resolution of glutamate uncaging in the MNTB (Fig. 6c), the internal pipette solution contained (in mM) 54 D-potassium gluconic acid, 56 KCl, 1 MgCl2, 1 CaCl2, 10 Hepes, 11 EGTA, 0.3 Na-GTP and 2 Mg-ATP (pH 7.2, 280 mOsm/l).
Genotyping animals
All data acquisition and analysis was performed blind to the genotype of the animals. VGLUT3 and otoferlin animals (Jackson Laboratory) were genotyped as described previously18, 35. In Pachanga mice, the segment of the DNA that contained the point mutation was first isolated and amplified using standard PCR protocols with primers 5′-CTT TTC TGG GAG AAA GGG GAT-3′ and 5′-TAG GTA GTC GAA GGG GAA GA-3′. The PCR product was then sequenced by the Genomics and Proteomic Core Laboratories at the University of Pittsburgh using the insert primer 5′-TCT GGG AGA AGG GGA TCC T-3′. The Asp-to-Gly point substitution that is present in the C-terminal (C2 domain) of otoferlin was identified using Sequence Scanner Software 1.0 (Applied Biosystems, Carlsbad, CA).
Pharmacological agents
Stock solutions of SR95531 hydrobromide (Tocris), strychnine (Sigma), CNQX (Tocris) and D,L-APV (Tocris) were diluted in ACSF just prior to bath application.
Statistical analysis
Data are presented as mean ± S.E.M. Data were tested for normal distribution and Student’s t-tests (two-tailed) and Kolmogorov-Smirnov tests were applied to determine statistical significance of differences between data groups (GraphPad Prism).
Supplementary Material
Supplementary Figure 1. Amplitude histograms of minimal stimulation responses
Supplementary Figure 2. Membrane properties of LSO neurons
Supplementary Figure 3. Minimal and maximal stimulation of MNTB-LSO fibers in WT and Pachanga mice
Acknowledgments
We thank Deda Gillespie for initial recordings from VGLUT3 mice and Kristi Cihil for help with genotyping. Otoferlin knockout mice (Pachanga) 37 were generously supplied by U. Mueller (Scripps). We are grateful to E. Aizenman, J. Castro, A. Clause, and T. Tzounopoulos for comments on the manuscript. KK was supported by the National Institute on Deafness and Other Communication Disorders (DC-04199), RPS by NARSAD, and RHE by NIDA and NIMH.
Footnotes
Author Contributions
J.N. conducted electrophysiological experiments and data analysis, R.P.S. and R.H.E. created the VHLUT3−/− mice and participated in the study design, J.A.G. conducted genotyping and participated data analysis, J.N. and K.K. designed the experiments, and J.N., R.P.S., R.H.E., and K.K. wrote the paper.
References
- 1.Tollin DJ. The lateral superior olive: a functional role in sound source localization. Neuroscientist. 2003;9:127–143. doi: 10.1177/1073858403252228. [DOI] [PubMed] [Google Scholar]
- 2.Kim G, Kandler K. Elimination and strengthening of glycinergic/GABAergic connections during tonotopic map formation. Nat Neurosci. 2003;6:282–290. doi: 10.1038/nn1015. [DOI] [PubMed] [Google Scholar]
- 3.Kotak VC, Korada S, Schwartz IR, Sanes DH. A developmental shift from GABAergic to glycinergic transmission in the central auditory system. J Neurosci. 1998;18:4646–4655. doi: 10.1523/JNEUROSCI.18-12-04646.1998. [DOI] [PMC free article] [PubMed] [Google Scholar]
- 4.Nabekura J, et al. Developmental switch from GABA to glycine release in single central synaptic terminals. Nat Neurosci. 2004;7:17–23. doi: 10.1038/nn1170. [DOI] [PubMed] [Google Scholar]
- 5.Gillespie DC, Kim G, Kandler K. Inhibitory synapses in the developing auditory system are glutamatergic. Nat Neurosci. 2005;8:332–338. doi: 10.1038/nn1397. [DOI] [PubMed] [Google Scholar]
- 6.Allen TG, Abogadie FC, Brown DA. Simultaneous release of glutamate and acetylcholine from single magnocellular “cholinergic” basal forebrain neurons. J Neurosci. 2006;26:1588–1595. doi: 10.1523/JNEUROSCI.3979-05.2006. [DOI] [PMC free article] [PubMed] [Google Scholar]
- 7.Mentis GZ, et al. Noncholinergic excitatory actions of motoneurons in the neonatal mammalian spinal cord. Proc Natl Acad Sci U S A. 2005;102:7344–7349. doi: 10.1073/pnas.0502788102. [DOI] [PMC free article] [PubMed] [Google Scholar]
- 8.Nishimaru H, Restrepo CE, Ryge J, Yanagawa Y, Kiehn O. Mammalian motor neurons corelease glutamate and acetylcholine at central synapses. Proc Natl Acad Sci U S A. 2005;102:5245–5249. doi: 10.1073/pnas.0501331102. [DOI] [PMC free article] [PubMed] [Google Scholar]
- 9.Boulland JL, et al. Expression of the vesicular glutamate transporters during development indicates the widespread corelease of multiple neurotransmitters. J Comp Neurol. 2004;480:264–280. doi: 10.1002/cne.20354. [DOI] [PubMed] [Google Scholar]
- 10.Somogyi J, et al. GABAergic basket cells expressing cholecystokinin contain vesicular glutamate transporter type 3 (VGLUT3) in their synaptic terminals in hippocampus and isocortex of the rat. Eur J Neurosci. 2004;19:552–569. doi: 10.1111/j.0953-816x.2003.03091.x. [DOI] [PubMed] [Google Scholar]
- 11.Herzog E, et al. Localization of VGLUT3, the vesicular glutamate transporter type 3, in the rat brain. Neuroscience. 2004;123:983–1002. doi: 10.1016/j.neuroscience.2003.10.039. [DOI] [PubMed] [Google Scholar]
- 12.Gras C, et al. Developmentally regulated expression of VGLUT3 during early post-natal life. Neuropharmacology. 2005;49:901–911. doi: 10.1016/j.neuropharm.2005.07.023. [DOI] [PubMed] [Google Scholar]
- 13.Fremeau RT, Jr, et al. The identification of vesicular glutamate transporter 3 suggests novel modes of signaling by glutamate. Proc Natl Acad Sci U S A. 2002;99:14488–14493. doi: 10.1073/pnas.222546799. [DOI] [PMC free article] [PubMed] [Google Scholar]
- 14.Gabellec MM, Panzanelli P, Sassoe-Pognetto M, Lledo PM. Synapse-specific localization of vesicular glutamate transporters in the rat olfactory bulb. Eur J Neurosci. 2007;25:1373–1383. doi: 10.1111/j.1460-9568.2007.05400.x. [DOI] [PubMed] [Google Scholar]
- 15.Blaesse P, Ehrhardt S, Friauf E, Nothwang HG. Developmental pattern of three vesicular glutamate transporters in the rat superior olivary complex. Cell Tissue Res. 2005;320:33–50. doi: 10.1007/s00441-004-1054-8. [DOI] [PubMed] [Google Scholar]
- 16.Seal RP, Edwards RH. Functional implications of neurotransmitter co-release: glutamate and GABA share the load. Curr Opin Pharmacol. 2006;6:114–119. doi: 10.1016/j.coph.2005.12.001. [DOI] [PubMed] [Google Scholar]
- 17.Gras C, et al. The vesicular glutamate transporter VGLUT3 synergizes striatal acetylcholine tone. Nat Neurosci. 2008;11:292–300. doi: 10.1038/nn2052. [DOI] [PubMed] [Google Scholar]
- 18.Seal RP, et al. Sensorineural deafness and seizures in mice lacking vesicular glutamate transporter 3. Neuron. 2008;57:263–275. doi: 10.1016/j.neuron.2007.11.032. [DOI] [PMC free article] [PubMed] [Google Scholar]
- 19.Kandler K, Friauf E. Development of glycinergic and glutamatergic synaptic transmission in the auditory brainstem of perinatal rats. J Neurosci. 1995;15:6890–6904. doi: 10.1523/JNEUROSCI.15-10-06890.1995. [DOI] [PMC free article] [PubMed] [Google Scholar]
- 20.Kil J, Kageyama GH, Semple MN, Kitzes LM. Development of ventral cochlear nucleus projections to the superior olivary complex in gerbil. J Comp Neurol. 1995;353:317–340. doi: 10.1002/cne.903530302. [DOI] [PubMed] [Google Scholar]
- 21.Stevens CF, Wang Y. Changes in reliability of synaptic function as a mechanism for plasticity. Nature. 1994;371:704–707. doi: 10.1038/371704a0. [DOI] [PubMed] [Google Scholar]
- 22.Goda Y, Stevens CF. Two components of transmitter release at a central synapse. Proc Natl Acad Sci U S A. 1994;91:12942–12946. doi: 10.1073/pnas.91.26.12942. [DOI] [PMC free article] [PubMed] [Google Scholar]
- 23.Kandler K, Katz LC, Kauer JA. Focal photolysis of caged glutamate reveals an entirely postsynaptic form of hippocampal long-term depression. Nature Neuroscience. 1998;2:119–123. doi: 10.1038/368. [DOI] [PubMed] [Google Scholar]
- 24.Sommer I, Lingenhöhl K, Friauf E. Principal cells of the rat medial nucleus of the trapezoid body: An intracellular in vivo study of their physiology and morphology. Exp Brain Res. 1993;95:223–239. doi: 10.1007/BF00229781. [DOI] [PubMed] [Google Scholar]
- 25.Leao RN, Berntson A, Forsythe ID, Walmsley B. Reduced low-voltage activated K+ conductances and enhanced central excitability in a congenitally deaf (dn/dn) mouse. J Physiol. 2004;559:25–33. doi: 10.1113/jphysiol.2004.067421. [DOI] [PMC free article] [PubMed] [Google Scholar]
- 26.Walmsley B, Berntson A, Leao RN, Fyffe RE. Activity-dependent regulation of synaptic strength and neuronal excitability in central auditory pathways. J Physiol. 2006;572:313–321. doi: 10.1113/jphysiol.2006.104851. [DOI] [PMC free article] [PubMed] [Google Scholar]
- 27.Turrigiano GG. The self-tuning neuron: synaptic scaling of excitatory synapses. Cell. 2008;135:422–435. doi: 10.1016/j.cell.2008.10.008. [DOI] [PMC free article] [PubMed] [Google Scholar]
- 28.Wu SH, Kelly JB. Physiological properties of neurons in the mouse superior olive: Membrane characteristics and postsynaptic responses studied in vitro. J Neurophysiol. 1991;65:230–246. doi: 10.1152/jn.1991.65.2.230. [DOI] [PubMed] [Google Scholar]
- 29.Forsythe ID, Barnes-Davies M. The Binaural Auditory Pathway - Membrane Currents Limiting Multiple Action Potential Generation in the Rat Medial Nucleus of the Trapezoid Body. Proc R Soc Lond. 1993;251:143–150. doi: 10.1098/rspb.1993.0021. [DOI] [PubMed] [Google Scholar]
- 30.Sanes DH, Rubel EW. The ontogeny of inhibition and excitation in the gerbil lateral superior olive. J Neurosci. 1988;8:682–700. doi: 10.1523/JNEUROSCI.08-02-00682.1988. [DOI] [PMC free article] [PubMed] [Google Scholar]
- 31.Tritsch NX, Yi E, Gale JE, Glowatzki E, Bergles DE. The origin of spontaneous activity in the developing auditory system. Nature. 2007;450:50–55. doi: 10.1038/nature06233. [DOI] [PubMed] [Google Scholar]
- 32.Lippe WR. Rhythmic spontaneous activity in the developing avian auditory system. J Neurosci. 1994;14:1486–1495. doi: 10.1523/JNEUROSCI.14-03-01486.1994. [DOI] [PMC free article] [PubMed] [Google Scholar]
- 33.Ramakrishnan NA, Drescher MJ, Drescher DG. Direct interaction of otoferlin with syntaxin 1A, SNAP-25, and the L-type voltage-gated calcium channel Cav1.3. J Biol Chem. 2009;284:1364–1372. doi: 10.1074/jbc.M803605200. [DOI] [PMC free article] [PubMed] [Google Scholar]
- 34.Roux I, et al. Otoferlin, defective in a human deafness form, is essential for exocytosis at the auditory ribbon synapse. Cell. 2006;127:277–289. doi: 10.1016/j.cell.2006.08.040. [DOI] [PubMed] [Google Scholar]
- 35.Longo-Guess C, Gagnon LH, Bergstrom DE, Johnson KR. A missense mutation in the conserved C2B domain of otoferlin causes deafness in a new mouse model of DFNB9. Hear Res. 2007;234:21–28. doi: 10.1016/j.heares.2007.09.005. [DOI] [PMC free article] [PubMed] [Google Scholar]
- 36.Beurg M, et al. Calcium- and otoferlin-dependent exocytosis by immature outer hair cells. J Neurosci. 2008;28:1798–1803. doi: 10.1523/JNEUROSCI.4653-07.2008. [DOI] [PMC free article] [PubMed] [Google Scholar]
- 37.Schwander M, et al. A forward genetics screen in mice identifies recessive deafness traits and reveals that pejvakin is essential for outer hair cell function. J Neurosci. 2007;27:2163–2175. doi: 10.1523/JNEUROSCI.4975-06.2007. [DOI] [PMC free article] [PubMed] [Google Scholar]
- 38.Sanes DH. An in vitro analysis of sound localization mechanisms in the gerbil lateral superior olive. J Neurosci. 1990;10:3494–3506. doi: 10.1523/JNEUROSCI.10-11-03494.1990. [DOI] [PMC free article] [PubMed] [Google Scholar]
- 39.Kandler K, Friauf E. Pre- and postnatal development of efferent connections of the cochlear nucleus in the rat. J Comp Neurol. 1993;328:161–184. doi: 10.1002/cne.903280202. [DOI] [PubMed] [Google Scholar]
- 40.Ruel J, et al. Impairment of SLC17A8 encoding vesicular glutamate transporter-3, VGLUT3, underlies nonsyndromic deafness DFNA25 and inner hair cell dysfunction in null mice. Am J Hum Genet. 2008;83:278–292. doi: 10.1016/j.ajhg.2008.07.008. [DOI] [PMC free article] [PubMed] [Google Scholar]
- 41.Jones TA, Leake PA, Snyder RL, Stakhovskaya O, Bonham B. Spontaneous discharge patterns in cochlear spiral ganglion cells before the onset of hearing in cats. J Neurophysiol. 2007;98:1898–1908. doi: 10.1152/jn.00472.2007. [DOI] [PMC free article] [PubMed] [Google Scholar]
- 42.Leake PA, Hradek GT, Chair L, Snyder RL. Neonatal deafness results in degraded topographic specificity of auditory nerve projections to the cochlear nucleus in cats. J Comp Neurol. 2006;497:13–31. doi: 10.1002/cne.20968. [DOI] [PMC free article] [PubMed] [Google Scholar]
- 43.Leao RN, et al. Topographic organization in the auditory brainstem of juvenile mice is disrupted in congenital deafness. J Physiol. 2006;571:563–578. doi: 10.1113/jphysiol.2005.098780. [DOI] [PMC free article] [PubMed] [Google Scholar]
- 44.Gaiarsa JL, Caillard O, Ben Ari Y. Long-term plasticity at GABAergic and glycinergic synapses: mechanisms and functional significance. Trends Neurosci. 2002;25:564–570. doi: 10.1016/s0166-2236(02)02269-5. [DOI] [PubMed] [Google Scholar]
- 45.Morishita W, Sastry BR. Postsynaptic mechanisms underlying long-term depression of GABAergic transmission in neurons of the deep cerebellar nuclei. J Neurophysiol. 1996;76:59–68. doi: 10.1152/jn.1996.76.1.59. [DOI] [PubMed] [Google Scholar]
- 46.Aamodt SM, Shi J, Colonnese MT, Veras W, Constantine-Paton M. Chronic NMDA exposure accelerates development of GABAergic inhibition in the superior colliculus. J Neurophysiol. 2000;83:1580–1591. doi: 10.1152/jn.2000.83.3.1580. [DOI] [PubMed] [Google Scholar]
- 47.McLean HA, Caillard O, Ben-Ari Y, Gaiarsa JL. Bidirectional plasticity expressed by GABAergic synapses in the neonatal rat hippocampus. J Physiol (Lond) 1996;496:471–477. doi: 10.1113/jphysiol.1996.sp021699. [DOI] [PMC free article] [PubMed] [Google Scholar]
- 48.Akerman CJ, Cline HT. Depolarizing GABAergic conductances regulate the balance of excitation to inhibition in the developing retinotectal circuit in vivo. J Neurosci. 2006;26:5117–5130. doi: 10.1523/JNEUROSCI.0319-06.2006. [DOI] [PMC free article] [PubMed] [Google Scholar]
- 49.Behrends JC, ten Bruggencate G. Changes in quantal size distributions upon experimental variations in the probability of release at striatal inhibitory synapses. J Neurophysiol. 1998;79:2999–3011. doi: 10.1152/jn.1998.79.6.2999. [DOI] [PubMed] [Google Scholar]
Associated Data
This section collects any data citations, data availability statements, or supplementary materials included in this article.
Supplementary Materials
Supplementary Figure 1. Amplitude histograms of minimal stimulation responses
Supplementary Figure 2. Membrane properties of LSO neurons
Supplementary Figure 3. Minimal and maximal stimulation of MNTB-LSO fibers in WT and Pachanga mice


