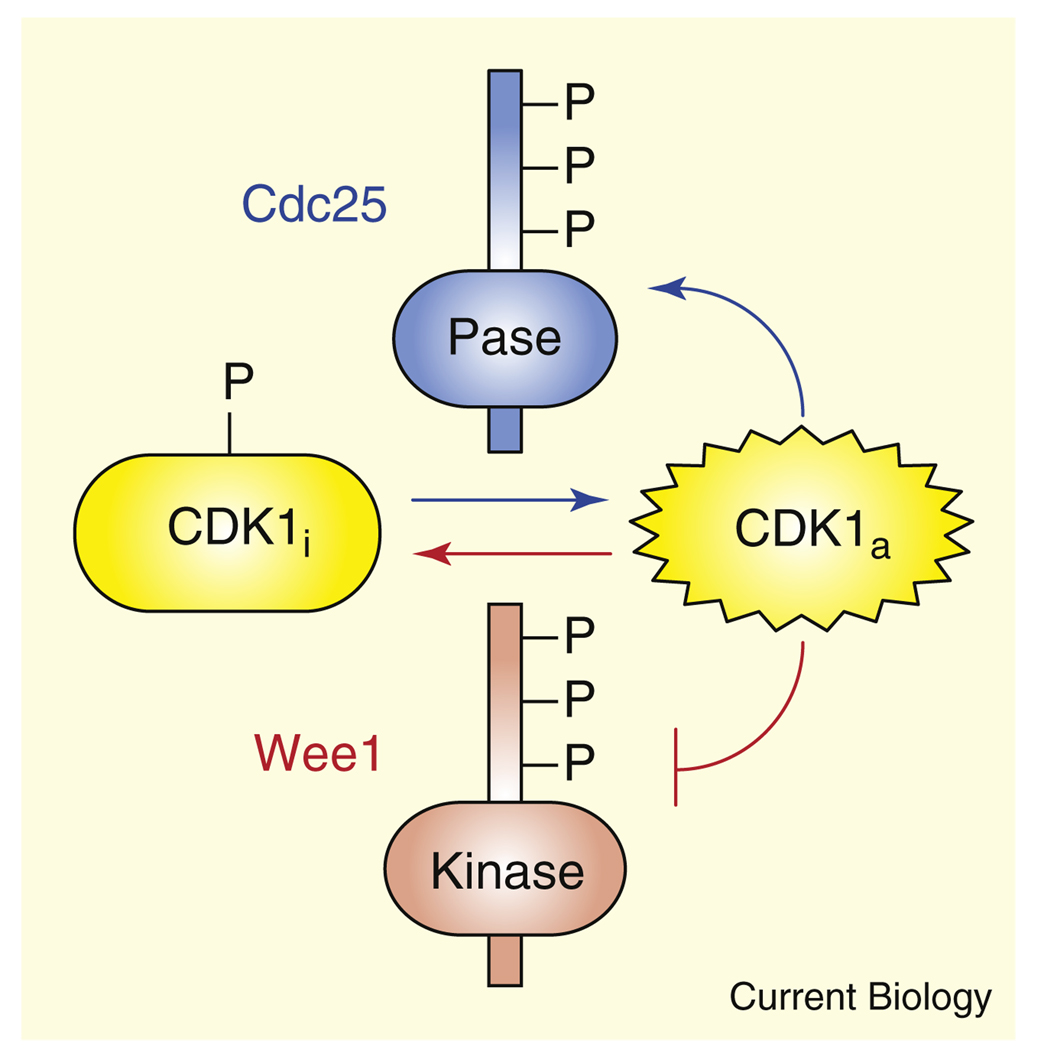
Positive feedback loops and double-negative feedback loops can generate bistability, allowing signaling networks to convert continuously graded inputs into discrete outputs [1–4]. One particularly well-studied bistable system consists of the mitotic regulator CDK1 with its inactivator Wee1 and its activator Cdc25 [5–7]. The system functions as a mitotic trigger, toggling between a stable interphase state, where CDK1 is off, and a stable M-phase state, where CDK1 is on. One striking aspect of the CDK1–Cdc25–Wee1 system is the symmetry of its two feedback loops (Figure 1). CDK1 phosphorylates Cdc25 at multiple sites in the protein’s amino-terminal regulatory region, contributing to Cdc25 activation; CDK1 phosphorylates Wee1 at multiple sites in its amino terminus, inactivating the protein. Active Wee1 phosphorylates CDK1 at Tyr15, and thereby inactivates it; active Cdc25 dephosphorylates the same site, reversing the inactivation. In principle either loop alone could generate the bistable response observed in the CDK1–Cdc25–Wee1 system [6–8], yet, throughout evolution, both loops are invariably present. This basic design — reciprocal feedback regulation of opposing enzymes — can be seen in other regulatory switches as well [9,10]. Previous work has shown that when interlinked loops operate on different timescales, it can allow the system to quickly respond and then slowly lock into a noise-resistant state [9]. However, in the case of the CDK1– Cdc25–Wee1 system, the timescales of the two loops are indistinguishable. Here we show that a mirror-image, two-loop system offers important advantage over a one-loop system even when the timescales of the two loops are identical: the symmetrical set-up makes it substantially easier to generate a bistable response.
Figure 1.
Schematic view of the reciprocal positive and double-negative feedback loops in the CDK1–Cdc25–Wee1 system.
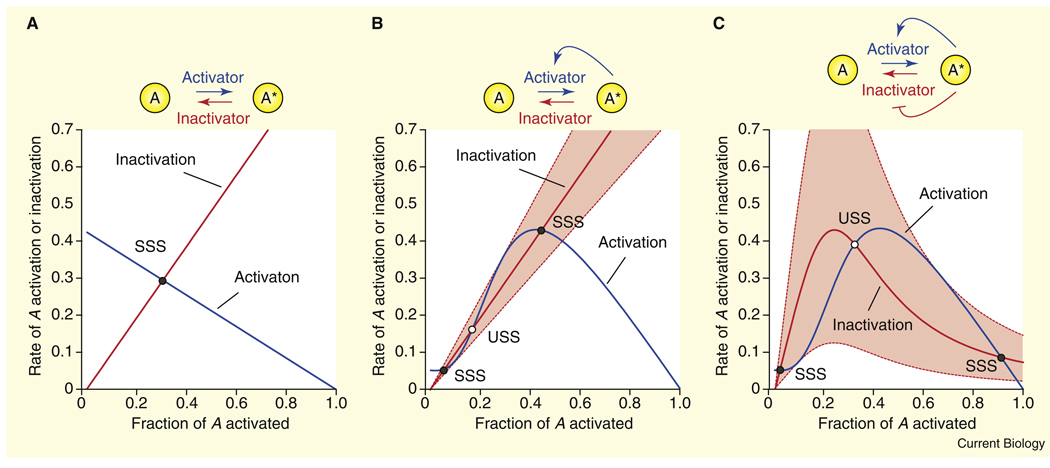
One way to see how easy or difficult it is to generate bistability is through the rate balance plot (Figure 2) [11–13], a simple graphical method well-known in theoretical biology but unfamiliar to many experimental biologists. The rate balance plot is perfectly analogous to the supply–demand plots commonly used in economics, where one graphs both the supply and the demand of some commodity as a function of price, with the point where the two curves intersect representing the equilibrium price of the commodity. Similarly, for a rate balance plot one graphs an activation rate and an inactivation rate as a function of the fraction of the protein that has been activated, and where the curves cross, the rates are balanced and the system is in steady state. A bistable system has two stable steady states and one unstable one (a threshold; see below), and so the activation and inactivation curves for a bistable system must intersect at three points. Here we will examine the ease of obtaining three intersections in the one-loop and two-loop systems.
Figure 2.
Feedback regulation of opposing enzymes yields robust bistable responses.
(A) No feedback loops. One enzyme activates A; a second inactivates it. The activation rate curve (blue) and the inactivation rate curve (red) intersect at a single point, which represents the stable steady state (SSS) of the system. (B) One feedback loop. We assume that A positively feeds back on its activator. The inactivation rate curve is unchanged (red), but now the activation rate rises and then falls as the activity of A increases (blue). If the rate constants and concentrations of the activator and inactivator are appropriately matched, the curves can intersect at three points. Two correspond to stable steady states (SSS) and one to an unstable steady state (USS). The dashed red lines depict the highest and lowest rate constants for the inactivation reaction compatible with bistability. (C) Two feedback loops. We assume that A activates its activator (blue curve) in a positive feedback loop, and inactivates its inactivator (red curve) in a negative feedback loop. The result is rate curves that are roughly mirror images of each other, and either curve can be stretched to a huge extent without eliminating the bistability. The equations upon which these plots are based are discussed qualitatively in the main text and are derived in the Supplemental Data, published with this article online.
To get the hang of the rate balance plot, consider a simple example: a protein A that can be activated by one enzyme and inactivated by another, with no feedback loops (Figure 2A). The rate of A activation will be zero when A is 100% activated, and maximal when A is 0% activated. In between, the activation rate will decrease monotonically. If the activator enzyme is operating far from saturation, the activation curve will be a straight line whose (negative) slope is determined by the abundance and rate constant of the activator enzyme (Figure 2A, blue line). The inactivation curve is just the opposite (Figure 2A, red line). For any choice of rate constants and concentrations (i.e., any choice of slopes), there will be a single intersection point — a single steady state — for the system, and the steady state will always be stable.
Now add one positive feedback loop: suppose that the activator protein is stimulated by active A (Figure 2B). This will not affect the inactivation curve (Figure 2B, red), but the shape of the activation curve will be changed. With the feedback, the rate of A activation will initially increase with A activity, as the feedback activation of the activator grows, and then decrease as the concentration of A left to become activated gets low. If we assume that the feedback is ultrasensitive (sigmoidal), the initial growth in the activation rate will be concave up (Figure 2B, blue curve). Overall, the activation curve is hump-shaped with a dent in its left-hand side (Figure 2B, blue curve).
With the proper choice of concentrations and rate constants, the red and blue curves can be made to intersect three times, as indicated by the circles (Figure 2B). Two of the intersections (filled circles) represent stable steady states (SSS): an off-state with about 5% activation of A, and an on-state with ~30–50% activation. Between these two stable states there is an unstable steady state (USS, open circle). If the system is poised exactly at this unstable steady state, the activation rate will equal the inactivation rate and the system will be in balance. But if the system is nudged even slightly to the right of the unstable steady state, the activation rate will exceed the inactivation, pushing the system even further to the right, and ultimately the system will settle into the stable on-state. Likewise, if it is nudged even slightly to the left, the system will move further left and eventually settle into the stable off-state.
Note that the slope of the red line can only withstand being changed by a modest amount and still intersect the blue curve three times (Figure 2B). The highest slope compatible with bistability is only 62% higher than the lowest (dashed red lines). This illustrates that with a one-loop feedback system, bistability is possible but brittle, requiring a precise balance between the activation and inactivation rates. Also note that with the one-loop system the switching is incomplete; the on-state has much less than maximal activation of A (Figure 2B).
Next consider what sort of shape for the inactivation curve (red) would make the bistability less brittle. On the left-hand side of the graph, where the blue curve is flat and concave up, the ideal red curve would be steep and concave down. Likewise, on the right hand side of the graph, where the blue curve is steep and concave down, the red curve should be flat and concave up. This is exactly what one gets by adding a second feedback loop that is essentially the mirror image of the first (Figure 2C). The inactivation curve becomes nearly the mirror image of the activation curve; it is hump-shaped, with a dent on the right (Figure 2C, red). The result is that the bistability of the system has become tremendously robust with respect to changes in concentrations and activities. The system can tolerate a 610% increase in the concentration or activity of the inactivator and still remain bistable.
This robust bistability should make the system more reliable — for example, it will still work as a switch even if concentrations of the regulators are doubled or halved — and easier to evolve, since the occurrence of bistability does not require precise adjustment of the circuit’s concentrations and rate constants. In addition, the switching in the two-loop system is more all-or-none in character, with the on-state being substantially closer to full activation than it was in the one-loop system.
In summary, through simple rate balance plots we have shown that the feedback regulation of opposing enzymes can markedly increase the robustness of a bistable switch; the two loops function synergistically. This finding helps rationalize the striking reciprocal regulation of Wee1 and Cdc25, and suggests that other natural and synthetic bistable circuits may benefit from the same design.
Supplementary Material
Acknowledgments
We thank Onn Brandman and John Tyson for helpful discussions and members of the Ferrell lab for comments on the manuscript. This work was supported by a grant from the NIH (GM61276).
Footnotes
Supplemental data
Supplemental data are available at http://www.current-biology.com/cgi/content/full/18/6/R244/DC1
References
- 1.Novick A, Wiener M. Enzyme induction as an all-or-none phenomenon. Proc. Natl. Acad. Sci. USA. 1957;43:553–566. doi: 10.1073/pnas.43.7.553. [DOI] [PMC free article] [PubMed] [Google Scholar]
- 2.Monod J, Jacob F. General conclusions: teleonomic mechanisms in cellular metabolism, growth, and differentiation. Cold Spring Harbor Symp. Quant. Biol. 1961;26:389–401. doi: 10.1101/sqb.1961.026.01.048. [DOI] [PubMed] [Google Scholar]
- 3.Griffith JS. Mathematics of cellular control processes. II. Positive feedback to one gene. J. Theor. Biol. 1968;20:209–216. doi: 10.1016/0022-5193(68)90190-2. [DOI] [PubMed] [Google Scholar]
- 4.Ferrell JE. Self-perpetuating states in signal transduction: positive feedback, doublenegative feedback and bistability. Curr. Opin. Cell Biol. 2002;14:140–148. doi: 10.1016/s0955-0674(02)00314-9. [DOI] [PubMed] [Google Scholar]
- 5.Morgan DO. The Cell Cycle: Principles of Control. New Science Press, Ltd; 2006. [Google Scholar]
- 6.Pomerening JR, Sontag ED, Ferrell JE., Jr Building a cell cycle oscillator: hysteresis and bistability in the activation of Cdc2. Nat. Cell Biol. 2003;5:346–351. doi: 10.1038/ncb954. [DOI] [PubMed] [Google Scholar]
- 7.Sha W, Moore J, Chen K, Lassaletta AD, Yi CS, Tyson JJ, Sible JC. Hysteresis drives cell-cycle transitions in Xenopus laevis egg extracts. Proc. Natl. Acad. Sci. USA. 2003;100:975–980. doi: 10.1073/pnas.0235349100. [DOI] [PMC free article] [PubMed] [Google Scholar]
- 8.Novak B, Tyson JJ. Modeling the cell division cycle: M-phase trigger, oscillations, and size control. J. Theor. Biol. 1993;165:101–134. [Google Scholar]
- 9.Brandman O, Ferrell JE, Jr, Li R, Meyer T. Interlinked fast and slow positive feedback loops drive reliable cell decisions. Science. 2005;310:496–498. doi: 10.1126/science.1113834. [DOI] [PMC free article] [PubMed] [Google Scholar]
- 10.Amonlirdviman K, Khare NA, Tree DR, Chen WS, Axelrod JD, Tomlin CJ. Mathematical modeling of planar cell polarity to understand domineering nonautonomy. Science. 2005;307:423–426. doi: 10.1126/science.1105471. [DOI] [PubMed] [Google Scholar]
- 11.LaPorte DC, Koshland DE., Jr Phosphorylation of isocitrate dehydrogenase as a demonstration of enhanced sensitivity in covalent regulation. Nature. 1983;305:286–290. doi: 10.1038/305286a0. [DOI] [PubMed] [Google Scholar]
- 12.Thron CD. A model for a bistable biochemical trigger of mitosis. Biophys. Chem. 1996;57:239–251. doi: 10.1016/0301-4622(95)00075-5. [DOI] [PubMed] [Google Scholar]
- 13.Ferrell JE, Jr, Xiong W. Bistability in cell signaling: how to make continuous processes discontinuous, and reversible processes irreversible. Chaos. 2001;11:227–236. doi: 10.1063/1.1349894. [DOI] [PubMed] [Google Scholar]
Associated Data
This section collects any data citations, data availability statements, or supplementary materials included in this article.


