Abstract
Specific bacterial lipopolysaccharides (LPS), IFN-γ, and unmethylated cytosine or guanosine-phosphorothioate containing DNAs (CpG) activate host immunity, influencing infectious responses. Macrophages detect, inactivate and destroy infectious particles, and synthetic CpG sequences invoke similar responses of the innate immune system. Previously, murine macrophage J774 cells treated with CpG induced the expression of nitric oxide synthase 2 (NOS2) and cyclo-oxygenase 2 (COX2) mRNA and protein. In this study murine J774 macrophages were exposed to vehicle, interferon γ + lipopolysaccharide (IFN-g/LPS), non-CpG (SAK1), or two-CpG sequence-containing DNA (SAK2) for 0–18 hr and gene expression changes measured. A large number of immunostimulatory and inflammatory changes were observed. SAK2 was a stronger activator of TNFα- and chemokine expression-related changes than LPS/IFN-g. Up regulation included tumor necrosis factor receptor superfamily genes (TNFRSF’s), IL-1 receptor signaling via stress-activated protein kinase (SAPK), NF-κB activation, hemopoietic maturation factors and sonic hedgehog/wingless integration site (SHH/Wnt) pathway genes. Genes of the TGF-β pathway were down regulated. In contrast, LPS/IFN-g -treated cells showed increased levels for TGF-β signaling genes, which may be linked to the observed up regulation of numerous collagens and down regulation of Wnt pathway genes. SAK1 produced distinct changes from LPS/IFN-g or SAK2. Therefore, J774 macrophages recognize LPS/IFN-g, non-CpG DNA or two-CpG DNA-containing sequences as immunologically distinct.
Keywords: bacterial, chemokines, cytokines, endotoxin shock, gene regulation, hematopoiesis, J774, monocytes/macrophages, murine
Introduction
Microbial DNA, compared to mammalian DNA, is relatively rich in highly immunogenic sequences of unmethylated cytosine or guanosine dinucleotides (hereafter referred to as CpG). Synthetic oligodeoxynucleotides (ODNs) can mimic many of the effects of natural microbial DNA, while DNA with missing or methylated CpG sequences generally fails to stimulate responses [1]. Indeed, depending on sequence, it may be immunosuppressive [2]. ODNs are generally short (20–30 bases) and can be synthesized to contain a phosphorothioate (Ps) backbone, producing a stable, nuclease-resistant compound. These compounds are effective immune adjuvants [3] and have been shown to shrink tumors [4], induce antibody responses against P. falciparum malaria [5] and attenuate concanavalin A-induced hepatitis in mice [6]. They are immunomodulatory agents, promoting host defense in the context of infection [7; 8; 9; 10]. However, CpG-invoked responses in clinical vaccine trials have been variable [5; 11; 12] and their mode of action is still under study [13; 14].
The bacterial component lipopolysaccharide (LPS) and bacterial or synthetic CpG provoke an immune response in humans and mice [15; 16] that includes cytokine production by activated macrophages, B-cell and splenocyte proliferation and DC maturation[17]. CpG induces a strong TH1-like immune response in humans, the principal cytokine effector of which is interferon γ (IFN-g) [15; 16; 18; 19]. IFN-g activates macrophage killing of endocytosed bacteria and promotes B-cell isotype switching to fix complement and promote phagocytosis [20]. LPS produces a TNFα-associated systemic inflammatory response involving neutrophilia, fever, and a rise in acute phase reactants in plasma in its mildest form; or disseminated intravascular coagulation, ARDS, cardiovascular failure, inflammation, intravenous thrombosis, hypoglycemia, and organ failure at its most severe [20]. Powerful immune activation by combined LPS + IFN-g has previously been observed, but has not been thoroughly investigated.
In leukocytes the LPS-stimulated release of TNFα and IL-1 can induce cyclo-oxygenase 2 (COX2) protein synthesis and inflammation at the site of infection. Evidence also indicates a possible role for this response in the resolution of inflammation [21]. In the liver, IL-1, IL-6 or TNFα will induce acute phase reactant proteins[20]. IL-12 stimulates the production of IFN-g in NK cells. NK-generated IFN-g also stimulates TNFα secretion from activated macrophages. IFN-g then acts in concert with TNFα on endothelium. Previously, it was shown that treatment with SAK2, a DNA sequence containing two CpG motifs, increased the production of nitric oxide (NO) and of prostaglandin E2 (PGE2) protein, as well as NOS2/COX2 mRNA and protein expression in murine J774 macrophages. NO production exhibited similar kinetics for LPS/IFN-γ and CpG treatments [22]. IL-6, IL-12 and TNFα proteins were also induced by both LPS and CpG[22].
Mammalian toll-like receptors (Toll/IL-1 receptor, TIR family, TLR) recognize patterns on microbial membrane surfaces and also certain endogenously-generated molecules of the innate immune response that enable discernment of self- from non-self molecules and initiate signaling of adaptive responses upon distinct pattern recognition. TLR4 has been identified as the receptor for LPS [23; 24] and TLR9 has been shown to recognize unmethylated bacterial CpG DNA [17]. Thirteen TLR’s exist, some with as-yet unidentified ligands [25]. Controversy still exists with respect to the function of TLRs, however (see [26] e.g.), and their function in antibody response continues to reveal new information [14].
Although most TLR responses depend on the second messenger molecule myd88 (myeloid differentiation factor 88) as the primary adapter, including microbial-stimulated signaling, TLR3 and TLR4 can activate myd88-independent responses via interferon response factor 3 (IRF3). These responses are controlled by the second messenger molecules TRIF or TRIF/TRAM for TLR3 or 4, and produce type I interferon. myd88 null mice were resistant to LPS-induced shock [27] but LPS could nevertheless activate NF-κB and MAPK in these deficient mice, as well as induce IFN-β production independent of myd88 in macrophages and dendritic cells (DC) [28]. In addition, myd88-independent TLR activation is involved in LPS-induced DC maturation [29]. Thus, LPS recognition by TLR4 initiates pleiotrophic responses that may be myd88-dependent or –independent, and, while myd88 is important for host defense against H. influenzae, TLR9 is not [26]. Since TLR9 depends on myd88 signaling, this discrepancy requires reconciliation.
Akira, et al. [29] previously showed that TLR’s activate antigen presenting cells in response to either LPS or CpG [30]. NF-κB signaling and transcriptional activation of target genes via the transcription factor AP-1 was demonstrated [30] after CpG-TLR signaling, as well as LPS (see above). However LPS and CpG signaling events differ [29]; myd88 is absolutely required for CpG-TLR9 but not LPS-TLR4 mediated signaling.
Our goals in the present study were to a) determine the mRNA-level involvement of PGE2, IL-6, IL-12 and TNFα as was previously observed at the protein level, b) confirm the identity of TLR pathway genes altered in response to each stimulus, c) generate a genome-wide profile for each stimulus (and particularly, compare the profile of the combination of LPS+IFN-g against that of CpG because an important downstream effector of CpG is IFN-g), and d) attempt to understand the mechanisms of CpG pattern recognition and immune activation by comparing the effects of CpG- and non-CpG-containing DNA sequences on murine J774 cells. We used microarray methods with real-time RT-PCR confirmation to measure gene expression after the example of [31] to examine responses to CpG DNA (SAK2), non-CpG DNA (SAK1), and LPS/IFN-g.
Experimental Procedures
Chemicals
Endotoxin-free media was obtained from GIBCO-BRL (Gaithersburg, MD). Phosphorothioate-backbone deoxyoligonucleotides (non-CpG or SAK1 and di-CpG or SAK2, see below) were from Midland Chemicals (Midland, TX), and were determined to be LPS-free by the limulus amoebocyte lysate assay, < 0.1 EU/mL. E. coli LPS was obtained from Sigma-Aldrich Chemical Co. (St. Louis, MO).
Cell Culture and Treatment
The murine macrophage cell line J774 was obtained from the American Type Culture Collection (ATCC, Rockville, MD). Cell culture was carried out as in [22]. Cells were plated in 24×11 mm well dishes, at a density of 1 × 10⁶ cells/well, in one mL of media. Control cells received medium only. LPS/IFN-g, SAK2 (phosphorothioate backbone nucleotide TCCATGACGTTCCTGACGTT) or SAK1 (phosphorothioate backbone nucleotide TCCATGAGCTTCCTGAGTCT) were pipetted simultaneously with medium in those treatments. In general, phosphorothioate (Ps) ODNs are more immunostimulatory than phosphodiester (Pd) ODNs of the same sequence, although the Ps ODN may alter the structure-function relationship of ODNs of various sequences [1; 2; 32]. All treatments used in this work were Ps ODNs. Cells were exposed to 100 units/mL IFN-g + 100 ng/mL LPS, 10 μg/mL SAK1 or SAK2 for 0.25, 0.5, 1.5, 3, 6 or 18 h under standard culture conditions. For gene expression studies, dishes were treated, media was removed by vacuum aspiration, dishes were rinsed 3 times with sterile PBS and TRIZOL™ reagent was added. RNA was extracted from TRIZOL™ using the manufacturer’s protocol (Gibco BRL). Total RNA was quantitated by spectrophotometric readings at 260 and 280 nm and quality examined by gel electrophoresis. Six μg of total RNA per sample (i.e. per nylon array) were spin-purified over a Pharmacia G50 column and used for RT-PCR (Clontech Atlas™ sequence-verified specific primers and α-33P d-CTP labeling) and hybridization to Clontech™ nylon Mouse Cancer 1186-gene arrays.
Morphology & Immunohistochemistry
Macrophage J774 cells were grown as described above in chamber wells (Nalge-Nunc™), cold-fixed (−20°C) in absolute ethanol, and stained with Hematoxylin and Eosin by standard histologic staining methods. Morphologic characteristics were examined by light microscopy. Cells similarly fixed in ethanol were post-fixed for five minutes in 100% acetone followed by five minutes fixation in sodium citrate antigen-retrieval solution and background-protein was blocked in a separate step. Cells were then stained with anti-IL-1β monoclonal antibody (Santa Cruz Biochemicals).
Large-Scale Differential Gene Expression Data Generation
33P-labeled cDNA probes were prepared after the method of Merrill, et al. [33]. Phosphor-imaging screens were exposed to Clontech™ nylon Mouse Cancer 1186-gene arrays (Clontech Inc., Palo Alto CA) for 24–36 hrs and the optical density was quantitated using OptiQuant™ software and a Cyclone™ scanner (Packard BioScience Co, CT). Image files were normalized using AtlasImage 2.0™ software (Clontech Inc., Palo Alto, CA) per the manufacturer’s instructions. Microsoft Excel™ spreadsheets were generated containing gene lists, signal intensities and background values. The local regression program NLR (please see [34] for details regarding this non-commercial software program) was used to determine fold change and statistical significance. Then data sets were analyzed using Spotfire Gene Analysis Software™ [35; 36; 37] and Eisen Clustering [38]. Heat maps, dendrograms and other visualization tools were used to explore these data. Early (0.25, 0.5, 1.5 h) or late time points (3, 6 18 h) were combined as single groups, referred to as ‘early’ and ‘late’, for the generation of significance p-values, and compared to their respective averaged early and late controls. Only those expression changes found to be statistically significant using NLR (p < 0.05) were then examined as to temporal behavior using Microsoft Excel™ spreadsheet plotting. NLR normalization was performed (assumes the majority of the genes on an array do not alter in expression levels; see [34]). Gene expression data were examined by treatment group and assigned to functional groups, pathway families, and superfamilies on a gene-by gene basis manually by the first author. For known pathways, data were compared for closeness of fit to up or down regulation of the pathway, and these changes noted in color (red = up, green = down, black = unchanged) for late SAK2 on the diagram for each pathway. Relationships for incomplete or unknown pathways were deduced by response patterns, statistical and interpretational analysis was performed, and changes in expression of several significantly changed transcripts were confirmed using semi-quantitative RT-PCR/immunocytochemistry [39]. (For further examples of the use of microarrays coupled with RT-PCR confirmation in similar studies, see [40; 41; 42; 43; 44; 45], etc.)
Semi-quantitative (real time) RT-PCR
We used semi-quantitative real time RT-PCR to verify previous data for cox2 and iNos (Nos2) mRNA, to confirm that the present treatments produced identical results to those obtained previously in our hands, and as a secondary method to validate selected microarray results, especially TLR9 expression. Total RNA prepared above was quantitated and analyzed by TaqMan™ real-time, RT-PCR (for a description of TaqMan™ as compared to other semi-quantitative RT-PCR methods, see [39]) after the method of [33]. Fold changes in expression were compared against 18s RNA and calculated using the ΔΔCT method, and graphed for comparison purposes (for a description of this method, please see [39]). Statistical analysis of replicates was carried out using the Student’s T test with p-values of <0.05 considered ‘significant’ (*), and <0.01 or less ‘highly significant’ (** or ***).
Results
Cell Culture and Treatment
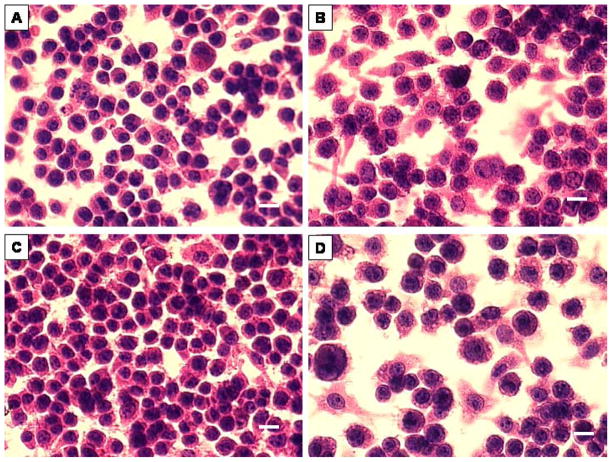
In order to confirm whether treatment resulted in macrophage activation and estimate relative cell health after each treatment, control, LPS/IFN-g, SAK1, and SAK2 treated murine J774 cells were maintained in culture, stained using routine H&E histologic methods, and examined using light microscopy. Control J774 cells (Fig. 1) were generally rounded in outline, with finely granulated eosinophilic cytoplasm and a single darkly stained eccentrically placed oval nucleus, typical of an inactive macrophage or tissue histiocyte. Exposure to LPS/IFN-g or SAK2 induced distinct nuclear enlargement and less dense staining with clear chromatin stippling and cytoplasmic expansion, giving these cells a more polyhedral outline and indicating macrophage activation [22]. Cells treated with SAK1 were morphologically indistinguishable from untreated controls.
Figure 1.
Murine macrophage J774 cells stained with H&E. (A) control, (B) LPS/IFN-γ treated, morphologic evidence of activation, (C) non-CpG treated, indistinguishable from control, (D) CpG-treated, showing activation. Bar = 10 μm.
Immunohistochemistry
In order to determine whether IL-1β protein was up regulated after each treatment, immunologic staining was performed. Immunohistochemical staining for IL-1β (Fig. 2) revealed only faint brown staining in the plasmalemma of untreated and SAK1-treated J774 macrophages. By contrast, both SAK2 and LPS/IFN-g-treated cells showed strong diffuse staining throughout the cytoplasm.
Figure 2.
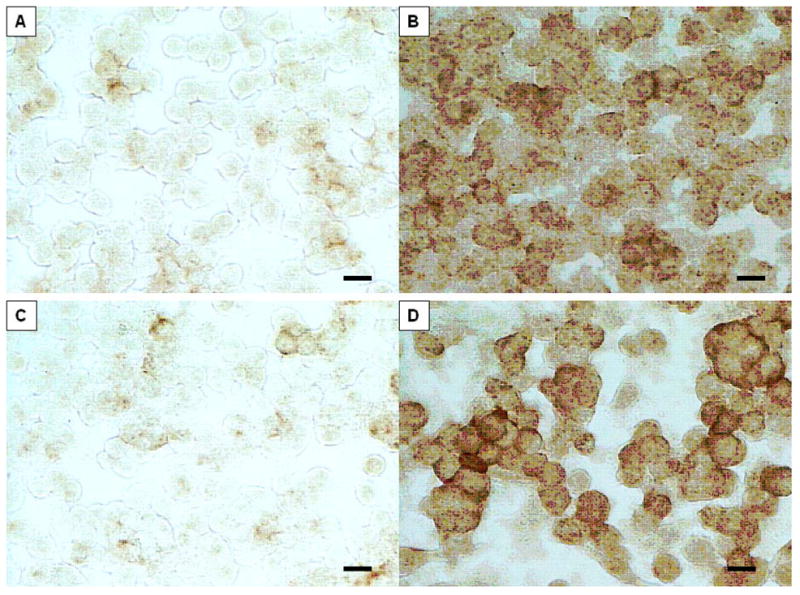
Identical samples to those shown in Figure 1, but immunostained using mAb to IL-1β; note marked up regulation of this interleukin is confined to the cells exhibiting morphologic evidence of activation, i.e. those treated with LPS-IFN-γ or CpG. Bar = 10 μm.
Differential Gene Expression
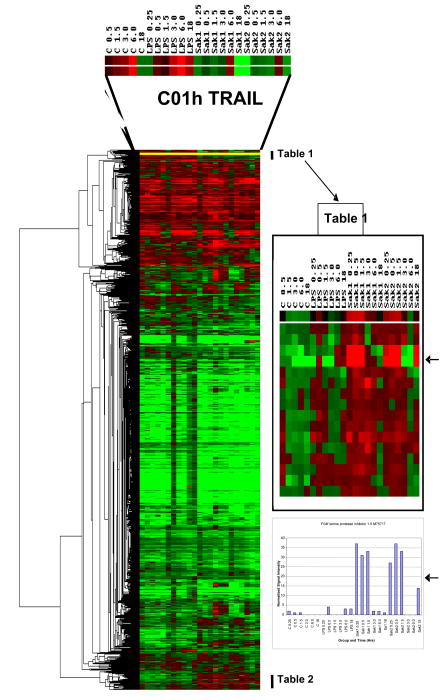
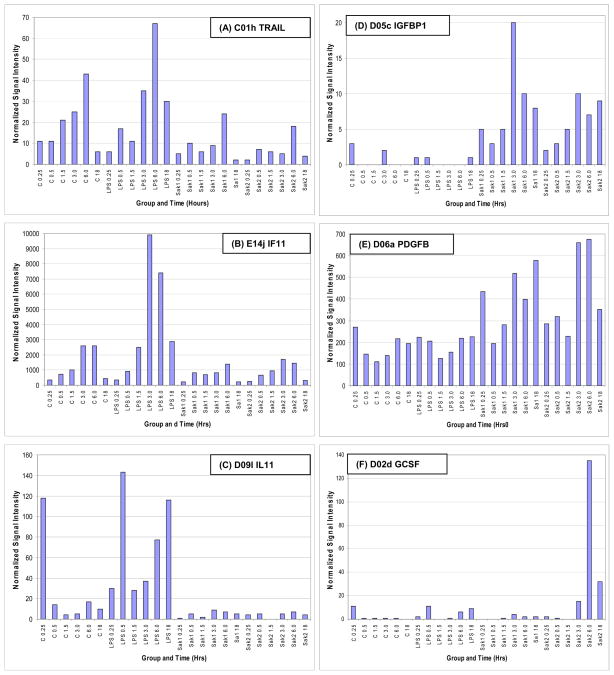
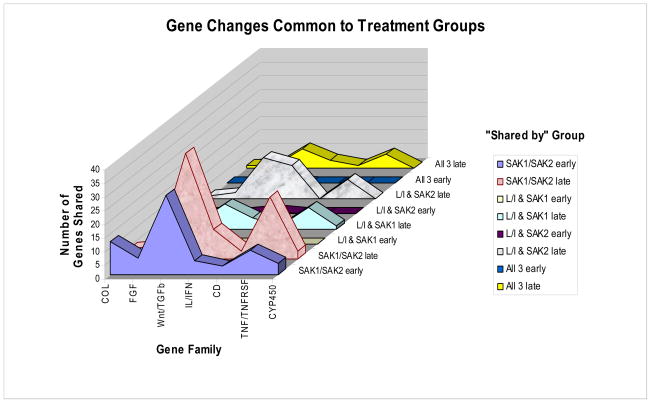
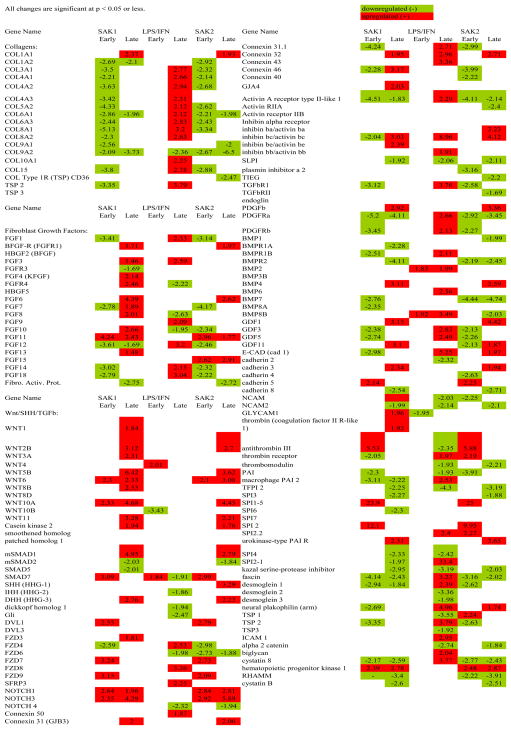
Gene expression data are summarized in Fig. 3 and extracts from it (Tables 1–2) and in Table 3, for each treatment vs. control at early and late time points. Response dynamics are presented as bar graphs of normalized signal intensity (Fig. 4) for several genes with representative temporal patterns. A number of genes exhibited an increase in expression between 15 min and 6 hr and returned to the 15 min level by 18 hrs (data not shown). These changes could have been in response to media replacement. Accordingly, care must be taken in data interpretation when using ratios. The heat map of ratios permits the detection of many broad responses, including groups of genes that are up regulated in response to all three treatments (Tables 1, 2) and genes that are up or down regulated in response to specific treatments. For instance, transcripts that responded to SAK2 but not LPS/IFN-g are shown at the bottom of Fig. 3 and in Table 2. A clear instance of up regulation of granulocyte colony stimulating factor (G-CSF) by only SAK2 is shown in Fig. 4F. The three early and late time points were combined to generate statistical significance values. Conclusions from statistical analyses of ‘early’ and ‘late’ time course observations generally agreed with time course measurements, although for microarray experiments individual time points were not analyzed by statistics due to insufficient numbers of replicates (n=2). Table 3, derived from genes that were significantly dysregulated in early/late treatment groups, details the expression changes for several important signaling pathways. Note the lack of response to early LPS treatment, indicating differing kinetics between LPS and both SAK1 and SAK2 treatments. Changes shared by treatment groups are shown in Fig. 5.
Figure 3.
Dendrogram and heat map generated by clustering (hierarchical, uncentered) of all sample data expressed as a ratio of the respective 0.25 h control (untreated murine macrophage J774 cellular mRNA) time point, using Eisen software [38]. Red indicates up regulation and green down regulation. The group of transcripts at the top of the figure exhibit up regulation for each treatment group which is more clearly shown in the form of normalized signal intensity data; the example of TRAIL is shown in Figure 4A. Gene lists for selected regions of the heat map are shown in Tables 1 and 2. These genes were enlarged to show differences between CpG/non-CpG and control or LPS/IFN-γ. The rows of colored squares in the enlarged inset are listed on Tables 1 in order from top to bottom and similarly for genes of Table 2 that are indicated on the large heat map. The arrows on the right-hand side highlight a comparison between the ratio and the normalized signal intensity data set for SPI 1–5, which is a good example of a gene shared by non-CpG and CpG, but differing from control and LPS/IFN-γ.
Table 1.
Extracted List 1 From Figure 4.
| Table 1 (see Figure 4) |
| F01d fibroblast activation proteinY10007 |
| C09g interleukin 13 receptor alpha (IL-13R- alpha; IL-13RA)S80963 |
| E05k maternal embryonic message 2 (MEM2)X95350 |
| B14l glycoprotein galactosyltransferase alpha 1, 3M26925 |
| B05l crystallin alpha 1J00376 |
| A10a zonadhesinU83190 |
| A06l cell division cycle 10 homolog (CDC10)AJ223782 |
| F10k utrophinX83506 |
| C13g low-affinity IgG Fc receptor III (FCGR3)M14215 |
| C02e caspase 1 (CASP1); IL-1-beta convertase (IL-1BC); IL-1-beta-converting enzyme (ICE)L28095 |
| C01h tumor necrosis factor superfamily member 10 (TNFSF10); TNF-related apoptosis inducing ligand (TRAIL)U37522 |
| B13i T-complex protein 1 epsilon subunit (TCP1-epsilon); CCT-epsilon (CCTE; CCT5)Z31555 |
| F09m scinderinY13971 |
| F01h a disintegrin and metalloproteinase domain 9 (ADAM9); meltrin gammaU41765 |
| F13h xeroderma pigmentosum group A complementing protein (XPA)X74351 |
| F03j cystatin BU59807 |
| E12k phosphatidylinositol 3-kinase, C2 domain containing, alpha polypeptideU52193 |
| F06c protein tyrosine phosphatase, receptor type, OU37465 |
| E01l interleukin 18 receptor accessory protein (IL-18RAP)AF077347 |
| C02c caspase 8 (CASP8)AF067834 |
| F07d non-muscle cofilin 1 (CFL1)D00472 |
| F11c ataxia telangiectasia mutated in human beings homolog (ATM)U43678 |
| E11a cell line NK14 derived transforming oncogeneS53270 |
Note: Formatted to include alphanumeric code gene identifier on Clontech array and brief gene name. For full details see gene list on Clontech web site.
Table 2.
Extracted List 2 From Figure 4.
| Table 2 (see Figure 4) |
| C10m glucocorticoid receptor form AX13358 |
| D09c wingless-related MMTV integration site 7a protein (WNT7A)M89801 |
| B04j Harvey rat sarcoma oncogene subgroup R protein (R-RAS)M21019 |
| C03j clusterin precursor (CLU); clustrin; apolipoprotein J (APOJ); sulfated glycoprotein 2 (SGP2; mSGP2)L08235 |
| A13f integrin alpha 6 (ITGA6)X69902 |
| E02m spleen tyrosine kinase (SYK)U25685 |
| F02n proteasome (prosome, macropain) 26S subunit 4 (PSMC4); CAR-interacing protein 21 (CIP21); MIP224L76223 |
| E05g large tumor supressor 1 (LATS1)AF104414 |
| C06n FMS-like tyrosine kinase 3M64689 |
| D06a platelet-derived growth factor B polypeptideM84453 |
| D02h Cek 5 receptor protein tyrosine kinase ligandU12983 |
| F10c talin (TLN)X56123 |
| E12l phosphatidylinositol 3-kinase, regulartory subunitY13569 |
| D05c insulin-like growth factor-binding protein 1 (IGF-binding protein 1; IGFBP1; IBP1) X81579 |
| B04l ski proto-oncogeneU14173 |
| D08e vasodilator-stimulated phosphoproteinAF084548 |
| E11e guanine nucleotide binding protein, alpha inhibitiM13963 |
| E04n hematopoietic progenitor kinase 1Y09010 |
| F08j kinesin motor protein C2 (KIFC2)U92949 |
| B03a Lfc proto-oncogeneU58992 |
| C07k nerve growth factor receptor AF105292 |
| D09b wingless-related MMTV integration site 6 protein precursor (WNT6)M89800 |
| E07m mitogen- & stress-activated protein kinase 2 (mMSK2)AF074714 |
| A09k syndecan 4 precursor (SDC4)D89571 |
| D03c fibroblast growth factor 4 precursor (FGF4); KFGF; HBGF4M30642 |
| C06f erbB2 proto-oncogene; neu proto-oncogene; HER2L47239 |
| F11h DNA polymerase beta (POLB) [mouse homolog of human]D29013 |
| C01j tumor necrosis factor superfamily member 9 (TNFSF9)L15435 |
| F04g serine protease inhibitor 2D00725 |
| F04f serine protease inhibitor 1–5M75717 |
| C13 m lymphocyte antigen 68 (LY68); AA4.1; C1qrpAF081789 |
| E06c mitogen activated protein kinase kinase 2S68267 |
| E11n transducin beta-2 subunitU34960 |
| B13l T-complex protein 1 eta subunit (TCP1-eta); CCT-eta (CCTH; CCT7)Z31399 |
| F11a 8-oxoguanine DNA glycosylase 1 (OGH1; OGG1); mutM homolog (MMH)Y13479 |
| F12e DNA double-strand break repair RAD21 homolog; HR21SP; PW29D49429 |
| A05n p58/GTA; galactosyltransferase associated protein kinase (cdc2-related protein kinase)M58633 |
| B12f NADPH-cytochrome P450 reductase (CPR); PORD17571 |
| F05i protein tyrosine phosphatase non-receptor type 21 (PTPN21); PTPD1; PTP RL10D37801 |
| C07h lymphotoxin receptor (TNFR family)U29173 |
Table 3.
Comparison of Treatments
 |
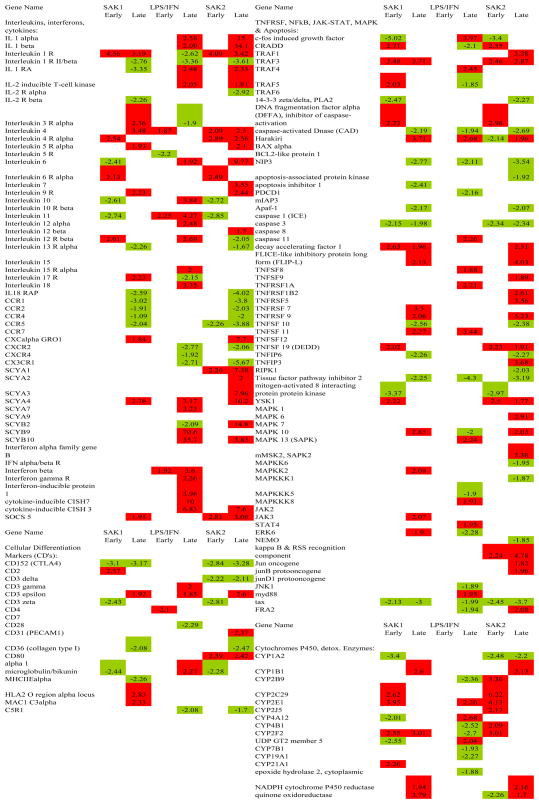 |
Figure 4.
Normalized signal intensity data showing kinetics of expression for each treatment, and including examples of transcripts that shown similar patterns of expression with differing amplitude (A, B), down regulation in non-CpG/CpG (C), up regulation with non-CpG/CpG (D, E), and up regulation with CpG only (F). These genes were chosen to illustrate shared temporal patterns in some genes between non-CpG and CpG treatments.
Figure 5.
Gene expression changes shared by gene family groups at early and late time points for all 3 treatments. Similarities are greater between non-CpG and CpG for several major families, than between either group and LPS/IFN-γ.
Changes in Specific Gene Families
Extracellular Matrix (ECM) Genes. Numerous collagen genes were unchanged early but up regulated late after treatment with LPS/IFN-g (Table 3). SAK1 and SAK2 both induced down regulation of many collagens early and a few late. SAK1 and SAK2 down regulated FGFs (fibroblast growth factors) (early) but LPS/IFN-g had no effect; at late time points all three treatments produced up regulation.
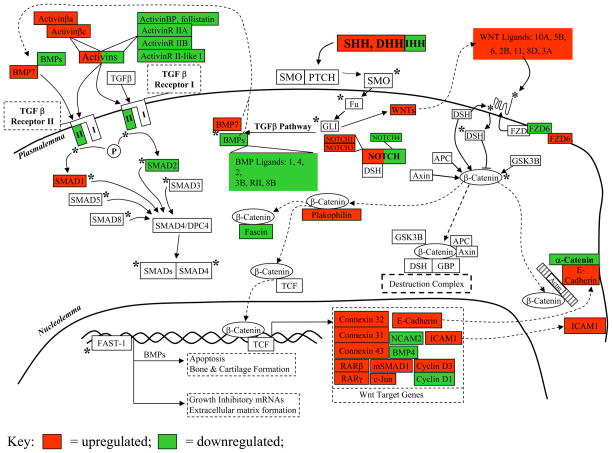
Wnt/SHH/TGF-β Genes. Fig. 6 and Table 3 show the physiological context of the results of the three treatments vs. control. SAK1 and SAK2 produced up regulation of SHH/Wnt pathway components and simultaneous down regulation of the alternative TGF-β pathway. The latter may explain the lack of strong ECM gene induction and the observation of increased growth/proliferation of cells after SAK2 treatment. By contrast, cells treated with LPS/IFN-g exhibited an early up regulation of Wnt signaling and a slight later down regulation, possibly representing a negative feedback response. Also by contrast there was a marked increase in TGF-β pathway mRNAs. After an early increase in the TGF-β inhibitor SMAD7 (Mothers_against_decapentaplegic_homolog_7), there was a late down regulation in SLPI (secretory leukocyte protease inhibitor), another TGF-β inhibitor, which may explain the late TGF-β-related genes surge. In late treatments there was also a strong increase in COL (collagen), FGF, other ECM-related genes, and the proteolytic latent TGF-β-activating gene plasmin.
Figure 6.
Sonic Hedgehog, Wnt and TGF-β signaling pathway gene expression in CpG late treated macrophages [70; 71; 72; 73], see discussion. Small type = specific DGE changes. Green = down regulated, Red = up regulated, * = activation, P = phosphorylation, → = binds/interacts with, —| = blocks binding/interaction of.
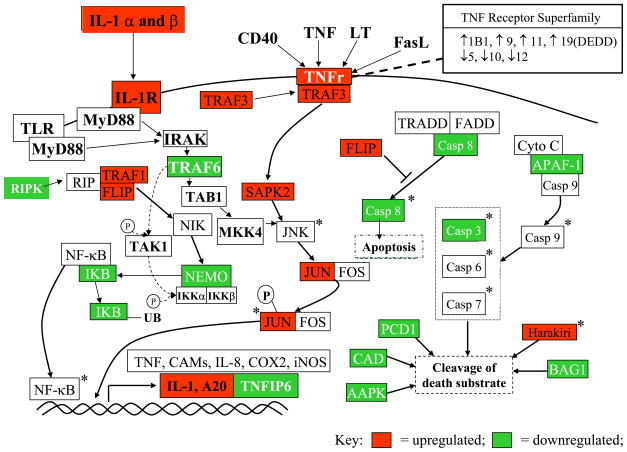
TNF Response Genes. There was a TNFRSF response (Fig. 7) in SAK2 treated cells, as demonstrated by up regulation of NF-κB genes and AP-1. Down-regulation of pro-apoptotic genes PCD-1 (protocadherin 1) and CAD (cadherin) was shared by macrophage activators SAK2 and LPS/IFN-g, and APAF-1 (apoptotic protease activating factor 1), BAG-1 (bcl-2-associated athanogene-1), AAPK (apoptosis-associated protein kinase), CASP8 (caspase 8) by both DNA treatments. Activation of the TNF response cascade by LPS/IFN-g was weak. SAK1 and SAK2 agreed in TNF pathway responses, even though SAK1 did not induce morphologic macrophage activation.
Figure 7.
TNFSFR and NF-κB signaling activation during macrophage activation: CpG late responses. Downstream effector molecules for these up regulated receptors were up regulated (TRAF3, SAPK2, TRAF1, FLIP, JUN) and the alternate pathway leading to apoptosis was down regulated (Casp8, APAF-1, BAG-1, PCD1, CAD), lending support to the conclusion that the entire pathway was activated and steered away from the apoptotic outcome. AP-1 components were up regulated, IκB was down regulated, and transcripts associated with transcription factor binding to DNA and protein products (TNF, COX2, iNOS) were increased (IL-1, A20) at late time points after treatment with CpG. Green = down regulated, red = up regulated, * = activation, P = phosphorylation, → = binds/interacts with, —| = blocks binding/interaction of.
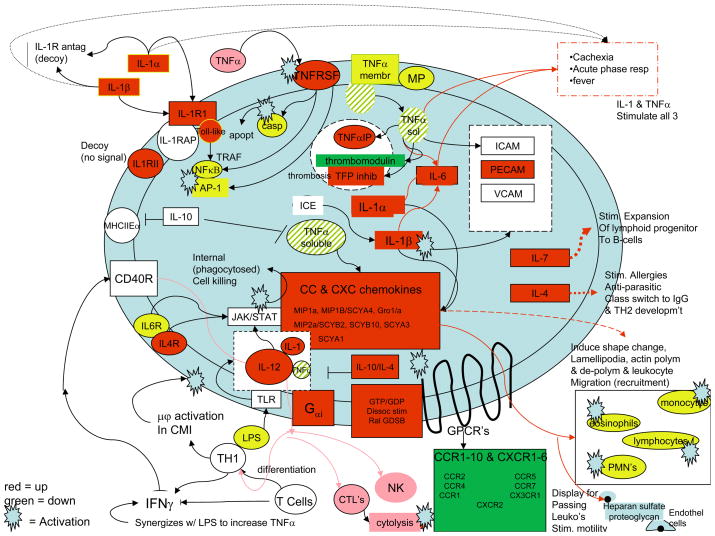
Chemokines and Interleukin Genes. SAK2 up regulated TNFα pathways of interleukin and chemokine activation (Fig. 8 and Table 3). The observed receptor down regulation may have occurred as a result of receptor desensitization. Down regulation of thrombomodulin, a prototypical TNFα response associated with sepsis-related coagulation, IL-1-RII (interleukin 1 receptor II), a decoy receptor, TFPI (tissue factor pathway inhibitor), a TNFα-associated response, and MHCIIEα (major histocompatibility IIEα) occurred. Late LPS/IFN-g responses were similar but weaker. The TNFα pathway induces acute-phase proteins, expansion of lymphoid progenitors, maturation to B- and T-cells, differentiation of T-cells to TH1, activation of macrophages, cytolysis of targets by NK cells, and stimulation of leukocyte motility. Chemokine signaling activates eosinophils, monocytes and lymphocytes via CC chemokines and PMN’s via CXC chemokines.
Figure 8.
Chemokine and Interleukin Responses of Activated J774 Macrophages in CpG late treatment. LPS binding to a TLR increases TNFα, IL-1 and IL-12 [15; 16]. Effects of all 3 are present in late CPG-treated cells. Membrane-bound or soluble/secreted TNFα, generated by cleavage with membrane-bound MP induces IL-1α, IL-1β, IL-6, CAM’s. CAM’s increase adherence of leukocyte integrins/selectins to targets. IL-6, TNFα, IL-1 induce acute phase proteins (liver). Precursor IL-1β is cleaved by ICE to active IL-1β. IL-1α and β share effects with TNFα (induction of febrile state, acute phase proteins, and cachexia) at high concentrations, induce CC- and CXC-chemokines, activating eosinophils, monocytes and lymphocytes (CC-chemokines) or neutrophils (CXC-chemokines). CXC-chemokines are bound by heparin sulfate proteoglycans on endothelial cells, displayed to passing leukocytes that then bind to CAM’s. CC-chemokines induce shape changes in cells (lamellipodial induction and actin polymerization/sequential depolymerization), facilitating leukocyte migration/recruitment to site of inflammation. CC- and CXC-chemokines bind to cognate receptors (G-protein-coupled receptors). G-protein signaling components are likely involved (Gαi, RalGDSB). TNFα also induces thrombosis via up regulation of tissue factor, down regulation of thrombomodulin. TNFα binds TNFR’s, either initiating apoptosis via caspase or activating transcription factors AP-1/NFκB, inducing cell-survival genes (see Figure 9). AP-1/NFκB signaling is also activated by IL-1 binding IL-1RI in association with the IL-1RAP. IL-1-RI has a cytoplasmic toll-like domain. IL-1 is induced by TNFα in an amplification cascade. Either of two decoy receptors may bind IL-1, produce no signal (IL-1R antagonist, IL-1 RII) (negative feedback regulators). IL-10 is immunosuppressor, blocks effects of TNFα/IL-12 thus can also block IL-1. IL-4 also blocks IL-1,/TNFα/IL-12. It is pro-allergic, important in anti-parasitic responses, class switching to the IgE isotype and TH2 development. IL-12 is central to activation of cytolytic activity in NK cells/CTL’s, acts upon NK/T-cells, induces production of IFN-γ which may activate macrophages via CD40 receptor, induce IL-12. IL- 4, 6, 12 et al. signal via JAK/STAT. Thus IL-12 stimulates killing of phagocytosed microbes by activated macrophages. IFN-γ synergizes with LPS, effects IL-1, TNFα, IL-12 up regulation. IL-18 acts on T-cells, induces production of IFN-γ. IL-12, also induces Helper T cell differentiation into TH1. IL-7 stimulates expansion of lymphoid progenitor cells to B-cells (in thymus; T-cells). CPG induced many TNFα and IL-1 effects, up regulation of numerous chemokines, down regulation of cognate receptors.
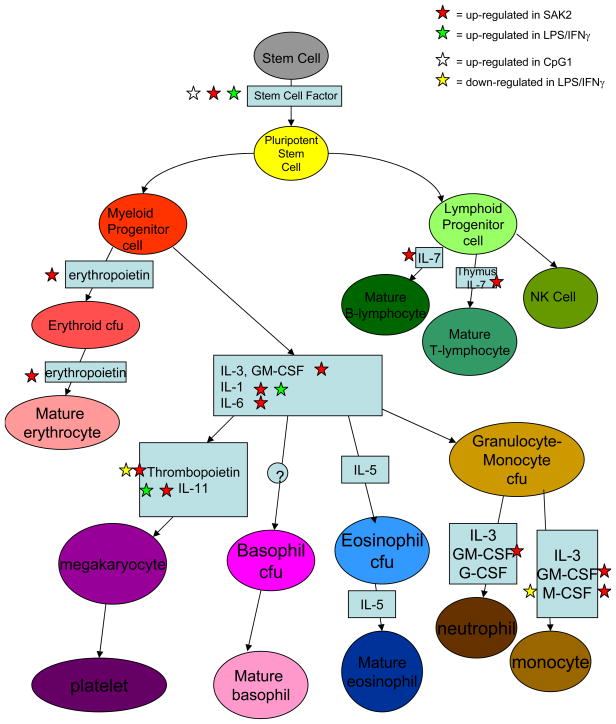
Maturation Factor Genes. SAK2, but not LPS/IFNg or SAK1 showed increased maturation factor expression (except for eosinophils). Maturation factors such as those produced by pluripotent stem or myeloid-lymphoid progenitor cells will induce maturation in multiple cell types, as shown in Fig. 9.
Figure 9.
Maturation factor mRNAs induced by CpG but not by LPS/IFN-γ or non-CPG treatment of J774 macrophages. Adapted from [20].
Semi-quantitative real time RT-PCR
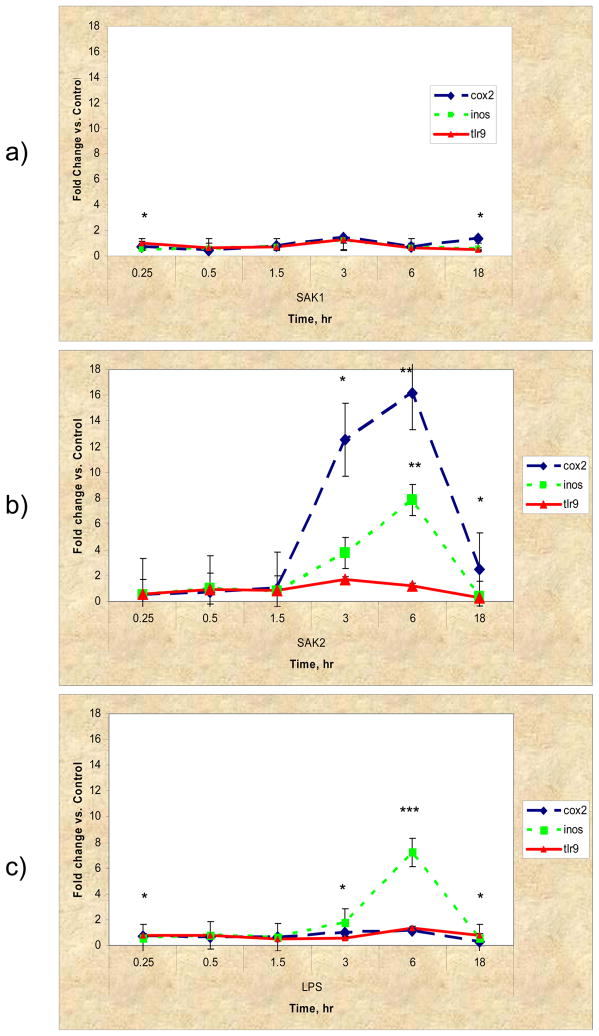
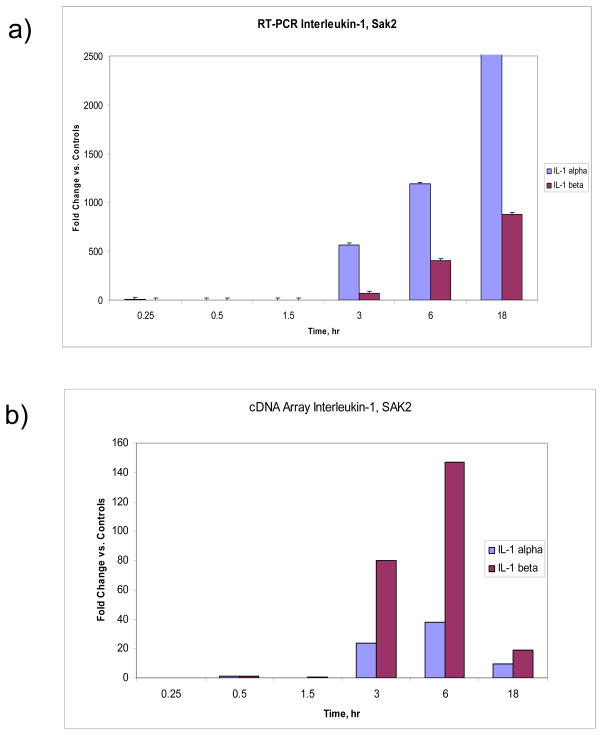
Fig. 10 shows the results from the Taq-Man™ assay for COX2, iNOS (inducible nitric oxide synthase, NOS2) and TLR9. For SAK1 non-CpG DNA there was no apparent up regulation in any of the three genes compared to controls, however cox2 and iNos were significantly different than TLR9 at 15 min. and 18 hr (p<0.05). SAK2 and LPS/IFN-g treatments both showed elevated iNOS expression at later time points (SAK2: iNos vs. cox2 at 3, 6, 18 hr – p<0.05, p<0.01, p<0.05 resp.; iNos vs. TLR9 at 6 hr – p<0.01 and LPS: cox2 vs. iNos at 6 hr – p<0.001, TLR9 vs. iNos at 3, 6 hr – p<0.05, p<0.001, resp.). SAK2 and LPS demonstrated clear up regulation of COX2 (SAK2: cox2 vs. TLR9 at 3, 6, 18 hr – p<0.05, p<0.01, p<0.05, resp.; cox2 vs. iNos – see above and LPS: cox2 vs. iNos – see above, cox2 vs. TLR9 at 15 min., 3 and 18 hr. – p<0.05). No treatment showed significant TLR9 up regulation compared to controls. However, myd88, a known signaling intermediate for several TLRs, was upregulated (1.95-fold, p<0.05) in the late LPS-treated group. IL-1Rα and IL-1α and β were upregulated at 3, 6 and 18 hr (Fig. 11 compares the fold changes in the latter two genes for both methods used, microarrays and real time RT-PCR). Little or no effect on IL-18 or tyrosine phosphatase occurred in the SAK2 group (data not shown). LPS/IFN-g-treated macrophages showed moderate up regulation of IL-18 at 18 hr (data not shown). SAK1-treated cells showed moderate up regulation of IL-1α, especially at 0.25 and 18 hr, and of IL-1β, IL-1Rα, IL-18 and tyrosine phosphatase at 18 hrs (data not shown), but there was no change measured in the gene expression of these genes. All other changes were corroborated. Fig. 11 shows the upregulation of IL-1α and β in SAK2 (late), and Table 3. shows that both LPS/IFN-g and SAK2 had upregulated IL-1α and β at late timepoints. Fig. 5 demonstrates that SAK2 and LPS/IFN-g (late) groups shared many gene changes from the IL/IFN gene family.
Figure 10.
TaqMan™ semi-quantitative real-time RT-PCR analysis of cox2, iNos and tlr9 gene expression changes in a) non-CPG, b) CPG, c) LPS/IFN-γ. CPG and LPS/IFN-γ show similarities in iNos expression. CPG shows strong cox2 expression at late time points only. No treatment up regulated tlr9. Fold change was calculated by first normalizing against 18s RNA, then comparing to controls and calculating 2(−Δ Ct) (the Δ ΔCt method). Error bars represent ±S.E.M. *p<0.05, ** p<0.01, *** p<0.001.
Figure 11.
a) Expression levels of Interleukin-1 α and β, detected using LSDGE, showing almost identical up regulation patterns at late time points only, b) Expression levels of Interleukin-1 α and β, detected using semi-quantitative real time RT-PCR, showing similar up regulation patterns confined to the late time points, but differing in dynamic range to the cDNA data. All data were normalized by comparing to 18s RNA, then to controls, and fold changes quantified using the Δ ΔCt method (see Materials & Methods) For data shown in a) error bars represent ±S.E.M. For a) and b) all genes shown are p<0.05 or smaller, as compared to controls.
Discussion
Macrophage activation: TLR, NFκ-B and TNF-α Pathways
TIR/TLR’s contain a toll-like motif and TLR9 is accepted as the cognate receptor for CpG, and TRAF6 (toll-like receptor associated factor 6) and myd88 are the downstream signaling effectors [17; 29; 30], but we observed only modest myd88 upregulation (LPS, late) and gene expression changes in mapk8ip and two PI3 kinase-subunits (Fig. 3 and Table 3) which are part of the TLR pathways activating IRF3 (interferon response factor 3) transcription and the recruitment of leukocytes. Possibly the regulation of TLR9 occurred through receptor turnover, post-translational modification, or other TLRs were also involved. We observed up regulation of TLR/IL-1R, a known receptor for macrophage activation, and TNFRSF messages. TNFα binding to TNFRs or IL-1 binding to IL-1R can activate NF-κB signaling and transcription of NF-κB target genes [46], evidence of which we observed here. Others [47] have described a myd88-independent NF-κB activity which is not PKR/TRAF6 inducible. We suggest that the observed CpG-initiated, NF-κB-related changes are due to upstream changes in IL-1R/TNFRSFs and challenge others to confirm these observations. To our knowledge, the involvement of TNFα and IL-1 in CpG-related signaling as noted here has not previously been described.
Furthermore, different activating sequences in the CpG motif exist in humans and mice, and specific TLR’s bound differ by tissue [48; 49; 50; 51; 52]. Previous in vitro experiments in mice used RAW 264.7 cells (a macrophage-like cell line), ANA-1/RAW264.7/J774, spleen/RAW264.7, RAW264.7/J774 or primary BMDC/peritoneal macrophage cells[17; 29; 30; 53; 54; 55; 56]. Variations in TLR4, 5, 7 and 9 protein and mRNA expression in RAW264.7 after either CpG or LPS treatment have indicated that TLR expression varies by cell line or tissue of origin, and is “highly dynamic and tightly regulated…”; some of the specific changes listed agree with our results [57]. Others [58] have suggested a nucleic acid dosage model for CpG-TLR activation.
Other results presented here affirm those previously reported for stress kinase and MAPK pathway involvement [53], SOCS 3, 5 & 7 up regulation [55], and IL-10 and 12 production [54]. The activation of TNFα-mediated chemokine responses is indicated by these data, in agreement with up regulated protein expression [22] after treatment with CpG and LPS/IFN-γ. CpG and LPS/IFN-γ produced classic macrophage activation in culture and also as measured by gene expression. However, all three treatments produced distinct patterns of expression, with some gene changes not shared.
Generation of Inflammatory Precursor Cells: Maturation Factors Responses
CpG induced the expression of specific maturation factors involved in the differentiation of multiple hemopoietic cell types, consistent with previous studies showing that CpG could induce extramedullary hemopoiesis [59] and increase DC precursors for purposes of immune-regeneration[59].
Negative Feedback of Inflammatory Response: IL-11 Effects
Treatment of macrophages with LPS activates IL-11 [60], which is generally considered to be anti-inflammatory/inflammation-limiting [61]. In the present study LPS induced activation morphologically and by gene expression, while both DNA treatments down regulated IL-11 expression. IL-11 is hemopoietic, thrombopoietic, involved in bone metabolism, and is a member of the IL-6 family of gp130-utilizing proteins. It plays an important role in the restoration and protection of gastric and oral mucosa. In addition, it is induced by PKC inhibitors through the pathway: ↑[TNFα + IL-1α] → ↑cytosolic PLA2 → ↑COX2→ ↑PGE2→ ↑IL-11 in rheumatoid synovial fibroblasts [62]. CpG-treated macrophages demonstrated increased IL-1α mRNA and protein TNFα levels, but not increased IL-11, while LPS/IFN-γ showed increased TNFα protein, IL-1α and IL-11 mRNA. Thus, the pathway may be activated by LPS/IFN-γ but not CpG. In human bone marrow stromal cells, agonists for PKA or PKC were also found to stimulate IL-6/IL-11 production [63]. Inhibition of both IL-11 and IL-10 production resulted in a synergistic 23-fold induction in TNFα protein [61]. Here, CpG showed early down regulation of IL-10 and 11 and late down regulation of IL-11, and in previous studies under identical conditions CpG exhibited the highest protein TNFα levels of the three treatments. This would be expected due to the observed decreased IL-10, 11 and PLA2 expression, and may in part explain the adjuvanticity of CpG.
IFN-γ has been previously shown to inhibit the production of IL-11 from IL-1α-stimulated rat synovial fibroblasts maintained in continuous culture, but not from freshly cultured cells taken from patients with rheumatoid arthritis. Rather, those cells were shown to produce high levels of IL-11 [64]. The present data indicate a transcriptionally-mediated early and late up regulation of IL-11 by LPS/IFN-γ. IL-11 also stimulates the production of TIMP1 (tissue inhibitor of metalloproteinase 1), and synergizes with SCF (stem cell factor), IL-3, -4 and -6 in murine primitive hemopoietic cell development [65; 66]. The present data show a similar up regulation of MMP3, 11 and 15 (matrix metalloproteinases), SCF, and IL-4 and -6. Interestingly, an NF-κB-consensus motif binding site is found in the promoter region of IL-11, pointing toward NF-κB-initiated transcription as another possible pathway to induce expression of IL-11. LPS induces NF-κB nuclear translocation and binding, but such activity is impeded by treatment with recombinant human IL-11 [67] (and levels of inhibitory IκBα and IκBβ mRNA’s were increased here) therefore increased IL-11 could have negatively regulated the NF-κB pathway. In fact, we observed JNK1 (jun n-terminal kinase 1) down regulation in LPS/IFN-γ-treated macrophages that showed IL-11 up regulation. Direct pathway activation may have occurred in CpG and non-CpG DNA treated groups through observed decreases in IL-11 message. It is not clear how CpG activation of TLR/IL-1R and decreased IL-11 message might converge or crosstalk to produce downstream activation of NF-κB.
Wound Repair: Sonic Hedgehog/Wnt/TGF-β Responses
During D. melanogaster embryogenesis, Wnt, SHH/DHH/IHH (sonic, desert, and Indian hedgehog), Notch, and DVL (disheveled) have roles in cellular differentiation, tissue polarity, and hemopoiesis [46]. In mammals, TGFβ pathway activation results in (1) apoptosis and/or bone and cartilage formation if BMP’s are the signaling effectors, or (2) growth inhibition and ECM formation if activins or TGF-β. An alternative MAP kinase-like pathway has also been suggested [46]. Steering TGFβ pathway activation away from or toward apoptosis might thus be achieved through the simultaneous regulation of inhibitors of apoptosis such as IAP’s (inhibitors of apoptosis)/bcl-2 (B-cell CLL/lymphoma 2) and activating caspases/Apaf-1 (apoptotic peptidase activating factor 1). Here, in late CpG, SHH and DHH, their downstream signaling molecules (Wnts, FZD9 [frizzled 9]) and transcriptional targets were up regulated, indicating increased cell-cell communication, cell proliferation and TGF-β signaling. Many elements were shared between both DNA treatments as well as between late CpG and LPS/IFN-γ, suggesting the possibility of a common downstream pathway for all three. Collagens were down regulated at early time points for both DNA treatments and some remained down regulated at late time points in CpG. FGF mRNAs, in contrast, were up regulated in both DNA treatments at late time points. A possible explanation is that macrophages down regulate collagens in order to maintain migration through tissue, but secrete FGFs in order to signal to fibroblasts and activate them to initiate ECM deposition and associated repair processes.
Some of the expected effects of TGF-β are opposite to those of TNFα. Thus, since increased TNFα protein was previously measured after CpG and LPS/IFN-γ treatments [22], the present result would not be expected to show unambiguous TGF-β activation. With respect to the known growth inhibitory effects of TGF-β [68], we observed increased numbers of dividing cells with LPS/IFN-γ and CpG treated groups that showed obvious morphologic activation. This result is not in agreement with known TGF-β growth inhibitory effects but agrees with channeling of the pathway toward observed increases in SHH/Wnt-induced cell-cell communication and cell proliferation. Non-CpG treated cells exhibited growth stasis. The key observation is that both DNA treatments produced very similar gene expression patterns in early and late time points for the SHH/Wnt and TGF-β pathways, therefore, under these circumstances, the control of cell proliferation is regulated by an ancillary event that is not shared between these two treatments. CpG DNA causes macrophage activation and cell proliferation, while non-CpG DNA does not. In CpG treated cells, the up regulation of cyclin D3 and cdk4/6, a known result of Wnt-pathway up regulation, agrees with the evidence of cell proliferation in late CpG. TGF-β itself has also been observed to control the cell cycle G1→S transition independently of growth-factor mitogenic stimuli [68], illustrating neatly the sometimes apparently contradictory effects of TGF-β on cell growth and differentiation. TGFβ also affects cell adhesion, and TGF-β1 plays a crucial role in the process of clot formation and wound healing. As a product of platelet degranulation it signals to fibroblasts, PMN’s and monocytes, bringing about their chemotactic attraction to the site of infection, and can result in an autocrine growth loop for those cell types. TGF-β also acts upon activated cell types to limit inflammatory processes, rendering them refractory to further cytokine stimulation [69].
Conclusions
The use of microarrays will provide surrogate biomarkers for therapeutic efficacy or for immunotoxicity. It is becoming clear that there will be specific CpG motifs to enhance macrophage activity (and the many specific macrophage activities), NK cell activity, CTL activity, humoral antibody production, and even for different types and subtypes of immunoglobulin production. As CpG motifs become better defined, microarrays will be used to determine the matching patterns and subsequently to use HTS to screen new chemical entities. Furthermore, as we become more familiar with the microarray patterns, new applications and new therapeutic targets will emerge from these patterns.
Acknowledgments
This work was supported in part by grants from the Veterans Affairs Rehabilitation Research and Development Service, and by NIH grants AR-48182, AR-47920 and AR-43876. L. Crosby was supported by a joint postdoctoral traineeship from The United States Environmental Protection Agency and The University of North Carolina, Chapel Hill, Curriculum in Toxicology during part of the period of this work.
References
- 1.Pisetsky DS, Reich C. Influence of Backbone Chemistry on Immune Activation by Synthetic Oligonucleotides. Biochemical Pharmacology. 1999;58:1981–1988. doi: 10.1016/s0006-2952(99)00294-4. [DOI] [PubMed] [Google Scholar]
- 2.Sester DP, Naik S, Beasley SJ, Hume DA, Stacey KJ. Phosphorothioate backbone modification modulates macrophage activation by CpG DNA. Journal of Immunology. 2000;165:4165–4173. doi: 10.4049/jimmunol.165.8.4165. [DOI] [PubMed] [Google Scholar]
- 3.Heckelsmiller K, Rall K, Beck S, Schlamp A, Seiderer J, Jahrsdorfer B, Krug A, Rothenfusser S, Endres S, Hartmann G. Peritumoral CpG DNA Elicits a Coordinated Response of CD8 T Cells and Innate Effectors to Cure Established Tumors in a Murine Colon Carcinoma Model. Journal of Immunology. 2002;169:3892–3899. doi: 10.4049/jimmunol.169.7.3892. [DOI] [PubMed] [Google Scholar]
- 4.Kawarada Y, Ganss R, Garbi N, Sacher T, Arnold B, Hammerling GJ. NK- and CD8(+) T cell-mediated eradication of established tumors by peritumoral injection of CpG-containing oligodeoxynucleotides. Journal of Immunology. 2001;167:5247–53. doi: 10.4049/jimmunol.167.9.5247. [DOI] [PubMed] [Google Scholar]
- 5.Sagara I, Ellis RD, Dicko A, Niambele MB, Kamate B, Guindo O, Sissoko MS, Fay MP, Guindo MA, Kante O, Saye R, Miura K, Long C, Mullen GE, Pierce M, Martin LB, Rausch K, Dolo A, Diallo DA, Miller LH, Doumbo OK. A randomized and controlled Phase 1 study of the safety and immunogenicity of the AMA1-C1/Alhydrogel + CPG 7909 vaccine for Plasmodium falciparum malaria in semi-immune Malian adults. Vaccine. 2009;27:7292–8. doi: 10.1016/j.vaccine.2009.10.087. [DOI] [PMC free article] [PubMed] [Google Scholar]
- 6.Zhang H, Gong Q, Li JH, Kong XL, Tian L, Duan LH, Tong J, Song FF, Fang M, Zheng F, Xiong P, Tan Z, Gong FL. CpG ODN pretreatment attenuates concanavalin A-induced hepatitis in mice. Int Immunopharmacol. 2009 doi: 10.1016/j.intimp.2009.09.025. [DOI] [PubMed] [Google Scholar]
- 7.Cruz-Revilla C, Sonabend AM, Rosas G, Toledo A, Meneses G, Lopez-Casillas F, Hernandez B, Fragoso G, Sciutto E. Intrahepatic DNA vaccination: unexpected increased resistance against murine cysticercosis induced by non-specific enhanced immunity. Journal of Parasitology. 2006;92:655–7. doi: 10.1645/GE-665R1.1. [DOI] [PubMed] [Google Scholar]
- 8.Harandi AM, Holmgren J. CpG oligodeoxynucleotides and mobilization of innate mucosal immunity: tasks and tactics. Vaccine. 2006;24:S2-48–9. doi: 10.1016/j.vaccine.2005.01.118. [DOI] [PubMed] [Google Scholar]
- 9.Wilson HL, Dar A, Napper SK, Marianela Lopez A, Babiuk LA, Mutwiri GK. Immune mechanisms and therapeutic potential of CpG oligodeoxynucleotides. Int Rev Immunol. 2006;25:183–213. doi: 10.1080/08830180600785868. [DOI] [PubMed] [Google Scholar]
- 10.Harris TH, Mansfield JM, Paulnock DM. CpG ODN treatment enhances innate resistance and acquired immunity to African trypanosomes. Infection and Immunity Epub ahead of print. 2007 doi: 10.1128/IAI.01649-06. [DOI] [PMC free article] [PubMed] [Google Scholar]
- 11.Sagara I, Dicko A, Ellis RD, Fay MP, Diawara SI, Assadou MH, Sissoko MS, Kone M, Diallo AI, Saye R, Guindo MA, Kante O, Niambele MB, Miura K, Mullen GE, Pierce M, Martin LB, Dolo A, Diallo DA, Doumbo OK, Miller LH, Saul A. A randomized controlled phase 2 trial of the blood stage AMA1-C1/Alhydrogel malaria vaccine in children in Mali. Vaccine. 2009;27:3090–8. doi: 10.1016/j.vaccine.2009.03.014. [DOI] [PMC free article] [PubMed] [Google Scholar]
- 12.Traore B, Kone Y, Doumbo S, Doumtabe D, Traore A, Crompton PD, Mircetic M, Huang CY, Kayentao K, Dicko A, Sagara I, Ellis RD, Miura K, Guindo A, Miller LH, Doumbo OK, Pierce SK. The TLR9 agonist CpG fails to enhance the acquisition of Plasmodium falciparum-specific memory B cells in semi-immune adults in Mali. Vaccine. 2009 doi: 10.1016/j.vaccine.2009.08.023. [DOI] [PMC free article] [PubMed] [Google Scholar]
- 13.Overstreet MG, Freyberger H, Cockburn IA, Chen YC, Tse SW, Zavala F. CpG-enhanced CD8+ T cell responses to peptide immunization are severely inhibited by B cells. Eur J Immunol. 2009 doi: 10.1002/eji.200939493. [DOI] [PMC free article] [PubMed] [Google Scholar]
- 14.Chen WH, Basu S, Bhattacharjee AK, Cross AS. Enhanced antibody responses to a detoxified lipopolysaccharide-group B meningococcal outer membrane protein vaccine are due to synergistic engagement of Toll-like receptors. Innate Immun. 2009 doi: 10.1177/1753425909346973. [DOI] [PMC free article] [PubMed] [Google Scholar]
- 15.Hartmann G, Weiner GJ, Krieg AM. CpG DNA: a potent signal for growth, activation and maturation of human dendritic cells. Proceedings of the National Academy of Sciences USA. 1999;96:9305–9310. doi: 10.1073/pnas.96.16.9305. [DOI] [PMC free article] [PubMed] [Google Scholar]
- 16.Sparwasser T. Bacterial DNA and immunostimulatory CpG oligonucleotides trigger maturation and activation of murine dendritic cells. European Journal of Immunology. 1998;28:2045–2054. doi: 10.1002/(SICI)1521-4141(199806)28:06<2045::AID-IMMU2045>3.0.CO;2-8. [DOI] [PubMed] [Google Scholar]
- 17.Hemmi H, Takeuchi O, Kawal T, Kalsho T, Sato S, Sanjo H, Matsumoto M, Hoshino K, Wagner H, Takeda K, Akira S. A Toll-like receptor recognizes bacterial DNA. Nature. 2000;408 doi: 10.1038/35047123. [DOI] [PubMed] [Google Scholar]
- 18.Jakob T, Walker PS, Krieg AM, Udey MC, Vogel JC. Activation of cutaneous dendritic cells by CpG-containing oligodeoxynucleotides: a role for dendritic cells in the augmentation of Th1 responses by immunostimulatory DNA. Journal of Immunology. 1998;161:3042–3049. [PubMed] [Google Scholar]
- 19.Hacker H. Cell type-specific activation of mitogen-activated protein kinases by CpG-DNA controls interleukin-12 release from antigen presenting cells. EMBO J. 1999;18:6973–6982. doi: 10.1093/emboj/18.24.6973. [DOI] [PMC free article] [PubMed] [Google Scholar]
- 20.Abbas AK, Lichtman AH, Pober JS. Cellular and Molecular Immunology. W.B. Saunders Co; Philadelphia: 2000. [Google Scholar]
- 21.Gilroy DW, Colville-Nash PR, Willis D. Inducible cyclooxygenase may have anti-inflammatory properties. Nature Medicine. 1999;5:698–701. doi: 10.1038/9550. [DOI] [PubMed] [Google Scholar]
- 22.Ghosh DK, Misukonis MA, Reich C, Pisetsky DS, Weinberg JB. Host Response to Infection: the Role of CpG DNA in Induction of Cyclooxygenase 2 and Nitric Oxide Synthase 2 in Murine Macrophages. Infection and Immunity. 2001;69:7703–7710. doi: 10.1128/IAI.69.12.7703-7710.2001. [DOI] [PMC free article] [PubMed] [Google Scholar]
- 23.Poltorak A, He X, Smirnova I, Liu M, Huffel CV, Du X, Birdwell D, Alejos E, Silva M, Galanos C, Freudenberg M, Ricciardi-Castagnoli P, Layton B, Beutler B. Defective LPS signaling in C3H/HeJ and C57BL/10ScCr mice: mutations in Tlr4 gene. Science. 1998;282:2085–8. doi: 10.1126/science.282.5396.2085. [DOI] [PubMed] [Google Scholar]
- 24.Hoshino K, Takeuchi O, Kawai T, Sanjo H, Ogawa T, Takeda Y, Takeda K, Akira S. Cutting edge: Toll-like receptor 4 (TLR4)-deficient mice are hyporesonsive to lipopolysaccharide: evidence for TLR4 as the LPS gene product. J Immunol. 1999;162:3749–52. [PubMed] [Google Scholar]
- 25.Krishnan J, Selvarajoo K, Tsuchiya M, Lee G, Choi S. Toll-like receptor signal transduction. Exp Mol Med. 2007;39:421–38. doi: 10.1038/emm.2007.47. [DOI] [PubMed] [Google Scholar]
- 26.Wieland CW, Florquin S, van der Poll T. Toll-like receptor 9 is not important for host defense against Haemophilus influenzae. Immunobiology. 2009 doi: 10.1016/j.imbio.2009.10.004. [DOI] [PubMed] [Google Scholar]
- 27.Kawai T, Adachi O, Ogawa T, Takeda K, Akira S. Unresponsiveness of MyD88-deficient mice to endotoxin. Immunity. 1999;11:115–22. doi: 10.1016/s1074-7613(00)80086-2. [DOI] [PubMed] [Google Scholar]
- 28.Kawai T, Takeuchi O, Fujita T, Inoue J, Muhlradt P, Sato S, Hoshino K, Akira S. Lipopolysaccharide stimulates the MyD88-independent pathway and results n activation of IFN-regulatory factor 3 and the expression of a subset of lipopolysaccharide-inducible genes. J Immunol. 2001;167:5887–94. doi: 10.4049/jimmunol.167.10.5887. [DOI] [PubMed] [Google Scholar]
- 29.Akira S, Hoshino K, Kaisho T. The Role of Toll-like receptors and MyD88 in innate immune responses. Journal of Endotoxin Research. 2000;6:383–387. [PubMed] [Google Scholar]
- 30.Hacker H, Vabulas RM, Takeuchi O, Hoshino K, Akira S, Wagner H. Immune Cell Activation by Bacterial CpG-DNA through Myeloid Differentiation Marker 88 and Tumor Necrosis Factor Receptor-Associated Factor (TRAF)6. Journal of Experimental Medicine. 2000;192:595–600. doi: 10.1084/jem.192.4.595. [DOI] [PMC free article] [PubMed] [Google Scholar]
- 31.Ehrt S, Schnappinger D, Bekiranov S, Drenkow J, Shi S, Gergeras TR, Gaasterland T, Schoolnik G, Nathan C. Reprogramming of the Macrophage Transcriptome in Response to Interferon-γ and Mycobacterium tuberculosis: Signaling Roles of Nitric Oxide Synthase-2 and Phagocyte Oxidase. Journal of Experimental Medicine. 2001;194:1123–1139. doi: 10.1084/jem.194.8.1123. [DOI] [PMC free article] [PubMed] [Google Scholar]
- 32.Rodriguez JM, Elias F, Flo J, Lopez RA, Zorzopulos J, Montaner AD. Immunostimulatory PyNTTTTGT oligodeoxynucleotides: structural properties and refinement of the active motif. Oligonucleotides. 2006;16:275–85. doi: 10.1089/oli.2006.16.275. [DOI] [PubMed] [Google Scholar]
- 33.Merrill CL, Ni H, Yoon LW, Tirmenstein MA, Narayanan P, Benavides GR, Easton MJ, Creech DR, Hu CX, McFarland DC, Hahn LM, Thomas HC, Morgan KT. Etomoxir-Induced Oxidative Stress in HepG2 Cells Detected by Differential Gene Expression is Confirmed Biochemically. Toxicological Sciences. 2002;68:93–101. doi: 10.1093/toxsci/68.1.93. [DOI] [PubMed] [Google Scholar]
- 34.Kepler TB, Crosby LM, Morgan KT. Normalization and analysis of DNA microarray data by self-consistency and local regression. Genome Biology. 2002;3:research0037.1–0037.12. doi: 10.1186/gb-2002-3-7-research0037. [DOI] [PMC free article] [PubMed] [Google Scholar]
- 35.Kaushal D, Naeve CW. Analyzing and visualizing expression data with Spotfire. Curr Protoc Bioinformatics. 2004;Chapter 7(Unit 7):9. doi: 10.1002/0471250953.bi0709s7. [DOI] [PubMed] [Google Scholar]
- 36.Kaushal D, Naeve CW. Loading and preparing data for analysis in spotfire. Curr Protoc Bioinformatics Chapter 7. 2004;(Unit 7):8. doi: 10.1002/0471250953.bi0708s6. [DOI] [PubMed] [Google Scholar]
- 37.Kaushal D, Naeve CW. An overview of Spotfire for gene-expression studies. Curr Protoc Bioinformatics. 2004;Chapter 7(Unit 7):7. doi: 10.1002/0471250953.bi0707s6. [DOI] [PubMed] [Google Scholar]
- 38.Eisen MB, Spellman PT, Brown PO, Botstein D. Cluster analysis and display of genome-wide expression patterns. Proceedings of the National Academy of Sciences USA. 1998;95:14863–14868. doi: 10.1073/pnas.95.25.14863. [DOI] [PMC free article] [PubMed] [Google Scholar]
- 39.Dharmaraj S. RT-PCR: The Basics, Applied Biosystems. 2009 [Google Scholar]
- 40.Lenk GM, Tromp G, Weinsheimer S, Gatalica Z, Berguer R, Kuivaniemi H. Whole genome expression profiling reveals a significant role for immune function in human abdominal aortic aneurysms. BMC Genomics. 2007;8:237. doi: 10.1186/1471-2164-8-237. [DOI] [PMC free article] [PubMed] [Google Scholar]
- 41.Wang G, Zhao J, Liu J, Huang Y, Zhong JJ, Tang W. Enhancement of IL-2 and IFN-gamma expression and NK cells activity involved in the anti-tumor effect of ganoderic acid Me in vivo. Int Immunopharmacol. 2007;7:864–70. doi: 10.1016/j.intimp.2007.02.006. [DOI] [PubMed] [Google Scholar]
- 42.West J, Cogan J, Geraci M, Robinson L, Newman J, Phillips JA, Lane K, Meyrick B, Loyd J. Gene expression in BMPR2 mutation carriers with and without evidence of pulmonary arterial hypertension suggests pathways relevant to disease penetrance. BMC Med Genomics. 2008;1:45. doi: 10.1186/1755-8794-1-45. [DOI] [PMC free article] [PubMed] [Google Scholar]
- 43.Lahmers KK, Hedges JF, Jutila MA, Deng M, Abrahamsen MS, Brown WC. Comparative gene expression by WC1+ gammadelta and CD4+ alphabeta T lymphocytes, which respond to Anaplasma marginale, demonstrates higher expression of chemokines and other myeloid cell-associated genes by WC1+ gammadelta T cells. J Leukoc Biol. 2006;80:939–52. doi: 10.1189/jlb.0506353. [DOI] [PubMed] [Google Scholar]
- 44.Boonyaratanakornkit JB, Cogoli A, Li CF, Schopper T, Pippia P, Galleri G, Meloni MA, Hughes-Fulford M. Key gravity-sensitive signaling pathways drive T cell activation. Faseb J. 2005;19:2020–2. doi: 10.1096/fj.05-3778fje. [DOI] [PubMed] [Google Scholar]
- 45.Ramsborg CG, Windgassen D, Fallon JK, Paredes CJ, Papoutsakis ET. Molecular insights into the pleiotropic effects of plasma on ex vivo-expanded T cells using DNA-microarray analysis. Exp Hematol. 2004;32:970–90. doi: 10.1016/j.exphem.2004.07.012. [DOI] [PubMed] [Google Scholar]
- 46.Alberts B, Johnson A, Lewis J, Raff M, Roberts K, Walter P. Molecular Biology of the Cell. Taylor & Francis; New York, NY: 2002. [Google Scholar]
- 47.Toshchakov V, Jones BW, Perera PY, Thomas K, Cody MJ, Zhang S, Williams BRG, Major J, Hamilton TA, Fenton MJ, Vogel SN. TLR4, but not TLR2, mediates IFN-β–induced STAT1α/β-dependent gene expression in macrophages. Nature Immunology. 2002;3:392–398. doi: 10.1038/ni774. [DOI] [PubMed] [Google Scholar]
- 48.Bauer S, Kirschning CJ, Hacker H, Redecke V, Hausmann S, Akira S, Wagner H, Lipford GB. Human TLR9 confers responsiveness to bacterial DNA via species-specific CpG motif recognition. Proceedings of the National Academy of Sciences USA. 2001;98:9237–9242. doi: 10.1073/pnas.161293498. [DOI] [PMC free article] [PubMed] [Google Scholar]
- 49.Hornung V, Rothenfusser S, Britsch S, Krug A, Jahrsdorfer B, Giese T, Endres S, Hartmann G. Quantitative Expression of Toll-like Receptor 1–10 mRNA in Cellular Subsets of Human Peripheral Blood Mononuclear Cells and Sensitivity to CpG Oligodeoxynucleotides. Journal of Immunology. 2002;168:4531–4537. doi: 10.4049/jimmunol.168.9.4531. [DOI] [PubMed] [Google Scholar]
- 50.Kadowaki N, Ho S, Antonenko S, de Waal Malefyt R, Kastelein R, Bazan F, Liu Y. Subsets of Human Dendritic Cell Precursors Express Different Toll-like Receptors and Respond to Different Microbial Antigens. Journal of Experimental Medicine. 2001;194:863–869. doi: 10.1084/jem.194.6.863. [DOI] [PMC free article] [PubMed] [Google Scholar]
- 51.Krug A, Towarowski A, Britsch S, Rothenfusser S, Hornung V, Bals R, Giese T, Engelmann H, Endres S, Krieg AM, Hartmann G. Toll-like receptor expression reveals CpG DNA as a unique microbial stimulus for plasmacytoid dendritic cells which synergizes with CD40 ligand to induce high amounts of IL-12. European Journal of Immunology. 2001;31:3026–3037. doi: 10.1002/1521-4141(2001010)31:10<3026::aid-immu3026>3.0.co;2-h. [DOI] [PubMed] [Google Scholar]
- 52.Takeshita F, Leifer CA, Gursel I, Ishii KJ, Takeshita S, Gursel M, Klinman DM. Cutting Edge: Role of Toll-Like Receptor 9 in CpG DNA-Induced Activation of Human Cells. Journal of Immunology. 2001;167:3555–3558. doi: 10.4049/jimmunol.167.7.3555. [DOI] [PubMed] [Google Scholar]
- 53.Hacker H, Mischak H, Miethke T, Liptay S, Schmid R, Sparwasser T, Heeg K, Lipford GB, Wagner H. CpG DNA-specific activation of antigen-presenting cells requires stress kinase activity and is preceded by non-specific endocytosis and endosomal maturation. EMBO J. 1998;17:6230–6240. doi: 10.1093/emboj/17.21.6230. [DOI] [PMC free article] [PubMed] [Google Scholar]
- 54.Yi AK, Yoon JG, Yeo SJ, Hong SC, English BK, Krieg AM. Role of Mitogen-Activated Protein Kinases in CpG DNA-Mediated IL-10 and IL-12 production: Central Role of Extracellular Signal-Regulated Kinase in the Negative Feedback Loop of the CpG DNA-Mediated Th1 Response. Journal of Immunology. 2002;168:4711–4720. doi: 10.4049/jimmunol.168.9.4711. [DOI] [PubMed] [Google Scholar]
- 55.Dalpke AH, Opper S, Zimmermann S, Heeg K. Suppressors of Cytokine Signaling (SOCS)-1 and SOCS-3 Are Induced by CpG-DNA and Modulate Cytokine Responses in APCs. Journal of Immunology. 2001;166:7082–7089. doi: 10.4049/jimmunol.166.12.7082. [DOI] [PubMed] [Google Scholar]
- 56.Sweet MJ, Campbell CC, Sester DP, Xu D, McDonald RC, Stacey KJ, Hume DA, Liew FY. Colony-stimulating Factor-1 suppresses Responses to CpG DNA and Expression of Toll-Like Receptor 9 but Enhances Responses to Lipopolysaccharide in Murine Macrophages. Journal of Immunology. 2002;168:392–399. doi: 10.4049/jimmunol.168.1.392. [DOI] [PubMed] [Google Scholar]
- 57.Palazzo M, Gariboldi S, Zanobbio L, Dusio G, Slleri S, Bedoni M, Balsari A, Rumio C. Cross-talk among Toll-like receptors and their ligands. Int Immunol. 2008;20:709–18. doi: 10.1093/intimm/dxn027. [DOI] [PubMed] [Google Scholar]
- 58.Kindrachuk J, Potter J, Wilson H, Griebel P, Babiuk L, Napper S. Activation and regulation of toll-like receptor 9: CpGs and beyond. Mini Rev Med Chem. 2008;8:590–600. doi: 10.2174/138955708784534481. [DOI] [PubMed] [Google Scholar]
- 59.Sparwasser T, Hultner L, Koch ES, Luz A, Lipford GB, Wagner H. Immunostimulatory CpG-oligonucleotides cause extramedullary murine hemotopoiesis (sic) Journal of Immunology. 1999;162:2368–2374. [PubMed] [Google Scholar]
- 60.Keith JC., Jr . IL-11. In: Oppenheim JJ, Feldmann M, editors. Cytokine Reference. Academic Press; New York: 2001. pp. 565–584. [Google Scholar]
- 61.Hermann JA, Hall MA, Maini RN, Feldmann M, Brennan FM. Important immunoregulatory role of interleukin-11 in the inflammatory process in rheumatoid arthritis. Arthritis Rheum. 1998;41:1388–1397. doi: 10.1002/1529-0131(199808)41:8<1388::AID-ART7>3.0.CO;2-F. [DOI] [PubMed] [Google Scholar]
- 62.Mino T, Sugiyama E, Taki H, Kuroda A, Yamashita N, Maruyama M, Kobayashi M. Interleukin-1-alpha and tumor necrosis factor alpha synergistically stimulate prostaglandin E2-dependent production of interleukin-11 in rheumatoid synovial fibroblasts. Arthritis Rheum. 1998;41:2004–2013. doi: 10.1002/1529-0131(199811)41:11<2004::AID-ART16>3.0.CO;2-Z. [DOI] [PubMed] [Google Scholar]
- 63.Kim GS, Kim CH, Choi CS, Park JY, Lee KU. Involvement of different second messengers in parathyroid hormone- and interleukin-1-induced interleukin-6 and interleukin-11 production in human bone marrow stromal cells. J Bone Mineral Res. 1997;12:896–902. doi: 10.1359/jbmr.1997.12.6.896. [DOI] [PubMed] [Google Scholar]
- 64.Taki H, Sugiyama E, Mino T, Kuroda A, Kobayashi M. Differential inhibitory effects of indomethacin, dexamethasone, and interferon-gamma (IFN-gamma) on IL-11 production by rheumatoid synovial cells. Clin Exp Immunol. 1998;112:133–138. doi: 10.1046/j.1365-2249.1998.00552.x. [DOI] [PMC free article] [PubMed] [Google Scholar]
- 65.Goldman SJ. Preclinical biology of interleukin 11: a multifunctional hematopoietic cytokine with potent thrombopoietic activity. Stem Cells. 1995;13:462–471. doi: 10.1002/stem.5530130503. [DOI] [PubMed] [Google Scholar]
- 66.Leary AG, Zeng HQ, Clark SC, Ogawa M. Growth factor requirements for survival in G0 and entry into the cell cycle of primitive human hemopoietic progenitors. Proceedings of the National Academy of Sciences USA. 1992;89:4013–4017. doi: 10.1073/pnas.89.9.4013. [DOI] [PMC free article] [PubMed] [Google Scholar]
- 67.Trepicchio WL, Wang LL, Bozza M, Dorner AJ. IL-11 regulates macrophage effector function through the inhibition of nuclear factor-kappaB. Journal of Immunology. 1997;159:5661–5670. [PubMed] [Google Scholar]
- 68.Taipale J, Saharinen J, Keski-Oja J. Extracellular Matrix-Associated Transforming Growth Factor-β: Role in Cancer Cell Growth and Invasion. Advances in Cancer Research. 1998:87–134. doi: 10.1016/s0065-230x(08)60740-x. [DOI] [PubMed] [Google Scholar]
- 69.Wahl SM, Ashcroft G. Cytokines and Wound Healing. Cytokine bulletin (R & D Systems, Mpls MN) 2001 Winter;2001:1–7. [Google Scholar]
- 70.Calvo R, Drabkin HA. Embryonic Genes in Cancer. Annals of Oncology Suppl. 2000;3:207–218. doi: 10.1093/annonc/11.suppl_3.207. [DOI] [PubMed] [Google Scholar]
- 71.Mak TW, Simard JL. Cytokines of the Immune Response, Handbook of Immune Response Genes. Plenum Press; 1998. pp. 248–249. [Google Scholar]
- 72.Barish GD, Williams BO. The Wnt Signal Transduction Pathway. In: Gutkind JS, editor. Signaling Networks and Cell Cycle Control. Humana Press; Totowa, NJ: 2000. pp. 53–82. [Google Scholar]
- 73.Nusse R. In: Wnt Webpage. Nusse R, editor. 2002. [Google Scholar]


