Abstract
RNA polymerases are highly regulated molecular machines. We present a method (global run-on sequencing, GRO-seq) that maps the position, amount, and orientation of transcriptionally engaged RNA polymerases genome-wide. In this method, nuclear run-on RNA molecules are subjected to large-scale parallel sequencing and mapped to the genome. We show that peaks of promoter-proximal polymerase reside on ∼30% of human genes, transcription extends beyond pre-messenger RNA 3′ cleavage, and antisense transcription is prevalent. Additionally, most promoters have an engaged polymerase upstream and in an orientation opposite to the annotated gene. This divergent polymerase is associated with active genes but does not elongate effectively beyond the promoter. These results imply that the interplay between polymerases and regulators over broad promoter regions dictates the orientation and efficiency of productive transcription.
Transcription of coding and noncoding RNA molecules by eukaryotic RNA polymerases requires their collaboration with hundreds of transcription factors to direct and control polymerase recruitment, initiation, elongation, and termination. Whole-genome microarrays and ultra-high-throughput sequencing technologies enable efficient mapping of the distribution of transcription factors, nucleosomes, and their modifications, as well as accumulated RNA transcripts throughout genomes (1, 2), thereby providing a global correlation of factors and transcription states. Studies using the chromatin immunoprecipitation assay coupled to genomic DNA microarrays (ChIP-chip) or to high-throughput sequencing (ChIP-seq) indicate that RNA polymerase II (Pol II) is present at disproportionately higher amounts near the 5′ end of many eukaryotic genes relative to downstream regions (3–6). However, these techniques cannot determine whether Pol II is simply promoter-bound or engaged in transcription. Small-scale analyses using independent methods have shown that this distribution likely represents transcriptionally engaged Pol II that has accumulated between ∼20 and 50 bases downstream of transcription start sites (TSSs) (5, 6), indicating that transcription can be regulated at the stage of elongation as well as the recruitment and initiation stages (7). This promoter-proximal pausing or stalling (8) is proposed to be an important post-initiation, rate-limiting target for gene regulation (7, 9).
Here, we present a global run-on-sequencing (GRO-seq) assay to map and quantify transcriptionally engaged polymerase density genome-wide. These measurements provide a snapshot of genome-wide transcription and directly evaluate promoter-proximal pausing on all genes. We used nuclear run-on assays (NRO) to extend nascent RNAs that are associated with transcriptionally engaged polymerases under conditions where new initiation is prohibited. To specifically isolate NRO-RNA, we added a ribonucleotide analog [5-bromouridine 5′-triphosphate (BrUTP)] to BrU-tag nascent RNA during the run-on step (fig. S1). The length of the polynucleotide was kept short, and the NRO-RNA was chemically hydrolyzed into short fragments (∼100 bases) to facilitate high-resolution mapping of the polymerase origin at the time of assay (8). BrU-containing NRO-RNA was triple-selected through immunopurification with an antibody that is specific for this nucleotide analog, resulting in a 10,000-fold enrichment of the NRO-RNA pool that was determined to be >98% pure (8). A NRO-cDNA library was then prepared for sequencing from what represents the 5′ end of the fragmented, BrU-incorporated RNA molecule by using the Illumina high-throughput sequencing platform. The origin and the orientation of the RNAs and therefore the associated transcriptionally engaged polymerases were documented genome-wide by mapping the reads to the reference human genome (8).
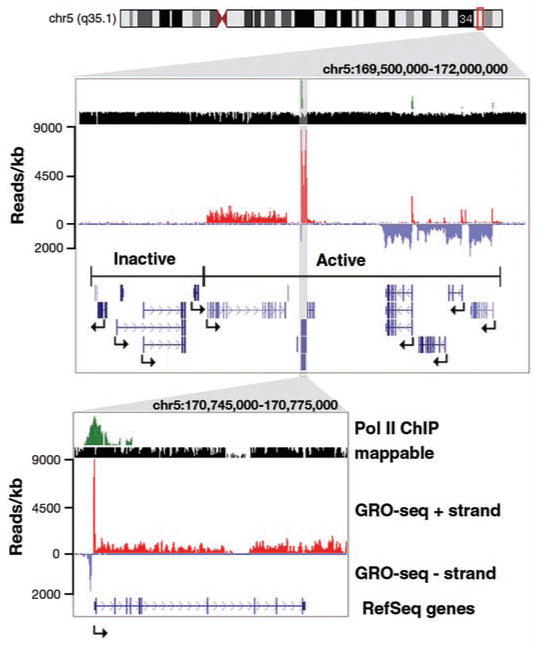
In total, ∼2.5 × 10⁷ 33–base pair (bp) reads were obtained from two independent replicates (8) prepared from primary human lung fibroblast (IMR90) nuclei, of which ∼1.1 × 10⁷ (44%) mapped uniquely to the human genome. Most reads (85.8%) align on the coding strand within boundaries of known RefSeq genes, human mRNAs, or expressed sequence tags (fig. S2). The number of transcriptionally active genes was determined by using an experimentally and computationally determined background of 0.04 reads per kilobase (8). We found 16,882 (68%) of RefSeq genes to be active (P < 0.01) compared with 8438 active genes found by a microarray experiment performed in the same cell line (3), reflecting, in part, the added sensitivity of sequencing platforms (10). Examination of several large regions shows that GRO-seq can differentiate between transcriptionally active and inactive regions in large chromosomal domains (Fig. 1). In addition, we are able to detect a generally low, but significant (P < 0.01 relative to background) amount of antisense transcription for 14,545 genes (58.7% of genes in the genome) (fig. S3).
Fig. 1.

Sample of GRO-seq data view on the University of California at Santa Cruz (UCSC) genome browser. A 2.5-Mb region on chromosome 5 showing GRO-seq reads aligned to the genome at 1-bp resolution, followed by an up-close view around the NPM1 gene. Pol II ChIP results (3) are shown in green; mappable regions, black; GRO-seq reads on the plus strand (left to right), red; GRO-seq reads on the minus strand (right to left), light blue; RefSeq gene annotations, dark blue.
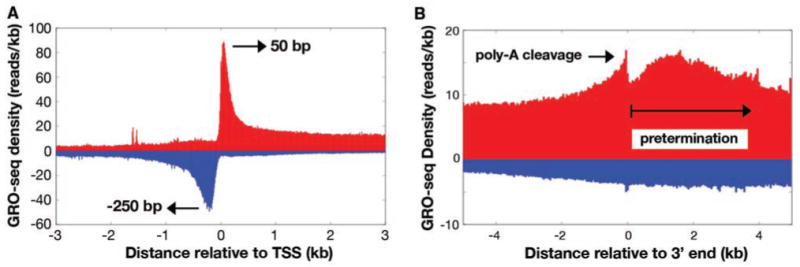
Aligning the GRO-seq data relative to RefSeq TSSs shows that the density of reads peaks near the TSS in both sense (∼50 bp) and antisense (∼−250 bp) directions (see below) (Fig. 2A). Alignment of GRO-seq reads to annotated 3′ ends of genes reveals a broad peak that is maximal at about +1.5 kb and can extend greater than 10 kb downstream of polyadenylation (poly-A) sites (Fig. 2B). This peak distance is consistent with previous and recent estimates (11, 12). A small peak followed by a sharp drop off is observed at the site of polyadenylation, likely representing the known 3′ cleavage before polyadenylation of the RNA (13).
Fig. 2.

Alignment of GRO-seq reads to TSSs and 3′ ends. (A) GRO-seq reads aligned to Ref-seq TSSs in 10-bp windows in both sense (red) and antisense (blue) directions relative to the direction of gene transcription. (B) GRO-seq reads flanking the 3′ ends of genes. The sharp peak coincides with the new 5′ end created after cleavage at the poly-A site. Polymerase density extends considerably downstream before termination.
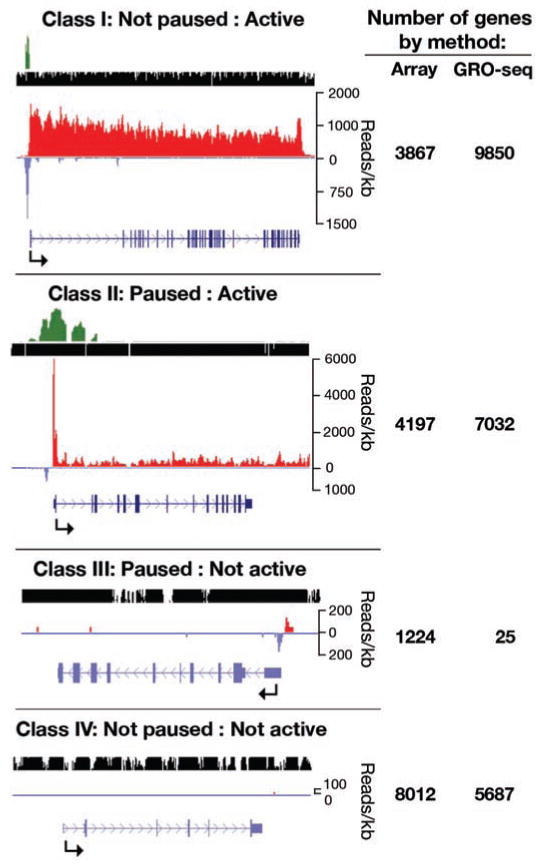
To identify all genes that show a peak of engaged Pol II that is characteristic of promoter-proximal pausing, we assessed whether each gene showed significant enrichment of read density in the promoter-proximal region relative to the density in the body of each gene (8). The ratio of these densities is called the pausing index (5, 6, 8), and significant pausing indices range from 2 to 103 (fig. S4). Within the defined promoter region, 7057 genes have a significant enrichment of GRO-seq reads relative to the body of the gene (P < 0.01), representing 28.3% of all genes (41.7% of active genes). Comparison of paused genes to either microarray expression or GRO-seq data revealed four classes of genes: class I, not paused and active; class II, paused and active; class III, paused and not active; and class IV, inactive (not paused and not active) (Fig. 3). Class III was severely depleted when we used GRO-seq to classify gene activity because GRO-seq provides a more sensitive measure of gene activity. Given the low signal at the promoters of the few genes left within this class, they are likely to be classified as active with deeper sequencing. Therefore, the overwhelming majority of genes with a paused polymerase also produce significant transcription throughout the gene, albeit often to quantities not detectable by expression microarrays. A recent comparison of Pol II ChIP-seq data to RNA-seq also supports the view that nearly all genes that are bound by Pol II produce full-length transcripts (10).
Fig. 3.

Comparison of pausing with gene activity. Four classes of genes are found when comparing genes with a paused polymerase and transcription activity either by microarray or GRO-seq density in the downstream portions of genes. An example of each class is shown, with tracks shown in the UCSC genome browser as in Fig. 1. The gene names, pausing index, and P value, from top to bottom, respectively, are as follows: TRIO, 1.1, 0.62; FUS, 41, 2.8 × 10−43; IZUMO1, 410, 7.6 × 10⁻³; and GALP (which has no reads and therefore no pausing index). The number of genes represented in each class is shown to the right.
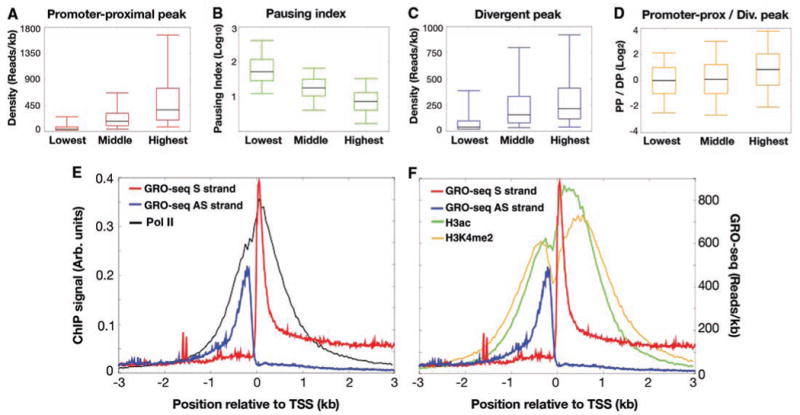
The density of polymerases within the promoter-proximal region generally correlates with the level of gene activity when all genes (Fig. 4A) or only genes with a paused polymerase are considered (fig. S5). Whereas nearly all paused genes show significant full-length activity by GRO-seq, the pausing index inversely correlates with gene activity (Fig. 4B). Considering that pausing is observed when Pol II enters a pause site faster than the rate of escape from pausing (9), this inverse correlation is consistent with the hypothesis that highly transcribed, but paused genes appear to be controlled, at least in part, by increasing the rate at which Pol II escapes the pause site and enters productive elongation (8).
Fig. 4.

Correlation of promoter-proximal transcription patterns with gene activity. (A to D) Box plots (each showing the fifth, 25th, 50th, 75th, and 95th percentiles) that show the relationship of promoter-proximal (PP) sense peaks (red), divergent peaks (DP) (blue), pausing indices (green), and PP/DP ratios (orange) to the top, middle, and bottom deciles of gene activity. All deciles are significantly different from each other: P <10−9 for all comparisons except between the lowest and the middle deciles in (D) (P < 10−3). (E) ChIP profiles of Pol II and GRO-seq sense (S) and antisense (AS) strand reads aligned to TSSs. (F) ChIP profiles of H3ac and H3K4me2 and GRO-seq aligned to TSSs.
A prominent and unexpected feature of the GRO-seq profiles around TSSs is the robust signal from an upstream, divergent, engaged polymerase. RNAs generated by these divergent polymerases can be identified at low concentrations when small RNAs are isolated from whole cells (14). These divergent polymerases cannot be accounted for by the 10% of known bidirectional promoters that are less than 1 kb apart (15) (fig. S6). We found that 13,633 genes (55% of all genes, 77% of active genes) display significant divergent transcription within 1 kb upstream of sense-oriented promoter-proximal peaks (P < 0.001), indicating that the number of bidirectional promoters exceeds even the highest estimates (16, 17). However, because it appears that the majority of these promoters produce mRNAs in only one direction (see below), we refer to this class of promoters as divergent. Although the top 10% of active genes have, on average, a slightly larger promoter-proximal than divergent peak (Fig. 3D), amounts of divergent transcription generally correlate with both the promoter-proximal signal (fig. S7) and the transcription level of the associated gene (Fig. 4C). Thus, divergent transcription is a mark for most active promoters.
Gene activity, pausing, and divergent transcription correlate with each other and with promoters containing a CpG island. These four characteristics co-occur significantly more often than would be expected by chance (P < 10−52) (table S1). Previous mapping of capped mRNA transcripts has shown that at CpG island promoters initiation occurs broadly over hundreds of base pairs (18), and GRO-seq shows that polymerases initiate and accumulate on this large class of promoters in both orientations.
Does existing ChIP-chip data (3) show any indication of the divergent peak of polymerase? Manual inspection of a number of genes and comparison with composite profiles aligned to TSSs show that the Pol II ChIP peak at promoters is accounted for by the two divergent peaks uncovered by GRO-seq (Figs. 1B and 4E). Higher-resolution ChIP-seq data in different cell lines has identified Pol II molecules upstream of promoters that were proposed to be in the same orientation of the annotated gene; however, these instead are likely to represent the divergent promoters identified by GRO-seq (10). Additionally, active promoters are typically marked by histone modifications such as di- and trimethylation of H3-Lys4 (H3K4me2 and H3K4me3) as well as acetylation of histone H3 and H4 (H3ac and H4ac). These modifications show a bimodal distribution around TSSs, with the trough representing a nucleosome-free region encompassing the TSS (3, 4, 19). Comparison of available H3ac and H3K4me2 data in this cell line (3) with GRO-seq suggests that both upstream and downstream peaks of these histone modifications are associated with active transcription, with each peak of histone modifications being adjacent and downstream of an engaged polymerase (Fig. 4F) (8). Other studies have shown that histone modifications associated with transcription elongation (e.g., H3K36me3 and H3K79me3) do not associate in a bimodal fashion around TSSs (4, 19). This and the lack of divergent GRO-seq reads further upstream (fig. S8) indicate that the majority of promoters experience initiation in the upstream direction but that these divergent polymerases do not productively elongate transcripts. Thus, promoters can distinguish polymerase in the forward versus the reverse direction.
We envision several possible functions for divergent transcription. First, the act of transcription itself could be crucial for granting access of transcription factors to control elements that reside upstream of core promoters, possibly by creating a barrier that prevents nucleosomes from obstructing transcription factor binding sites (20, 21). Second, as proposed by Seila et al. (14), negative supercoiling produced in the wake of transcribing polymerases could facilitate initiation in these regions. Third, these short nascent RNAs could themselves be functional, through either Argonaute-dependent (22) or -independent (23) pathways. Upcoming challenges will be to decipher whether the widespread transcriptional activity that lies upstream but divergent from the direction of coding genes positively or negatively regulates transcription output and how promoter or unknown DNA elements are designed to distinguish between productive elongation in one direction versus the other.
Supplementary Material
Acknowledgments
We gratefully thank C. Haudenschild for advice on construction of our libraries and for performing the initial alignments, Q. Sun and L. Ponnala for aligning the trimmed reads, A. Siepel for computational and statistical discussion, and the members of the Lis lab for suggestions regarding this work. The work was funded by NIH grant GM25232 to J.T.L. The data discussed in this publication have been deposited in National Center for Biotechnology Information's Gene Expression Omnibus under accession number GSE13518. The authors are filing a patent based on the work in this paper.
Footnotes
References and Notes
- 1.ENCODE Project Consortium et al. Nature. 2007;447:799. doi: 10.1038/nature05874. [DOI] [PMC free article] [PubMed] [Google Scholar]
- 2.Wold B, Myers RM. Nat Methods. 2008;5:19. doi: 10.1038/nmeth1157. [DOI] [PubMed] [Google Scholar]
- 3.Kim TH, et al. Nature. 2005;436:876. doi: 10.1038/nature03877. [DOI] [PMC free article] [PubMed] [Google Scholar]
- 4.Guenther MG, Levine SS, Boyer LA, Jaenisch R, Young RA. Cell. 2007;130:77. doi: 10.1016/j.cell.2007.05.042. [DOI] [PMC free article] [PubMed] [Google Scholar]
- 5.Muse GW, et al. Nat Genet. 2007;39:1507. doi: 10.1038/ng.2007.21. [DOI] [PMC free article] [PubMed] [Google Scholar]
- 6.Zeitlinger J, et al. Nat Genet. 2007;39:1512. doi: 10.1038/ng.2007.26. [DOI] [PMC free article] [PubMed] [Google Scholar]
- 7.Saunders A, Core LJ, Lis JT. Nat Rev Mol Cell Biol. 2006;7:557. doi: 10.1038/nrm1981. [DOI] [PubMed] [Google Scholar]
- 8.Materials and methods are available as supporting material on Science Online.
- 9.Core LJ, Lis JT. Science. 2008;319:1791. doi: 10.1126/science.1150843. [DOI] [PMC free article] [PubMed] [Google Scholar]
- 10.Sultan M, et al. Science. 2008;321:956. doi: 10.1126/science.1160342. published online 3 July 2008. [DOI] [PubMed] [Google Scholar]
- 11.Proudfoot NJ. Trends Biochem Sci. 1989;14:105. doi: 10.1016/0968-0004(89)90132-1. [DOI] [PubMed] [Google Scholar]
- 12.Lian Z, et al. Genome Res. 2008;18:1224. doi: 10.1101/gr.075804.107. [DOI] [PMC free article] [PubMed] [Google Scholar]
- 13.Proudfoot N. Curr Opin Cell Biol. 2004;16:272. doi: 10.1016/j.ceb.2004.03.007. [DOI] [PubMed] [Google Scholar]
- 14.Seila AC, et al. Science. 2008;322:1849. doi: 10.1126/science.1162253. published online 4 December 2008. [DOI] [PMC free article] [PubMed] [Google Scholar]
- 15.Trinklein ND, et al. Genome Res. 2004;14:62. doi: 10.1101/gr.1982804. [DOI] [PMC free article] [PubMed] [Google Scholar]
- 16.Kapranov P, et al. Science. 2007;316:1484. doi: 10.1126/science.1138341. published online 16 May 2007. [DOI] [PubMed] [Google Scholar]
- 17.Rada-Iglesias A, et al. Genome Res. 2008;18:380. doi: 10.1101/gr.6880908. [DOI] [PMC free article] [PubMed] [Google Scholar]
- 18.Carninci P, et al. Nat Genet. 2006;38:626. doi: 10.1038/ng1789. [DOI] [PubMed] [Google Scholar]
- 19.Barski A, et al. Cell. 2007;129:823. doi: 10.1016/j.cell.2007.05.009. [DOI] [PubMed] [Google Scholar]
- 20.Mavrich TN, et al. Nature. 2008;453:358. doi: 10.1038/nature06929. [DOI] [PMC free article] [PubMed] [Google Scholar]
- 21.Gilchrist DA, et al. Genes Dev. 2008;22:1921. doi: 10.1101/gad.1643208. [DOI] [PMC free article] [PubMed] [Google Scholar]
- 22.Han J, Kim D, Morris KV. Proc Natl Acad Sci USA. 2007;104:12422. doi: 10.1073/pnas.0701635104. [DOI] [PMC free article] [PubMed] [Google Scholar]
- 23.Wang X, et al. Nature. 2008;454:126. doi: 10.1038/nature06992. [DOI] [PMC free article] [PubMed] [Google Scholar]
Associated Data
This section collects any data citations, data availability statements, or supplementary materials included in this article.


