

Abstract
Background
The cellular immune response in gastric mucosa infected with Helicobacter pylori is proposed to be predominantly of the T helper cell type 1 type.
Methods
Interleukin (IL)–18, IL-12, and interferon (IFN)–γ levels were measured in gastric mucosal biopsy specimens by reverse-transcription polymerase chain reaction (PCR) and by enzyme-linked immunosorbent assay; IL18 polymorphisms were determined by PCR.
Results
Biopsy specimens from 128 patients (56 with nonulcer dyspepsia, 28 with gastric ulcers, 28 with duodenal ulcers, and 16 with gastric cancer) were examined; 96 patients had H. pylori infection. IL-18 levels were markedly up-regulated in mucosa infected with H. pylori (P < .001), whereas IL-12 and IFN-γ levels were independent of H. pylori status. IL-18 levels correlated with IFN-γ levels only in infected patients (R = 0.31 to R = 0.51). IL-18 levels were the determining factor for monocyte infiltration in H. pylori–infected mucosa (P < .001). H. pylori–infected patients displaying IL18 –607C/C and –137G/G had higher IL-18 levels than did those with other genotypes and were more likely to experience treatment failure.
Conclusion
H. pylori infection induces IL-18 in the gastric mucosa. H. pylori–infected patients with IL18 –607C/C and –137G/G have higher IL-18 levels, which causes severe gastric inflammation. IL18 genotype might be a marker for predicting the effects of eradication therapy.
Helicobacter pylori infection of the gastric mucosa is characterized by a marked infiltration of inflammatory cells whose migration and activation are believed to depend on the H. pylori–induced production of proinflammatory cytokines (reviewed in [1]). The immune response to H. pylori infection is thought to be predominantly of the Th1 type and is associated with a significant increase in interferon (IFN)–γ–secreting T cells. The proinflammatory cytokine interleukin (IL)–18, previously known as an IFN-γ–inducing factor, is a Th1 cytokine in the IL-1 superfamily [2, 3]. IL-18, in synergy with IL-12, promotes the production of IFN-γ from Th1 and NK cells [4–6]. Because the Th1 response is believed to be predominant in H. pylori–infected gastric mucosa, we hypothesized that IL-18 should play a role in the process. However, the effect of H. pylori infection on IL-18 production remains unclear, because one report suggested that antral, but not corporal, IL-18 mRNA levels were up-regulated during H. pylori infection [7] and another indicated that mucosal IL-18 mRNA levels were independent of H. pylori infection [8]. In addition, no previous studies have investigated the relationship between the induction of gastric mucosal IL-18 and that of IL-12 and IFN-γ.
It is generally recognized that polymorphisms in genes that regulate inflammation may be associated with different clinical outcomes in diseases for which inflammation is a critical variable [9, 10]. Two single-nucleotide polymorphisms (SNPs) in the promoter region of the IL18 gene (at positions –607 and –137) have been linked to type I diabetes [11], rheumatoid arthritis [12], and the progression of ovarian cancer [13]. No relationship was found between IL18 polymorphisms and gastric intestinal metaplasia in a Chinese population [14]; however, the relationship between IL18 polymorphisms and gastric mucosal IL-18 levels has not been studied.
In the present study, we investigated the relationship between H. pylori infection and IL-18 induction in H. pylori–infected and H. pylori–uninfected gastric mucosa as well as whether the induction of mucosal IL-18 was associated with that of IL-12 and INF-γ. We further investigated whether IL18 polymorphisms play a role in mucosal IL-18 induction.
METHODS
Patients
Patients presented to Kyoto Prefectural University Hospital, Kyoto, Japan, for investigation of dyspeptic symptoms. The study population consisted of patients with nonulcer dyspepsia (NUD), gastric ulcers (GUs), duodenal ulcers (DUs), or gastric cancer (GC). H. pylori status was assessed by a combination of culture, histology, and serology. Patients were regarded as being H. pylori positive if 1 or more of the tests yielded positive results. Reasons for patient exclusions included upper gastrointestinal bleeding and bleeding diathesis. No patients received nonsteroidal anti-inflammatory drugs or steroids at least 3 months before endoscopy. No subject had received treatment for H. pylori infection. Informed consent was obtained from all patients under a protocol approved by the hospital’s ethics committee.
Four biopsy specimens were taken from the antrum and the corpus. Two specimens from each area were used for histological examination; 1 for H. pylori culture, cytokine protein measurement, and IL18 polymorphisms analysis; and 1 for cytokine mRNA measurement. Biopsy specimens were taken at least 2 cm from ulcers or tumors in the cases of GUs and GC. One biopsy specimen was also taken from the GC tissues of the patients with GC. To avoid cross-contamination, biopsy forceps were changed between collection of the biopsy specimens from different regions, and the biopsy channel was flushed several times with water before sampling.
Some of the H. pylori–positive patients received H. pylori eradication therapy for 10 days (30 mg of lansoprazole or 20 mg of omeprazole twice daily, 1000 mg of amoxicillin twice daily, and 400 mg of clarithromycin twice daily). Four weeks after cessation of treatment, the patients were reexamined endoscopically, and biopsy specimens were taken as before. Furthermore, the 13C-urea breath test was performed. Successful cure of H. pylori infection was defined as all of the test results being negative.
Histology and H. pylori culture
The biopsy specimens were fixed in 10% buffered formalin, embedded in paraffin, cut in sequential 4-μm sections, and stained with hematoxylineosin and modified Giemsa stains. The histological severity of gastritis was graded in a blinded fashion on the basis of the degree of mononuclear cell (MNC) infiltration, polymorphonuclear leukocyte (PMN) infiltration, H. pylori density, and atrophy, in accordance with the updated Sydney System [15]. Intestinal metaplasia (IM) was scored as present or absent.
H. pylori culture and the presence of the cag pathogenicity island (PAI) and vacA genotypes were evaluated by polymerase chain reaction (PCR), as described elsewhere [16, 17].
Cytokine levels in biopsy specimens
Mucosal cytokine levels were measured by ELISA and reverse-transcription PCR (RT-PCR). The mucosal levels of cytokines were expressed as pg/mg of biopsy protein, and mRNA levels were scored from 0 to 3. Intra-assay variations were ~2% in ELISA and 3% in RT-PCR, irrespective of the cytokines measured. A detailed description of the methodology is provided in appendix A, which appears only in the electronic edition of the Journal.
IL18 promoter polymorphisms
Genomic DNA was extracted from gastric biopsy specimens by means of a commercial DNA extraction kit (QiAmp Tissue Kit; Qiagen). The SNPs at positions –607 (C/A) and –137 (G/C) in the promoter region of IL18 were analyzed by a sequence-specific PCR method, as described elsewhere [18].
Data analysis
Statistical analysis was performed by the Kruskal-Wallis test along with the Scheffe multiple comparison test, the Mann-Whitney rank-sum test, the Wilcoxon signed-rank test, the paired t test, the χ2 test, or Spearman’s rank test, depending on the data set of concern. Tests for Hardy-Weinberg equilibrium were performed by the χ2 test. To determine which factors influenced the degree of inflammation in relation to cytokine levels, multiple linear regression analyses were performed using sex, age, H. pylori density, and cytokine levels as explanatory variables. To determine which factors influenced the mucosal cytokine levels in relation to IL18 genotype, multiple linear regression analyses were performed using sex, age, H. pylori density at the same topographical site, clinical outcomes, and the genotype of the IL18 –607 and IL18 –137 loci as explanatory variables. Variables were selected by backward stepwise deletion in the logistic regression and by the F-out and F-in stepwise method in the linear regression, where F values were 2.0. Multiple logistic regression analyses were performed for evaluating the risk of disease in relation to IL18 genotype, adjusted for age and sex. The analyses were done using the statistical software HALBAU (Gendai-sugaku-sha). Data are presented as median (25th to 75th percentile). P < .05 was accepted to indicate statistical significance.
RESULTS
H. pylori infection and clinical outcome
Sixty patients with NUD, 30 with DUs or GUs, and 20 with GC were consecutively recruited. After patients who met the exclusion criteria were removed, specimens from 128 patients (76 men and 52 women; age range, 21–86 years; mean age, 52.4 years) were included in this study. Clinical presentations were as follows: 56 patients had NUD, 28 had GUs, 28 had DUs, and 16 had GC (all were well-differentiated distal-type adenocarcinomas; 14 were early stage). PCR showed that all cultured H. pylori possessed an intact cag PAI and had the vacA s1-m1 genotype. Fifty percent of the patients with NUD were H. pylori negative, and all of them had normal histological findings (i.e., no PMN infiltration, no presence of IM, and no or very mild MNC infiltration). This NUD group made up the primary comparison group of H. pylori infected and uninfected patients, to exclude the possible bias that could result from the use of different clinical outcomes. Only 2 patients with GUs and 2 with DUs were H. pylori negative and were excluded in the subsequent analyses. Detailed characteristics of the patients are shown in table 1.
Cytokine levels in gastric mucosa
Mucosal IL-18 protein levels were markedly increased in H. pylori–positive patients with NUD, compared with those in H. pylori–negative patients with NUD, both in the antrum and in the corpus (P < .001 for each) (figure 1). In contrast, although mucosal IL-12p70 and IFN-γ levels were higher in H. pylori–positive patients, the difference was not significant (P = .09 to P = .26). Mucosal mRNA levels showed results similar to those for the protein levels (table 2) and correlated well with protein levels irrespective of H. pylori status (e.g., for IL-18 in the antrum, R = 0.76 and P < .001 for H. pylori–positive patients and R = 0.58 and P < .001 for H. pylori–negative patients; for IL-18 in the corpus, R = 0.88 and P < .001 for H. pylori–positive patients and R = 0.70 and P < .001 for H. pylori–negative patients). The IL-12p40 subunit is a component of both IL-12 and IL-23 [19], and IL-12p70 protein levels correlated with IL-12p40 mRNA levels both in the antrum and in the corpus (R = 0.62 to R = 0.82) (P < .001 for each).
Figure 1.
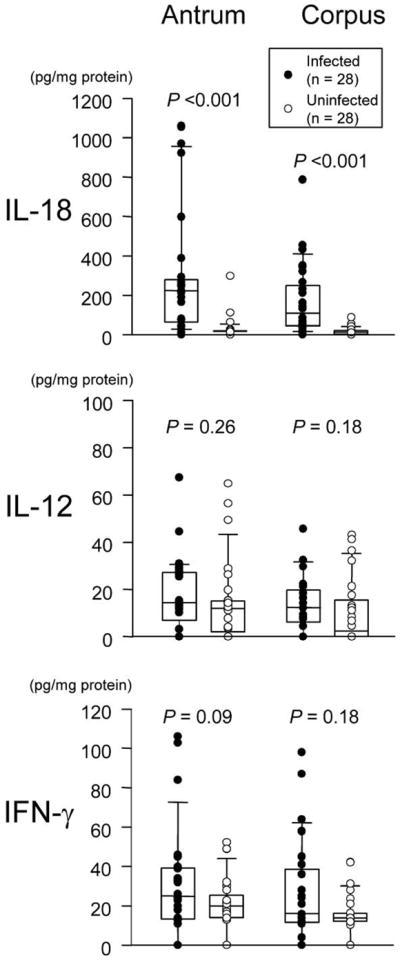
Mucosal cytokine levels in the antrum and the corpus in relation to Helicobacter pylori infection. Each box shows the median (horizontal bar) and the 25th to the 75th percentile. Capped bars indicate the 10th and 90th percentiles. Data are also displayed using symbols. P values for comparisons between H. pylori–positive and H. pylori–negative patients were calculated by the Mann-Whitney rank-sum test. IFN, interferon; IL, interleukin.
IL-18 protein and mRNA levels significantly correlated with IFN-γ protein and mRNA levels both in the antrum and in the corpus, solely in H. pylori–positive patients (table 3). In contrast, IL-12 protein and mRNA levels strongly correlated with IFN-γ protein and mRNA levels irrespective of H. pylori status (table 3).
Cytokine levels and gastric inflammation in H. pylori–infected patients
The effects of cytokines on gastric inflammation were evaluated among H. pylori–positive patients with NUD. Univariate analysis showed that IL-18 protein and mRNA levels strongly correlated with MNC infiltration both in the antrum and in the corpus (P < .001 for trend) (table 4). In contrast, IL-12 and IFN-γ levels were independent of MNC scores. Backward stepwise multiple linear regression analysis confirmed that only IL-18 protein and mRNA levels were independent determining factors for MNC infiltration (table 5).
Table 4.
Cytokine levels and cellular infiltrations in Helicobacter pylori–infected patients with non-ulcer dyspepsia.
| Protein level, pg/mg of biopsy protein |
mRNA level, 0–3 |
|||||
|---|---|---|---|---|---|---|
| Histology score | IL-18 | IL-12p70 | IFN-γ | IL-18 | IL-12p40 | IFN-γ |
| MNC infiltration | ||||||
| Antrum | ||||||
| 1 (n = 11) | 47 (28–180) | 15 (2.9–26) | 28 (12–31) | 1 (0–1.8) | 1 (0–2) | 2 (1–2) |
| 2 (n = 8) | 254 (235–269) | 13 (7.9–15) | 29 (17–39) | 2 (1.5–2) | 1 (0–1) | 2 (0–2) |
| 3 (n = 9) | 598 (217–991) | 28 (7.7–34) | 39 (21–89) | 3 (1.8–3) | 2 (0.8–3) | 2 (0–3) |
| P | <.001 | NS | .094 | <.001 | NS | NS |
| Corpus | ||||||
| 1 (n = 10) | 45 (21–54) | 12 (8.4–18) | 13 (11–16) | 1 (0–2) | 2 (1–2) | 1 (1–1) |
| 2 (n = 12) | 165 (87–394) | 10 (0–26) | 20 (8.0–52) | 3 (2–3) | 1.5 (0.5–2) | 1.5 (0–2) |
| 3 (n = 6) | 224 (145–323) | 16 (12–17) | 33 (21–45) | 3 (3–3) | 1.5 (0–3) | 1.5 (1–2) |
| P | <.001 | NS | NS | <.001 | NS | NS |
| PMN infiltration | ||||||
| Antrum | ||||||
| 0 (n = 7) | 48 (33–220) | 13 (2.9–24) | 13 (2.8–32) | 1 (0–1) | 0 (0–1.8) | 1 (0.3–2) |
| 1 (n = 11) | 248 (99–285) | 14 (5.0–26) | 26 (13–39) | 2 (2–2) | 1 (1–2) | 2 (0.3–2.8) |
| 2 (n = 4) | 175 (62–663) | 15 (14–23) | 26 (19–39) | 1.5 (1–2.5) | 0.5 (1–1.5) | 1.5 (1–2.5) |
| 3 (n = 6) | 596 (225–970) | 22 (0–45) | 59 (24–103) | 2.5 (1–3) | 2 (0–3) | 1.5 (0–3) |
| P | .064 | NS | NS | NS | NS | NS |
| Corpus | ||||||
| 0 (n = 6) | 29 (0–54) | 13 (0–21) | 13 (0–16) | 1 (0–1) | 1.5 (1–2) | 1 (0–1) |
| 1 (n = 13) | 145 (52–242) | 9.3 (3.5–15) | 21 (12–28) | 2 (2–3) | 2 (0.8–2) | 1 (0–1.3) |
| 2 (n = 5) | 134 (38–357) | 12 (9.2–17) | 12 (3.0–23) | 2 (1.5–3) | 1 (0–1.3) | 1 (0.8–2) |
| 3 (n = 4) | 394 (244–445) | 39 (27–46) | 76 (61–93) | 3 (3–3) | 3 (2.5–3) | 3 (2.5–3) |
| P | .009 | .023 | .009 | .009 | .037 | .017 |
NOTE. P values were calculated by the Kruskal-Wallis test. IFN, interferon; IL, interleukin; MNC, mononuclear cell; NS, not significant (P > .10); PMN, polymorphonuclear leukocyte.
Table 5.
Multiple regression analysis for inflammation in relation to cytokine levels in Helicobacter pylori–positive patients with nonulcer dyspepsia.
| Antrum |
Corpus |
||||
|---|---|---|---|---|---|
| Histology | Explanatory variable | PRC ± SE | P | PRC ± SE | P |
| MNC | IL-18 protein level | 0.0026 ± 0.0005 | <.001 | 0.0011 ± 0.0007 | .004 |
| IL-18 mRNA level | 0.54 ± 0.13 | <.001 | 0.51 ± 0.08 | <.001 | |
| PMN | IL-18 protein level | 0.0004 ± 0.0002 | .092 | 0.0009 ± 0.0005 | .006 |
| IL-18 mRNA level | 0.37 ± 0.16 | .041 | 0.59 ± 0.18 | .009 | |
| IFN-γ mRNA level | … | … | 0.34 ± 0.19 | .056 | |
NOTE. Final models are presented. Adjusted for age, sex, and H. pylori density at the same topographical site. The partial regression coefficient (PRC) provides an estimate of the expected results of the mononuclear cell (MNC) scores. For example, in the antrum, MNC scores would be expected to increase 0.54 if interleukin (IL)–18 mRNA scores increase by 1. IFN, interferon; PMN, polymorphonuclear leukocyte.
Univariate analysis showed that the protein and mRNA levels of all 3 cytokines correlated with PMN infiltration in the corpus but were independent of PMN infiltration in the antrum (table 4). Multiple linear regression analysis showed that IL-18 protein and mRNA levels were independent determining factors for PMN infiltration in the corpus (table 5). Interestingly, only IL-18 protein and mRNA levels also remained in the final model for the antrum. IFN-γ mRNA levels also remained in the final model for the corpus (P = .042), although the effects were less than those of IL-18 mRNA levels (P = .009) (table 5). None of the cytokines studied was an independent determining factor for atrophy and IM (data not shown).
Cytokine levels in relation to clinical outcome in H. pylori–infected patients
We compared cytokine levels between different clinical outcomes in H. pylori–infected patients (table 6). The mucosal biopsy specimens were taken from normal-appearing mucosa at least 2 cm from ulcers or tumors. IL-18 and IFN-γ levels (both protein and mRNA) were similar irrespective of clinical outcome. In contrast, IL-12 levels were slightly higher in patients with DUs than in patients with NUD or GUs. Because the number studied was small, the biological importance of these findings will require additional studies with larger numbers to clarify the possible role played by IL-12 in patients with DUs.
Table 6.
Cytokine levels by clinical outcome.
| Cytokine | NUD (n = 28) | GUs (n = 26) | DUs (n = 26) | GC (n = 16) |
|---|---|---|---|---|
| Protein levels, pg/mg of biopsy protein | ||||
| IL-18 | ||||
| Antrum | 223 (62–282) | 203 (31–312) | 213 (35–288) | 94 (38–276) |
| Corpus | 111 (45–251) | 100 (26–235) | 83 (37–333) | 77 (28–213) |
| IL-12p70 | ||||
| Antrum | 14 (6.7–27.1) | 12 (8.4–26) | 18 (14–52)a | 15 (10–32) |
| Corpus | 12 (6.1–20.0) | 14 (11–19) | 19 (11–38)b | 14 (12–20) |
| IFN-γ | ||||
| Antrum | 25 (13–39) | 24 (12–34) | 32 (16–62) | 30 (17–44) |
| Corpus | 16 (12–39) | 14 (13–24) | 27 (12–55) | 22 (18–27) |
| mRNA levels, 0–3 | ||||
| IL-18 | ||||
| Antrum | 2 (1–2.5) | 2.5 (0–3) | 1.5 (0–3) | 1.5 (0.5–2.5) |
| Corpus | 2 (1–3) | 2 (0–3) | 2 (1–3) | 1 (1–2.5) |
| IL-12p40 | ||||
| Antrum | 1 (0–2) | 1 (0–2) | 1 (0–3) | 1 (0.5–2) |
| Corpus | 1 (1–2) | 1 (1–2) | 2 (1–3)c | 1.5 (0.5–2.5) |
| IFN-γ | ||||
| Antrum | 2 (0–2.5) | 1 (0–2) | 2 (1–3) | 1.5 (0–2.5) |
| Corpus | 1 (0.5–2) | 1 (0–2) | 1 (0–3) | 1 (0.5–2) |
NOTE. P values for correlation between cytokine levels were calculated by Spearman’s rank test. P values are presented only if they indicate statistical significance. DUs, duodenal ulcers; GC, gastric cancer; GUs, gastric ulcers; IFN, interferon; IL, interleukin; NUD, nonulcer dyspepsia.
P = .027, compared with GUs; P = .058, compared with NUD.
P = .036, compared with NUD; P = .098, compared with GUs.
P = .044, compared with NUD; P = .033, compared with GUs.
We also collected biopsy specimens from GC tissues. Mucosal IL-18 levels were much higher in GC tissues than in adjacent noncancerous tissues (antrum or corpus, depending on the location of the cancer) (841 [632–1401] vs. 120 [68–271] pg/mg of biopsy protein; P < .001). Mucosal IL-12 levels were slightly but significantly higher in GC tissue than in adjacent noncancerous tissue (32 [22–49] vs. 15 [10–28]; P = .022). In contrast, mucosal IFN-γ levels were similar in the cancerous and adjacent noncancerous tissues (26 [16–42] vs. 22 [17–46]). Interestingly, mucosal IL-12 levels correlated with IFN-γ levels even in GC tissue (R = 0.79; P < .001), whereas no correlation was observed in other combinations (data not shown).
IL18 polymorphisms and mucosal IL-18 levels
The above data confirmed that H. pylori induced gastric mucosal IL-18 and suggested that the induced IL-18 might be one of the triggers of gastric inflammation. It has been suggested that specific IL18 genotypes (C/C at position –607 and G/G at position at –137) have the potential to induce higher IL-18 production in response to external stimulation than do other genotypes in vitro [18]. This hypothesis has not been tested in vivo. We therefore examined the effects of IL18 polymorphisms in relation to H. pylori–induced IL-18 levels. Genotype frequencies were in agreement with Hardy-Weinberg equilibrium (P > .1 for all analyses).
Univariate analysis showed that IL-18 protein levels in H. pylori–infected mucosa differed among the genotypes in the IL18 –607 SNP (e.g., median of 265 pg/mg of biopsy protein for C/C, 192 for C/A, and 51 for A/A in the antrum; P < .01) (figure 2). Mucosal IL-18 protein levels in H. pylori–infected mucosa were also significantly different among the genotypes in the IL18 –137 SNP (e.g., median of 241 pg/mg of biopsy protein for G/G, 34 for G/C, and 29 for C/C in the antrum; P < .01) (figure 2). Overall, these data suggest that the IL18 –607C/C and IL18 –137G/G genotypes are important in determining IL-18 induction. Accordingly, carriers of haplotype I (–137G/–607C) had significantly higher IL-18 levels than did those with other haplotypes (data not shown). IL-18 mRNA levels in H. pylori–infected mucosa showed similar results (table 7). Multiple linear regression analyses confirmed that the genotypes of the IL18 –607 and IL18 –137 loci were determining factors for IL-18 levels in H. pylori–positive patients (table 8). In H. pylori–negative patients with NUD, there was no relationship between IL18 polymorphisms and IL-18 protein or mRNA level (data not shown).
Figure 2.

Mucosal interleukin (IL)–18 levels in the antrum and the corpus in relation to the genotypes at IL18 –607 and –137. Each box shows the median (horizontal bar) and the 25th to the 75th percentile. Capped bars indicate the 10th and 90th percentiles. Data are also displayed using symbols. P values for comparisons between groups were calculated by the Kruskal-Wallis test along with the Scheffe multiple-comparison test.
As shown in table 9, IL18 genotypes were unrelated to clinical outcomes of the H. pylori infection. There was also no relationship between IL-18 phenotype or haplotype and clinical outcome (data not shown).
Table 9.
Genotype frequency by clinical outcome.
| Locus |
||||||
|---|---|---|---|---|---|---|
|
IL18 –607 |
IL18 –137 |
|||||
| Disease presentation | C/C | C/A | A/A | G/G | G/C | C/C |
| All patientsa (n = 128) | 21 (16) | 80 (63) | 27 (21) | 98 (77) | 27 (21) | 3 (2) |
| NUD (n = 56) | 8 (14) | 34 (61) | 14 (25) | 40 (71) | 13 (23) | 3 (5) |
| GUs (n = 28) | 5 (18) | 18 (64) | 5 (18) | 22 (79) | 6 (21) | 0 |
| DUs (n = 28) | 5 (18) | 18 (64) | 5 (18) | 22 (79) | 6 (21) | 0 |
| GC (n = 16) | 3 (19) | 10 (63) | 3 (19) | 14 (88) | 2 (13) | 0 |
| Odds ratiob (95% CI) | ||||||
| NUD vs. GUs | 1.0 | 0.8 (0.2–3.2) | 0.5 (0.1–2.5) | 1.0 | 1.1 (0.3–3.7) | – |
| NUD vs. DUs | 1.0 | 0.8 (0.2–2.7) | 0.5 (0.1–2.2) | 1.0 | 0.7 (0.2–2.3) | – |
| NUD vs. GC | 1.0 | 1.0 (0.2–5.5) | 0.7 (0.1–5.5) | 1.0 | 1.1 (0.2–7.3) | – |
| H. pylori positive (n = 96) | 19 (20) | 55 (57) | 22 (23) | 77 (80) | 16 (17) | 3 (3) |
| NUD (n = 28) | 6 (21) | 13 (46) | 9 (32) | 23 (82) | 2 (7) | 3 (11) |
| GUs (n = 26) | 5 (19) | 16 (62) | 5 (19) | 20 (77) | 6 (23) | 0 |
| DUs (n = 26) | 5 (19) | 16 (62) | 5 (19) | 20 (77) | 6 (23) | 0 |
| GC (n = 16) | 3 (19) | 10 (63) | 3 (19) | 14 (88) | 2 (13) | 0 |
| Odds ratiob (95% CI) | ||||||
| NUD vs. GUs | 1.0 | 0.9 (0.2–4.7) | 0.4 (0.1–2.5) | 1.0 | 5.2 (0.7–38.2) | – |
| NUD vs. DUs | 1.0 | 1.3 (0.3–5.7) | 0.5 (0.1–2.8) | 1.0 | 3.0 (0.5–17.0) | – |
| NUD vs. GC | 1.0 | 1.8 (0.3–11.2) | 0.6 (0.1–4.7) | 1.0 | 3.5 (0.2–50.7) | – |
NOTE. Data are no. (%) of patients, unless otherwise indicated. – could not calculate; CI, confidence interval; DUs, duodenal ulcers; GC, gastric cancer; GUs, gastric ulcers; NUD, nonulcer dyspepsia.
Helicobacter pylori–positive and H. pylori–negative patients.
Adjusted for sex and age.
Effects of eradication therapy on mucosal cytokine levels
Thirty-five patients (25 with GUs and 10 with DUs) received H. pylori eradication therapy. In all patients, H. pylori was susceptible to amoxicillin and clarithromycin. IL-18 levels before treatment and IL18 genotypes were independent of clinical outcome. Twenty-seven patients were successfully cured (20 with GUs and 7 with DUs). Mucosal IL-18 protein levels markedly decreased after therapy in cured patients irrespective of clinical outcome (P < .001 for both the antrum and the corpus) but remained unchanged in the patients who experienced treatment failure (figure 3). Mucosal IL-18 mRNA levels showed the same patterns as the protein levels (data not shown). IFN-γ levels slightly but significantly decreased in cured patients (P = .024), whereas IL-12 levels remained unchanged irrespective of the results of therapy (data not shown).
Figure 3.

Mucosal interleukin (IL)–18 levels in the antrum and the corpus before and after Helicobacter pylori eradication. P values for comparisons between before and after therapy were calculated by the Wilcoxon signed-rank test, and those for comparisons between cured and noncured before therapy were calculated by the Mann-Whitney rank-sum test.
Interestingly, no cured patient had the IL18 –607C/C genotype (21 [78%] had C/A and 6 [12%] had A/A), whereas 7 (88%) of 8 who experienced treatment failure had the C/C genotype (the other had C/A) (P < .001). As for IL18 –137 genotypes, all noncured patients had the G/G genotype, compared with 20 (74%) of 27 cured patients (the other 7 had G/C). These data suggest that those with high IL-18–inducing genotypes (–607C/C and –137G/G) are more likely to experience treatment failure and are consistent with the fact that pretherapy IL-18 levels were substantially higher in those with treatment failure compared with those who were cured (e.g., 420 [305–487] vs. 165 [41–262] pg/mg of biopsy protein in the antrum; P = .006) (figure 3). Pretherapy IFN-γ levels were also slightly but significantly higher in those who experienced treatment failure (e.g., 47 [34–84] vs. 21 [4.5–31] pg/mg of biopsy protein in the antrum; P = .013). Pretherapy IL-12 levels were only slightly higher in those with treatment failure, and the differences were not statistically significant (data not shown).
DISCUSSION
H. pylori–related gastritis is marked by infiltration of the gastric mucosa with inflammatory cells. In the present study, we showed that IL-18 levels are up-regulated in human gastric mucosa infected with H. pylori. IL-18 protein levels closely correlated with IL-18 mRNA levels, suggesting that the production of IL-18 in the gastric mucosa is not dependent on whether H. pylori infection affects levels of caspase-1 and -3, which are required for cleavage of the pro–IL-18 to mature IL-18 and for cleavage of the pro–IL-18 and mature IL-18 to a 16-kDa product, respectively.
There is uncertainty regarding the relationship between H. pylori and IFN-γ, with some investigators suggesting that H. pylori induces IFN-γ [20–24] and others disagreeing [25–28]. Similar controversy exists regarding the induction of IL-12 by H. pylori [20, 23–26, 29, 30]. Our present data clearly show that H. pylori infection is associated with a dramatic induction of IL-18 in the gastric mucosa, whereas it is only weakly associated with IFN-γ and IL-12 induction. Because the assay variation for each cytokine did not differ, our data, even with the small sample size, clearly show that the relationship between H. pylori infection and IL-18 induction is much stronger than that between H. pylori infection and IFN-γ and IL-12 induction. IL-18 is known to induce IFN-γ in the presence of IL-12 in vitro [4–6], and studies in IL-18 knockout mice showed that IL-18 is an essential coregulator of H. pylori–specific Th1 immunity and is critical for the development of strong IFN-γ production [31]. Taken together, our results suggest that up-regulation of IFN-γ and IL-12 is not a direct effect of H. pylori infection. This is supported by the fact that only IL-18 levels decreased dramatically after successful eradication therapy.
Our results show that IL-18 is involved H. pylori–associated cellular infiltrations of the gastric mucosa. Both univariate analysis and multiple regression analysis showed that, among the Th1 cytokines studied, IL-18 level was the determining factor for MNC infiltration. These results suggest that IL-18 can induce MNC infiltration without the synergistic effect of IL-12 to induce IFN-γ. In contrast, univariate analysis suggested that all of the Th1 cytokines studied were involved in PMN infiltration in the corpus, whereas multiple regression analysis showed that only IL-18 was an independent determining factor for PMN infiltration. However, maximal PMN infiltration might result from the induction of high IFN-γ levels in the presence of high IL-18 levels, along with the synergistic effect due to the presence of IL-12.
We also focused on IL18 polymorphisms as a candidate for the regulation of IL-18 levels in response to H. pylori infection, on the basis of a previous in vitro study [18]. Two SNPs at position –607 and –137 have been predicted to be nuclear factor binding sites for the cAMP-responsive element-binding protein and the H4TF-1 nuclear factor, respectively. Although there were no significant differences in promoter activity between alleles without stimulation, one allele (A at position –607 and C at position –137) clearly showed lower activity after PMA and ionomicin treatment [18]. We found that patients with IL18 –607C/C and 37G/G had higher gastric mucosal IL-18 levels. Additionally, the relationship was observed only in stimulated specimens (i.e., H. pylori–infected gastric mucosa), which clearly supports the results from in vitro models.
We measured cytokine levels in GC tissues and found that IL-18 levels were markedly up-regulated during GC. Previous studies examining the mucosal IL-12 and IFN-γ mRNA levels during GC found that the prevalence of IL-12, but not IFN-γ, was significantly higher in cancerous tissues than in adjacent noncancerous tissues [32], in agreement with our current data on protein levels. However, we found for the first time that IL-18 protein levels were markedly up-regulated during GC and that the levels were much higher than those of IL-12 and IFN-γ. Recent reports have shown that serum IL-18 levels represent a significant postoperative prognostic determinant in patients with gastric carcinoma, that serum IL-18 levels in patients who had undergone surgical resection decreased postoperatively, and that serum IL-18, but not IL-12 or IFN-γ, could serve as a diagnostic marker for GC [33, 34]. There is recent evidence showing that IL-18 plays many roles other than inducing IFN-γ (e.g., enhancing the expression of IL-2, granulocyte-macrophage colony-stimulating factor [5, 35], and Fas ligand [36]). Interestingly, we found that IL-18 levels were not correlated with IL-12 and IFN-γ levels in GC tissues, suggesting that IL-18 may play a unique role in cancer development.
Finally, it is of interest that patients with IL18 –607C/C and –137G/G, which produce high IL-18 levels and severe MNC infiltration, had H. pylori infections that were difficult to cure. The differences were apparent (P < .001), and all patients with IL18 –607C/C and –137G/G experienced treatment failure. Taken together with the fact that pretherapy IL-18 levels were substantially higher in those with treatment failure than in those who were successfully treated, some functions of IL-18 might influence treatment outcome. Because treatment failure cannot be entirely explained by noncompliance and resistance to antibiotics, it is possible that impaired host immunity may also contribute to treatment failure. Currently, the immune polarization toward a Th1 response is thought to be responsible for protective immunity, in part because of results obtained using the cytokine knockout mice model (reviewed in [37]); however, there is still controversy concerning the roles played by T cells in protection. In the case of IL-18, one study has suggested that there is no role for IL-18 in protective immunity [38], and another has suggested that vaccine-induced protection was impaired in IL-18 knockout mice [31]. However, the phenomenon that occurs in mice might not reflect that in humans after treatment using antibiotics and acid suppression. In our human study, pretherapy IL-18 levels were substantially higher in those with treatment failure that in those whose treatment was successful, suggesting that high IL-18 levels may be disadvantageous for successful treatment. Human studies have shown that the cytokine switch from Th1 to Th2 is linked to host protection and that reduced IL-4 production contributes to treatment failure [39]. Therefore, in gastric mucosa with high IL-18 production, the mucosal cytokine switch to Th2 might be weak (e.g., low IL-4 levels). Further studies with large number of subjects will be needed to confirm whether the relationship between IL-18 genotypes and treatment failure observed here is true. If so, it would be important to identify patients with IL18 –607C/C and –137G/G so that they could receive different or possibly longer eradication therapy.
Supplementary Material
Acknowledgments
National Institutes of Health (grant DK 62813 to Y.Y.).
We thank Dr. David Y. Graham (Baylor College of Medicine, Houston, Texas) for providing prudent advice and checking the manuscript.
Footnotes
Potential conflicts of interest: none reported.
Presented in part: XXth International Workshop on Helicobacter and Related Bacteria in Chronic Digestive Inflammation, Istanbul, 20–22 September 2007 (abstract 165).
References
- 1.Wilson KT, Crabtree JE. Immunology of Helicobacter pylori: insights into the failure of the immune response and perspectives on vaccine studies. Gastroenterology. 2007;133:288–308. doi: 10.1053/j.gastro.2007.05.008. [DOI] [PubMed] [Google Scholar]
- 2.Okamura H, Tsutsi H, Komatsu T, et al. Cloning of a new cytokine that induces IFN-gamma production by T cells. Nature. 1995;378:88–91. doi: 10.1038/378088a0. [DOI] [PubMed] [Google Scholar]
- 3.Ushio S, Namba M, Okura T, et al. Cloning of the cDNA for human IFN-gamma-inducing factor, expression in Escherichia coli, and studies on the biologic activities of the protein. J Immunol. 1996;156:4274–9. [PubMed] [Google Scholar]
- 4.Coughlin CM, Salhany KE, Wysocka M, et al. Interleukin-12 and interleukin-18 synergistically induce murine tumor regression which involves inhibition of angiogenesis. J Clin Invest. 1998;101:1441–52. doi: 10.1172/JCI1555. [DOI] [PMC free article] [PubMed] [Google Scholar]
- 5.Micallef MJ, Ohtsuki T, Kohno K, et al. Interferon-gamma-inducing factor enhances T helper 1 cytokine production by stimulated human T cells: synergism with interleukin-12 for interferon-gamma production. Eur J Immunol. 1996;26:1647–51. doi: 10.1002/eji.1830260736. [DOI] [PubMed] [Google Scholar]
- 6.Tone M, Thompson SA, Tone Y, Fairchild PJ, Waldmann H. Regulation of IL-18 (IFN-gamma-inducing factor) gene expression. J Immunol. 1997;159:6156–63. [PubMed] [Google Scholar]
- 7.Tomita T, Jackson AM, Hida N, et al. Expression of Interleukin-18, a Th1 cytokine, in human gastric mucosa is increased in Helicobacter pylori infection. J Infect Dis. 2001;183:620–7. doi: 10.1086/318541. [DOI] [PubMed] [Google Scholar]
- 8.Fera MT, Carbone M, Buda C, et al. Correlation between Helicobacter pylori infection and IL-18 mRNA expression in human gastric biopsy specimens. Ann NY Acad Sci. 2002;963:326–8. doi: 10.1111/j.1749-6632.2002.tb04125.x. [DOI] [PubMed] [Google Scholar]
- 9.di Giovine FS, Takhsh E, Blakemore AI, Duff GW. Single base polymorphism at –511 in the human interleukin-1 beta gene (IL1 beta) Hum Mol Genet. 1992;1:450. doi: 10.1093/hmg/1.6.450. [DOI] [PubMed] [Google Scholar]
- 10.El-Omar EM, Carrington M, Chow WH, et al. Interleukin-1 polymorphisms associated with increased risk of gastric cancer. Nature. 2000;404:398–402. doi: 10.1038/35006081. [DOI] [PubMed] [Google Scholar]
- 11.Kretowski A, Mironczuk K, Karpinska A, et al. Interleukin-18 promoter polymorphisms in type 1 diabetes. Diabetes. 2002;51:3347–9. doi: 10.2337/diabetes.51.11.3347. [DOI] [PubMed] [Google Scholar]
- 12.Sivalingam SP, Yoon KH, Koh DR, Fong KY. Single-nucleotide polymorphisms of the interleukin-18 gene promoter region in rheumatoid arthritis patients: protective effect of AA genotype. Tissue Antigens. 2003;62:498–504. doi: 10.1046/j.1399-0039.2003.00137.x. [DOI] [PubMed] [Google Scholar]
- 13.Bushley AW, Ferrell R, McDuffie K, et al. Polymorphisms of interleukin (IL)-1alpha, IL-1beta, IL-6, IL-10, and IL-18 and the risk of ovarian cancer. Gynecol Oncol. 2004;95:672–9. doi: 10.1016/j.ygyno.2004.08.024. [DOI] [PubMed] [Google Scholar]
- 14.Leung WK, Chan MC, To KF, et al. H. pylori genotypes and cytokine gene polymorphisms influence the development of gastric intestinal metaplasia in a Chinese population. Am J Gastroenterol. 2006;101:714–20. doi: 10.1111/j.1572-0241.2006.00560.x. [DOI] [PubMed] [Google Scholar]
- 15.Dixon MF, Genta RM, Yardley JH, Correa P. Classification and grading of gastritis: the updated Sydney System. International Workshop on the Histopathology of Gastritis, Houston 1994. Am J Surg Pathol. 1996;20:1161–81. doi: 10.1097/00000478-199610000-00001. [DOI] [PubMed] [Google Scholar]
- 16.Hsu PI, Hwang IR, Cittelly D, et al. Clinical presentation in relation to diversity within the Helicobacter pylori cag pathogenicity island. Am J Gastroenterol. 2002;97:2231–8. doi: 10.1111/j.1572-0241.2002.05977.x. [DOI] [PubMed] [Google Scholar]
- 17.Yamaoka Y, Kodama T, Gutierrez O, Kim JG, Kashima K, Graham DY. Relationship between Helicobacter pylori iceA, cagA, and vacA status and clinical outcome: studies in four different countries. J Clin Microbiol. 1999;37:2274–9. doi: 10.1128/jcm.37.7.2274-2279.1999. [DOI] [PMC free article] [PubMed] [Google Scholar]
- 18.Giedraitis V, He B, Huang WX, Hillert J. Cloning and mutation analysis of the human IL-18 promoter: a possible role of polymorphisms in expression regulation. J Neuroimmunol. 2001;112:146–52. doi: 10.1016/s0165-5728(00)00407-0. [DOI] [PubMed] [Google Scholar]
- 19.Oppmann B, Lesley R, Blom B, et al. Novel p19 protein engages IL-12p40 to form a cytokine, IL-23, with biological activities similar as well as distinct from IL-12. Immunity. 2000;13:715–25. doi: 10.1016/s1074-7613(00)00070-4. [DOI] [PubMed] [Google Scholar]
- 20.D’Elios MM, Manghetti M, De CM, et al. T helper 1 effector cells specific for Helicobacter pylori in the gastric antrum of patients with peptic ulcer disease. J Immunol. 1997;158:962–7. [PubMed] [Google Scholar]
- 21.Karttunen R, Karttunen T, Ekre HP, MacDonald TT. Interferon gamma and interleukin 4 secreting cells in the gastric antrum in Helicobacter pylori positive and negative gastritis. Gut. 1995;36:341–5. doi: 10.1136/gut.36.3.341. [DOI] [PMC free article] [PubMed] [Google Scholar]
- 22.Lindholm C, Quiding-Jarbrink M, Lonroth H, Hamlet A, Svennerholm AM. Local cytokine response in Helicobacter pylori-infected subjects. Infect Immun. 1998;66:5964–71. doi: 10.1128/iai.66.12.5964-5971.1998. [DOI] [PMC free article] [PubMed] [Google Scholar]
- 23.Luzza F, Parrello T, Sebkova L, et al. Expression of proinflammatory and Th1 but not Th2 cytokines is enhanced in gastric mucosa of Helicobacter pylori infected children. Dig Liver Dis. 2001;33:14–20. doi: 10.1016/s1590-8658(01)80130-4. [DOI] [PubMed] [Google Scholar]
- 24.Pellicano A, Sebkova L, Monteleone G, et al. Interleukin-12 drives the Th1 signaling pathway in Helicobacter pylori-infected human gastric mucosa. Infect Immun. 2007;75:1738–44. doi: 10.1128/IAI.01446-06. [DOI] [PMC free article] [PubMed] [Google Scholar]
- 25.Haeberle HA, Kubin M, Bamford KB, et al. Differential stimulation of interleukin-12 (IL-12) and IL-10 by live and killed Helicobacter pylori in vitro and association of IL-12 production with gamma interferon-producing T cells in the human gastric mucosa. Infect Immun. 1997;65:4229–35. doi: 10.1128/iai.65.10.4229-4235.1997. [DOI] [PMC free article] [PubMed] [Google Scholar]
- 26.Karttunen RA, Karttunen TJ, Yousfi MM, El-Zimaity HM, Graham DY, El-Zaatari FA. Expression of mRNA for interferon-gamma, interleukin-10, and interleukin-12 (p40) in normal gastric mucosa and in mucosa infected with Helicobacter pylori. Scand J Gastroenterol. 1997;32:22–7. doi: 10.3109/00365529709025058. [DOI] [PubMed] [Google Scholar]
- 27.Peek RM, Jr, Miller GG, Tham KT, et al. Heightened inflammatory response and cytokine expression in vivo to cagA+ Helicobacter pylori strains. Lab Invest. 1995;73:760–70. [PubMed] [Google Scholar]
- 28.Yamaoka Y, Kita M, Kodama T, Sawai N, Kashima K, Imanishi J. Expression of cytokine mRNA in gastric mucosa with Helicobacter pylori infection. Scand J Gastroenterol. 1995;30:1153–9. doi: 10.3109/00365529509101624. [DOI] [PubMed] [Google Scholar]
- 29.Bauditz J, Ortner M, Bierbaum M, Niedobitek G, Lochs H, Schreiber S. Production of IL-12 in gastritis relates to infection with Helicobacter pylori. Clin Exp Immunol. 1999;117:316–23. doi: 10.1046/j.1365-2249.1999.00968.x. [DOI] [PMC free article] [PubMed] [Google Scholar]
- 30.Hida N, Shimoyama T, Jr, Neville P, et al. Increased expression of IL-10 and IL-12 (p40) mRNA in Helicobacter pylori infected gastric mucosa: relation to bacterial cag status and peptic ulceration. J Clin Pathol. 1999;52:658–64. doi: 10.1136/jcp.52.9.658. [DOI] [PMC free article] [PubMed] [Google Scholar]
- 31.Akhiani AA, Schon K, Lycke N. Vaccine-induced immunity against Helicobacter pylori infection is impaired in IL-18-deficient mice. J Immunol. 2004;173:3348–56. doi: 10.4049/jimmunol.173.5.3348. [DOI] [PubMed] [Google Scholar]
- 32.Katano M, Nakamura M, Kuwahara A, et al. Expression of interleukin (IL)-12 mRNA in gastric carcinoma specimens: cellular antitumor immune responses. J Surg Oncol. 1998;67:11–7. doi: 10.1002/(sici)1096-9098(199801)67:1<11::aid-jso3>3.0.co;2-p. [DOI] [PubMed] [Google Scholar]
- 33.Kawabata T, Ichikura T, Majima T, et al. Preoperative serum interleukin-18 level as a postoperative prognostic marker in patients with gastric carcinoma. Cancer. 2001;92:2050–5. doi: 10.1002/1097-0142(20011015)92:8<2050::aid-cncr1544>3.0.co;2-5. [DOI] [PubMed] [Google Scholar]
- 34.Thong-Ngam D, Tangkijvanich P, Lerknimitr R, Mahachai V, Theamboonlers A, Poovorawan Y. Diagnostic role of serum interleukin-18 in gastric cancer patients. World J Gastroenterol. 2006;12:4473–7. doi: 10.3748/wjg.v12.i28.4473. [DOI] [PMC free article] [PubMed] [Google Scholar]
- 35.Noguchi Y, Wada H, Marino MW, Old LJ. Regulation of IFN-gamma production in granulocyte-macrophage colony-stimulating factor-deficient mice. Eur J Immunol. 1998;28:3980–8. doi: 10.1002/(SICI)1521-4141(199812)28:12<3980::AID-IMMU3980>3.0.CO;2-D. [DOI] [PubMed] [Google Scholar]
- 36.Tsutsui H, Nakanishi K, Matsui K, et al. IFN-gamma-inducing factor up-regulates Fas ligand-mediated cytotoxic activity of murine natural killer cell clones. J Immunol. 1996;157:3967–73. [PubMed] [Google Scholar]
- 37.Wilson KT, Crabtree JE. Immunology of Helicobacter pylori: insights into the failure of the immune response and perspectives on vaccine studies. Gastroenterology. 2007;133:288–308. doi: 10.1053/j.gastro.2007.05.008. [DOI] [PubMed] [Google Scholar]
- 38.Panthel K, Faller G, Haas R. Colonization of C57BL/6J and BALB/c wild-type and knockout mice with Helicobacter pylori: effect of vaccination and implications for innate and acquired immunity. Infect Immun. 2003;71:794–800. doi: 10.1128/IAI.71.2.794-800.2003. [DOI] [PMC free article] [PubMed] [Google Scholar]
- 39.Borody T, Ren Z, Pang G, Clancy R. Impaired host immunity contributes to Helicobacter pylori eradication failure. Am J Gastroenterol. 2002;97:3032–7. doi: 10.1111/j.1572-0241.2002.07121.x. [DOI] [PubMed] [Google Scholar]
Associated Data
This section collects any data citations, data availability statements, or supplementary materials included in this article.