

Abstract
Association signals in GWAS are usually prioritized solely by p values. Here, we attempt to improve the power of GWAS by using a weighted false discovery rate control procedure to detect associations of low-frequency variants with effect sizes similar to or even larger than those of common variants. We used the Affymetrix Genome-Wide Human SNP Array 6.0 to test for association with fasting glucose levels in the Atherosclerosis Risk in Communities Study (ARIC) population. In addition to finding several previously identified sequence variations, we identified a low-frequency variant (rs1209523; minor allele frequency = 0.043) near FOXA2 that was associated with fasting glucose levels in European Americans (EAs) (n = 7428, p value = 1.3 × 10⁻⁵). The association between rs1209523 and glucose levels was also significant in African Americans (AAs) (n = 2029, p value = 6.7 × 10⁻³) of the ARIC and was confirmed by replication in both EAs and AAs of the Dallas Heart Study (n = 963 and 1571, respectively; p values = 5.3 × 10⁻³ and 5.8 × 10⁻⁴, respectively) and in EAs of the Cooper Center Longitudinal Study (n = 2862; p value = 1.6 × 10⁻²). A meta-analysis of these five populations yielded an estimated effect size of −1.31 mg/dl per minor allele (p value = 2.2 × 10⁻¹¹). This study reveals that there is a cache of less-frequent variants in GWAS arrays that can be identified via analytical approaches accounting for allele frequencies.
Main Text
GWAS have identified hundreds of loci associated with common complex traits and diseases.1 Despite the explosive growth of discoveries in the past few years, the common variants identified by GWAS typically have modest effect sizes and account for only a small fraction of the heritability of complex traits.2,3 Two major factors underlie the low power of detecting associations between low-frequency variants and complex traits in GWAS. First, the commercially available marker arrays that are used in GWAS are designed to capture common variants. Second, conventional statistical methods currently employed to analyze GWAS data equally weight each hypothesis and prioritize the signals purely by the p values obtained.
Various strategies have been proposed to uncover the full allelic spectrum of complex traits. One approach has been to enhance the power of GWAS by increasing sample sizes, enhancing the coverage of common variants, and improving phenotype definition and assessments.2,4,5 Another approach has been to shift the focus to genome resequencing to detect rare variants with large effect sizes.6 We have focused on developing new strategies to use the existing data of GWAS to identify less-frequent variants that contribute to common complex traits. For the purposes of the current study, we defined common variants as SNPs with a minor allele frequency (MAF) ≥ 5%, which is consistent with that of the International HapMap Consortium.7,8 SNPs with a MAF < 5% were classified as less-frequent variants. A weighted-Holm procedure,9 which is a Bonferroni-type multiple-testing correction technique, had been proposed to account for allele frequencies in GWAS.10 Here, we employed a weighted false discovery rate (FDR) control procedure11 to enhance the power of detecting associations between less-frequent variants and fasting glucose levels in the Atherosclerosis Risk in Communities Study (ARIC)12 genotyped with the Affymetrix Genome-Wide Human SNP Array 6.0.13
We first examined the distribution of allele frequency of autosomal SNPs in data provided by Affymetrix for the HapMap samples,14 focusing on the Yoruba samples from Ibadan, Nigeria (YRI) and the European American samples from Utah, USA, of the Centre d'Etude du Polymorphisme Humain collection (CEU), and in data from the ARIC study including 8862 European Americans (EAs) and 2573 African Americans (AAs). In each population of the ARIC study, SNPs were excluded if they were monomorphic or singletons or if they had > 10% missing genotypes or significant deviation from the Hardy-Weinberg equilibrium (p value ≤ 1.0 × 10⁻⁴ by the exact test15). After data cleaning, 814,004 SNPs remained in the EAs and 818,899 SNPs remained in the AAs. Although the SNP Array 6.0 was designed primarily for capturing common SNPs, considerable information can be gleaned regarding less-frequent SNPs, nonsynonymous SNPs (nsSNPs) in particular (Tables S1 and S2, available online). Significant concordance was observed in the MAF distributions of SNPs between EA and CEU and between AA and YRI, which suggests that MAFs from appropriate reference populations can be used as weights in GWAS employing the weighed procedure proposed in this study.
Because the MAF appears to be inversely related to the proportion of functional SNPs,16–18 we took the less-frequent nsSNPs as candidate functional variants and compared the performance of neighboring SNPs with different MAFs to tag these SNPs. The neighboring SNPs were defined as the SNPs that were within 8 kilobases (kb) and 4 kb of a less-frequent nsSNP in the EA population and the AA population, respectively. The interval was chosen because the average length of haplotype blocks was 16.3 kb in CEU and 7.3 kb in YRI.8 An inverse relationship was found between the MAFs of neighboring SNPs and the degree of linkage disequilibrium (LD), measured by r2; the less-frequent nsSNPs were best tagged by less-frequent SNPs (Table 1). Note that we specifically used r2 instead of other measures of LD because it is a correlation coefficient,19 analogous to the metrics typically used in GWAS. This result suggests that the less-frequent SNPs are potentially valuable in identifying low-frequency causal variants in genetic association studies.
Table 1.
The Average Degree of Linkage Disequilibrium, r2, between Less-Frequent Nonsynonymous SNPs and Neighboring SNPs from the Affymetrix Genome-Wide Human SNP 6.0 Array Stratified by MAF in the ARIC Data
| MAF | EA | AA |
|---|---|---|
| (0, 0.05) | 0.124 | 0.084 |
| [0.05, 0.10) | 0.031 | 0.037 |
| [0.10, 0.20) | 0.016 | 0.016 |
| [0.20, 0.30) | 0.011 | 0.016 |
| [0.30, 0.40) | 0.009 | 0.018 |
| [0.40, 0.50] | 0.008 | 0.019 |
Abbreviations are as follows: MAF, minor allele frequency; EA, European American; AA, African American.
To demonstrate the value of less-frequent variants in GWAS, we performed a genome-wide association scan on fasting glucose levels in the EA population of the ARIC study, using the 814,004 autosomal SNPs that passed the quality control. A total of 7428 individuals remained in the analysis after removal of diabetic individuals and those without phenotype information. A total of 1200 ancestry-informative markers (AIMs) uniformly distributed across the genome were selected,20–22 and principal components analysis on these SNPs was performed for the purpose of adjusting for population stratification.23 Association between the trait and each SNP was tested by a linear regression model incorporating age, sex, body mass index, and the first two eigenvectors from principal components analysis of AIMs as covariates. The genotypic value was coded in an additive genetic model, with 0, 1, and 2 denoting major allele homozygote, heterozygote, and minor allele homozygote, respectively. Because the distribution of fasting glucose levels was skewed, a Box-Cox power transformation24 (λ = -0.71) was applied to the trait. The quantile-quantile plot indicates no systematic deviation from the null distribution, and the inflation factor25 is 1.03 (Figure 1).
Figure 1.
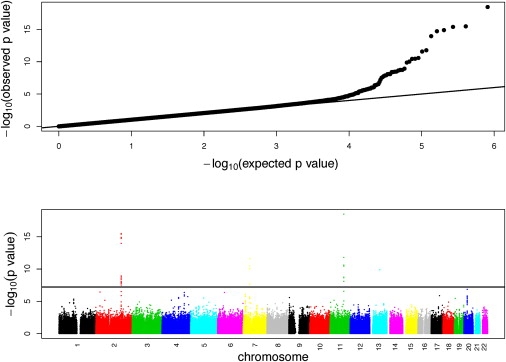
A Genome-wide Scan of Plasma Fasting Glucose Levels in the EA Population of the ARIC
Quantitle-quantile plot and scatterplot of p values. The black horizontal line denotes a p value of 6.14 × 10⁻⁸ corresponding to the Bonferroni-corrected p value of 0.05.
We compared the results of three procedures controlling for the global type I error (Table 2, Table S3). The Bonferroni correction was used to control the family-wise error rate at the level of 0.05. With this procedure, a nominal p value less than or equal to 6.14 × 10⁻⁸ was required to declare significance. There were 29 SNPs, located in four genomic regions (2q24.3, 7p13, 11q21, and 13q21.32), that met this criterion. The Benjamini and Hochberg (BH) procedure26,27 was used to control the FDR at the level of 0.05, and an additional SNP, located at 2q24.3, was found (p value = 9.1 × 10⁻⁸). Thirdly, aiming to detect less-frequent variants associated with the trait, we employed a weighted BH (WBH) procedure11 by weighting each hypothesis according to the MAF of each SNP such that a hypothesis with a lower MAF received a greater weight. The MAFs were obtained from the Affymetrix reference population of European descent. For those with MAF equal to zero in the reference population, we set them as 0.0001. For each SNP i with MAF , in which i ∈ {1, 2, …, m} and m is the total number of SNPs, we defined its weight as such that . Controlling the FDR at the 0.05 level by the WBH procedure, we identified six more SNPs that met the selection criterion, in addition to those that we had found by using equal weights; we identified a total of 36 SNPs, located in eight genomic regions (2p23.3, 2q24.3, 4q31.23, 6p12.3, 7p13, 11q21, 13q21.32, and 20p11.21). Among the eight regions, four (2p23.3, 2q24.3, 7p13, and 11q21) have been previously reported to be associated with fasting glucose levels at a genome-wide significance level in other GWAS,28–34 and the other four have not been previously reported to be associated with the trait.
Table 2.
Comparison of Three Procedures Controlling for Global Type I error in the Genome-wide Scan of Fasting Glucose Levels in the EA Population of the ARIC
| Region | Candidate Gene(s) | Total SNPsa | MAFb |
No. of SNPs Identified |
||
|---|---|---|---|---|---|---|
| Bonferroni | BH | WBH | ||||
| 2p23.3 | GCKR | 1 | 0.40 | 0 | 0 | 1 |
| 2q24.3 | G6PC2, ABCB11 | 19 | 0.29 ∼0.48 | 17 | 18 | 19 |
| 4q31.23 | NR3C2 | 1 | 0.072 | 0 | 0 | 1 |
| 6p12.3 | RUNX2 | 1 | 0.28 | 0 | 0 | 1 |
| 7p13 | GCK | 4 | 0.17 ∼0.22 | 4 | 4 | 4 |
| 11q21 | MTNR1B | 8 | 0.28 ∼0.43 | 7 | 7 | 8 |
| 13q21.32 | PCDH9 | 1 | 0.00018 | 1 | 1 | 1 |
| 20p11.21 | FOXA2 | 1 | 0.042 | 0 | 0 | 1 |
| Total | 36 | 29 | 30 | 36 | ||
The Bonferroni correction procedure controls the family-wise error rate at 0.05, whereas both the BH and WBH procedures control the FDR at 0.05. Abbreviations are as follows: MAF, minor allele frequency; BH, Benjamini and Hochberg procedure; WBH, weighted Benjamini and Hochberg procedure.
The number of significant SNPs in each region obtained with the use of the three procedures. The numbers are identical to those of the WBH procedure in this study.
The range of MAF for all of the significant SNPs (column 2) in each region calculated in the EA population of the ARIC.
We tested association of the four SNPs (rs6816503, rs1928529, rs1442017, and rs6048209) identified as the genome-wide significance level in these four newly discovered regions with fasting glucose levels in the AA population of the ARIC study, using the same model that we used in the EA population. The only significant SNP is rs6048209 (MAF = 0.042 and 0.39 in EAs and AAs, respectively) at 20p11.21 (p value = 5.4 × 10⁻³). We were not able to design a real-time PCR assay to replicate rs6048209 in other populations. Therefore, we chose another SNP, rs1209523 (MAF = 0.043 and 0.37 in EAs and AAs, respectively), which is in strong LD (r2 = 1.00 and 0.86 in the HapMap CEU data and ARIC EAs, respectively) with and close (∼3.1 kb) to rs6048209, for replication (Figure 2, Table 3). The SNP rs1209523 is associated with fasting glucose levels in both EAs (p value = 1.3 × 10⁻⁵) and AAs (p value = 6.7 × 10⁻³) of the ARIC study. We genotyped this SNP in both EAs (n = 963) and AAs (n = 1,571) of the Dallas Heart Study (DHS),35 and we confirmed that it was associated with fasting glucose levels in both ethnic groups (p values = 5.3 × 10⁻³ and = 5.8 × 10⁻⁴, respectively) after controlling for population stratification as described previously.36 This association was further confirmed in the EA population (n = 2862, p value = 1.6 × 10⁻²) of the Cooper Center Longitudinal Study (CCLS).37 The direction of effect was constant across studies (Figure 3). A fixed-effects meta-analysis of regression coefficients weighting by the inverse of the variance38 estimated the effect size to be −1.50, −1.16, and −1.31 mg/dl per minor allele in EAs, AAs, and all samples, respectively; the corresponding p values were = 4.4 × 10⁻⁷, 4.0 × 10⁻⁶, and 2.2 × 10⁻¹¹, respectively. The gene FOXA2 (MIM 600288), close to this SNP, is a potential candidate. It is highly expressed in liver and pancreas and is known to be involved in glucose homeostasis (for a review, see 39).
Figure 2.
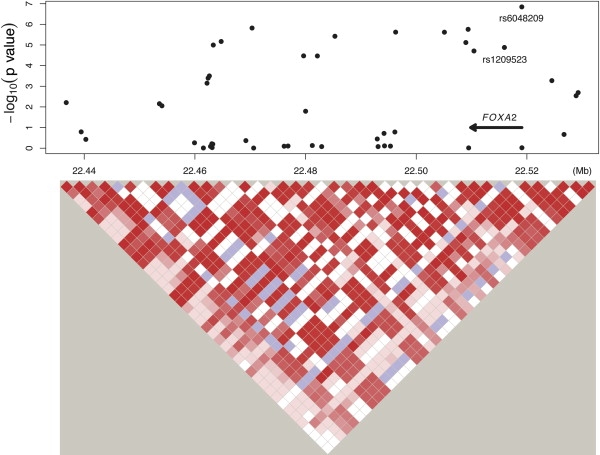
Association of SNPs at Chromosome 20p11.21 with Fasting Glucose Levels in the EA Population of the ARIC
Scatterplot of p values and LD structure of the region.
Table 3.
Association between rs1209523 and Fasting Glucose Levels in Five Populations
| Study | Ethnicity | MAF | p Value |
Fasting Glucose Levels (mg/dl)a |
|||||
|---|---|---|---|---|---|---|---|---|---|
|
CC Genotype |
CT Genotype |
TT Genotype |
|||||||
| N | Mean ± SD | N | Mean ± SD | N | Mean ± SD | ||||
| ARIC | EA | 0.043 | 1.3 × 10⁻⁵ | 6807 | 98.7 ± 9.0 | 602 | 97.3 ± 9.0 | 19 | 86.5 ± 11.0 |
| DHS | EA | 0.044 | 5.3 × 10⁻³ | 883 | 91.9 ± 11.8 | 76 | 88.4 ± 11.0 | 4 | 79.0 ± 5.6 |
| ACLS | EA | 0.037 | 1.6 × 10⁻² | 2651 | 96.7 ± 11.8 | 211 | 95.8 ± 12.1 | 0 | NA |
| Subtotalb | EA | 4.4 × 10⁻⁷ | |||||||
| ARIC | AA | 0.367 | 6.7 × 10⁻³ | 808 | 99.2 ± 10.1 | 952 | 98.1 ± 9.7 | 269 | 97.5 ± 10.1 |
| DHS | AA | 0.391 | 5.8 × 10⁻⁴ | 585 | 92.5 ± 13.8 | 742 | 91.5 ± 11.6 | 244 | 88.5 ± 10.8 |
| Subtotalb | AA | 4.0 × 10⁻⁶ | |||||||
| Totalb | EA+AA | 2.2 × 10⁻¹¹ | |||||||
MAF, minor allele frequency.
Diabetic individuals were excluded.
By a fixed-effects meta-analysis of regression coefficients weighting by the inverse of the variance.
Figure 3.

Association between rs1209523 and Fasting Glucose Levels In Five Populations
In this study, we identified associations between less-frequent SNPs near FOXA2 and fasting glucose levels in a genome-wide scan by weighting hypotheses on the basis of the MAF of SNPs, such that MAFs of less-frequent SNPs counted more in assessing the FDR. The association signal would have been missed with the use of the Bonferroni correction or the BH procedure that equally weights each hypothesis to control the global type I error rate at 0.05. Careful examination of the MAFs and effect sizes explained the findings. Among the five regions (2p23.3, 2q24.3, 7p13, 11q21, 20p11.21) confirmed to be associated with fasting glucose levels in the EAs,28–34 the less-frequent variant rs6048209 at 20p11.21 had the largest effect size (Table S3), and thus it attained a compelling p value; however, it did not meet the level of genome-wide significance unless the MAFs were taken into consideration. Recently, the Meta-Analysis of Glucose and Insulin-related traits Consortium (MAGIC) reported association of 16 loci with fasting glucose levels in 46,263 individuals of European descent from 21 cohorts;40 however, the region 20p11.2 was not in the list. Note that all SNPs with significant p values (≤1.0 × 10⁻⁴) at 20p11.21 in the ARIC EA population have low MAFs in EA and CEU populations (Table S4); thus, their associations are less likely to be detected as compared to the more frequent variants given similar effect sizes. We speculate that this might be the reason that the association between FOXA2 and fasting glucose levels was not detected in the previous large-scale European-ancestry-based GWAS. There appeared to be an inverse relationship between MAF and effect size in these five regions. We speculate that this relationship arose because the MAF and effect size are inversely related given a test statistic value.41 The data in this study is insufficient to address the architecture of the trait. Compared to an equal-weighting approach, the WBH method determines the significance level accounting for the MAFs without changing the effect size estimate. Therefore, it is subject to the “winner's curse,” and proper correction needs to be done in power calculation for replication studies.
We performed a proof-of-principle simulation study based on the genetic structure of the ARIC EA data to investigate the empirical power of the WBH method. A quantitative trait was simulated on the basis of the five SNPs rs780094 (MAF = 0.40), rs552976 (MAF = 0.35), rs2908289 (MAF = 0.17), rs10830963 (MAF = 0.28), and rs6048209 (MAF = 0.04), each being the top SNP at the five regions confirmed to be associated with fasting glucose levels. These five SNPs account for 3.58% of total variance of glucose levels in the real data, the ratio of individual contributions being . To keep this variance components structure, we simulated the ratio of effect sizes of the corresponding variants as according to the formula 41,42 under the assumption of an additive model at each locus and between loci. One thousand data sets were simulated. We performed genome-wide scans by using a linear regression model and compared the empirical power of the three test procedures—Bonferroni, BH, and WBH—to detect the five regions associated with the trait at a genome-wide significance level (Table 4). The weighting function was the same as that in the real data analysis. The results showed that the WBH procedure greatly increased the power of detecting association of less-frequent variants with compelling p values that fell short of genome-wide significance. The power of detecting association of less-frequent variants at 20p11.21 was 0.422 by Bonferroni correction, and the WBH procedure increased the power to 0.774. The results also indicated a situation in which the WBH procedure could increase the power of detecting association of common variants. When the significance level of a common variant is close to that of a less-frequent one, threshold relaxation by the WBH procedure might lead to declaration of significance for both signals. The power of detecting association of common variants at 2p23.3 was 0.413 by Bonferroni correction, and the WBH procedure increased the power to 0.773.
Table 4.
Empirical-Power Comparison of Three Procedures Controlling for Global Type I error in 1000 Genome-wide Scans
| Region |
Method |
||
|---|---|---|---|
| Bonferroni | BH | WBH | |
| 2p23.3 | 0.413 | 0.540 | 0.773 |
| 2q24.3 | 1.000 | 1.000 | 1.000 |
| 7p13 | 1.000 | 1.000 | 1.000 |
| 11q21 | 1.000 | 1.000 | 1.000 |
| 20p11.21 | 0.422 | 0.549 | 0.774 |
The Bonferroni correction procedure controls the family-wise error rate at 0.05, whereas both BH and WBH procedures control the false discovery rate at 0.05. Abbreviations are as follows: BH, Benjamini and Hochberg procedure; WBH, weighted Benjamini and Hochberg procedure.
In this study, we proposed using the WBH procedure to increase the power of detecting association of less-frequent variants in GWAS. Nonetheless, we wish to emphasis that the WBH test is a prototype, not a panacea. Its properties in GWAS should be further investigated. In this study, we used a loss-weighting approach that places weights on error rates according to the MAFs.11 This weighting scheme does not change the order of hypotheses as compared to an equal-weighting procedure, but the corresponding adjusted p value43 is affected, with a larger weight counting more in assessing FDR. As a result, not only the signal of less-frequent SNP rs6048209 but also the signal of common variant rs780094 (MAF = 0.40) at 2p23.3, which achieved the level of genome-wide significance only in extremely large samples (>35,00028) because of small effect size, were boosted to genome-wide significance. Another approach is to weight the p value directly.9,44 This strategy would affect the order of hypotheses relative to an equal-weighting procedure. It is conceivable that the p value weighting method will be sensitive to the weighting function chosen. Using the same weighting function as that used in the loss-weighting method, the p value weighting method detected fewer significant SNPs than did the loss-weighting method in tests for association with fasting glucose levels in ARIC EAs (data not shown). Both weighting schemes have merits, and their advantages and disadvantages in GWAS are worth investigating.
A well-accepted threshold for genome-wide significance in GWAS is , which corresponds to a family-wise error rate of approximately 0.05, assuming ∼1 million independent hypothesis tests across the genome.45–47 To achieve this level of significance, a large sample size will be required for detecting the association of less-frequent variants, even though their effect sizes are similar to or larger than those of common variants. However, the heterogeneity of consortia data may impair the power of a study, and the less-frequent variants will always be inferior to the common variants to be detected as long as all hypotheses are equally weighted. In this study, the meta-analysis p value attained genome-wide significance only when all five samples were included; all signals in the 16 regions detected by the MAGIC were common variants. Thus, weighting hypotheses by MAFs and other preknowledge may provide a practical way for detecting association of less-frequent variants, and we advocate using such methods to reanalyze existing GWAS data, particularly when independent samples are available for replication. The proposed method is also applicable to meta-analysis, provided that the samples are homogeneous in terms of genetic background, such that MAFs from appropriate reference populations can be used as weights. In this study, we employed a frequentist approach; alternatively, a Bayesian approach48,49 can be employed. To better handle dependence between tests caused by LD structure, future research should incorporate a weighted version of the FDR control procedure under dependence.27
In summary, we employed a WBH procedure to detect less-frequent variants associated with fasting glucose levels in a GWAS. Our primary goal was to look specifically at less-frequent variants, which are usually discarded in GWAS and whose association signals typically cannot meet the genome-wide significance by conventional methods. We showed that considerable information on less-frequent variants is included in a commercial array based on randomly distributed SNP selection. Though more complete coverage of the genome will capture more variants of low frequency, we speculate that the issue of low power in detecting association for less-frequent variants will remain because of sample size limitations. Efforts to develop new methods to extract information regarding less-frequent variants on the current arrays also have pertinence to the next-generation GWAS, in which larger numbers of low-frequency variants will be included.
Acknowledgments
We thank the reviewers for their insightful comments in improving the manuscript. We thank Tom Hyatt for technical assistance and Helen Hobbs for helpful discussions. We are grateful to the staff and participants of the DHS, the ARIC, and the CCLS for their contributions. This work was supported by grants from the Donald W. Reynolds Foundation and the U.S. National Heart, Lung, and blood Institute (NHLBI) (HL082896, HL092550). The ARIC Study is carried out as a collaborative study supported by NHLBI contracts N01-HC-55015, N01-HC-55016, N01-HC-55018, N01-HC-55019, N01-HC-55020, N01-HC-55021, N01-HC-55022, R01HL087641, R01HL59367, and R01HL086694; National Human Genome Research Institute contract U01HG004402; and National Institutes of Health (NIH) contract HHSN268200625226C. Infrastructure was partly supported by grant no. UL1RR025005, a component of the NIH and the Roadmap for Medical Research. C.X. was partially supported by a Pilot Award from UL1RR024982 from the National Center for Research Resources.
Supplemental Data
Web Resources
The URLs for data presented herein are as follows:
A Catalog of Published Genome-Wide Association Studies (National Institutes of Health), http://www.genome.gov/26525384
HapMap, http://hapmap.ncbi.nlm.nih.gov
Online Mendelian Inheritance in Man (OMIM), http://ncbi.nlm.nih.gov/Omim/
R script on the WBH procedure, available at C.X.'s webpage, http://www8.utsouthwestern.edu/utsw/cda/dept108278/files/390912.html
References
- 1.Hindorff, L.A., Junkins, H.A., Mehta, J.P., and Manolio, T.A. A Catalog of Published Genome-wide Association Studies.
- 2.Altshuler D., Daly M.J., Lander E.S. Genetic mapping in human disease. Science. 2008;322:881–888. doi: 10.1126/science.1156409. [DOI] [PMC free article] [PubMed] [Google Scholar]
- 3.Frazer K.A., Murray S.S., Schork N.J., Topol E.J. Human genetic variation and its contribution to complex traits. Nat. Rev. Genet. 2009;10:241–251. doi: 10.1038/nrg2554. [DOI] [PubMed] [Google Scholar]
- 4.McCarthy M.I., Abecasis G.R., Cardon L.R., Goldstein D.B., Little J., Ioannidis J.P., Hirschhorn J.N. Genome-wide association studies for complex traits: consensus, uncertainty and challenges. Nat. Rev. Genet. 2008;9:356–369. doi: 10.1038/nrg2344. [DOI] [PubMed] [Google Scholar]
- 5.Ioannidis J.P., Thomas G., Daly M.J. Validating, augmenting and refining genome-wide association signals. Nat. Rev. Genet. 2009;10:318–329. doi: 10.1038/nrg2544. [DOI] [PMC free article] [PubMed] [Google Scholar]
- 6.Goldstein D.B. Common genetic variation and human traits. N. Engl. J. Med. 2009;360:1696–1698. doi: 10.1056/NEJMp0806284. [DOI] [PubMed] [Google Scholar]
- 7.Frazer K.A., Ballinger D.G., Cox D.R., Hinds D.A., Stuve L.L., Gibbs R.A., Belmont J.W., Boudreau A., Hardenbol P., Leal S.M., International HapMap Consortium A second generation human haplotype map of over 3.1 million SNPs. Nature. 2007;449:851–861. doi: 10.1038/nature06258. [DOI] [PMC free article] [PubMed] [Google Scholar]
- 8.International HapMap Consortium A haplotype map of the human genome. Nature. 2005;437:1299–1320. doi: 10.1038/nature04226. [DOI] [PMC free article] [PubMed] [Google Scholar]
- 9.Holm S. A Simple Sequentially Rejective Multiple Test Procedure. Scand. J. Stat. 1979;6:65–70. [Google Scholar]
- 10.Dalmasso C., Génin E., Trégouet D.A. A weighted-Holm procedure accounting for allele frequencies in genomewide association studies. Genetics. 2008;180:697–702. doi: 10.1534/genetics.108.089839. [DOI] [PMC free article] [PubMed] [Google Scholar]
- 11.Benjamini Y., Hochberg Y. Multiple Hypotheses Testing with Weights. Scand. J. Stat. 1997;24:407–418. [Google Scholar]
- 12.The ARIC Investigators The Atherosclerosis Risk in Communities (ARIC) Study: design and objectives. The ARIC investigators. Am. J. Epidemiol. 1989;129:687–702. [PubMed] [Google Scholar]
- 13.McCarroll S.A., Kuruvilla F.G., Korn J.M., Cawley S., Nemesh J., Wysoker A., Shapero M.H., de Bakker P.I., Maller J.B., Kirby A. Integrated detection and population-genetic analysis of SNPs and copy number variation. Nat. Genet. 2008;40:1166–1174. doi: 10.1038/ng.238. [DOI] [PubMed] [Google Scholar]
- 14.International HapMap Consortium The International HapMap Project. Nature. 2003;426:789–796. doi: 10.1038/nature02168. [DOI] [PubMed] [Google Scholar]
- 15.Wigginton J.E., Cutler D.J., Abecasis G.R. A note on exact tests of Hardy-Weinberg equilibrium. Am. J. Hum. Genet. 2005;76:887–893. doi: 10.1086/429864. [DOI] [PMC free article] [PubMed] [Google Scholar]
- 16.Cargill M., Altshuler D., Ireland J., Sklar P., Ardlie K., Patil N., Shaw N., Lane C.R., Lim E.P., Kalyanaraman N. Characterization of single-nucleotide polymorphisms in coding regions of human genes. Nat. Genet. 1999;22:231–238. doi: 10.1038/10290. [DOI] [PubMed] [Google Scholar]
- 17.Wong G.K., Yang Z., Passey D.A., Kibukawa M., Paddock M., Liu C.R., Bolund L., Yu J. A population threshold for functional polymorphisms. Genome Res. 2003;13:1873–1879. doi: 10.1101/gr.1324303. [DOI] [PMC free article] [PubMed] [Google Scholar]
- 18.Gorlov I.P., Gorlova O.Y., Sunyaev S.R., Spitz M.R., Amos C.I. Shifting paradigm of association studies: value of rare single-nucleotide polymorphisms. Am. J. Hum. Genet. 2008;82:100–112. doi: 10.1016/j.ajhg.2007.09.006. [DOI] [PMC free article] [PubMed] [Google Scholar]
- 19.Devlin B., Risch N. A comparison of linkage disequilibrium measures for fine-scale mapping. Genomics. 1995;29:311–322. doi: 10.1006/geno.1995.9003. [DOI] [PubMed] [Google Scholar]
- 20.Price A.L., Butler J., Patterson N., Capelli C., Pascali V.L., Scarnicci F., Ruiz-Linares A., Groop L., Saetta A.A., Korkolopoulou P. Discerning the ancestry of European Americans in genetic association studies. PLoS Genet. 2008;4:e236. doi: 10.1371/journal.pgen.0030236. [DOI] [PMC free article] [PubMed] [Google Scholar]
- 21.Tian C., Plenge R.M., Ransom M., Lee A., Villoslada P., Selmi C., Klareskog L., Pulver A.E., Qi L., Gregersen P.K., Seldin M.F. Analysis and application of European genetic substructure using 300 K SNP information. PLoS Genet. 2008;4:e4. doi: 10.1371/journal.pgen.0040004. [DOI] [PMC free article] [PubMed] [Google Scholar]
- 22.Smith M.W., Patterson N., Lautenberger J.A., Truelove A.L., McDonald G.J., Waliszewska A., Kessing B.D., Malasky M.J., Scafe C., Le E. A high-density admixture map for disease gene discovery in african americans. Am. J. Hum. Genet. 2004;74:1001–1013. doi: 10.1086/420856. [DOI] [PMC free article] [PubMed] [Google Scholar]
- 23.Price A.L., Patterson N.J., Plenge R.M., Weinblatt M.E., Shadick N.A., Reich D. Principal components analysis corrects for stratification in genome-wide association studies. Nat. Genet. 2006;38:904–909. doi: 10.1038/ng1847. [DOI] [PubMed] [Google Scholar]
- 24.Box G., Cox D. An analysis of transformations (with discussions) J. R. Stat. Soc., B. 1964;26:211–254. [Google Scholar]
- 25.Devlin B., Roeder K. Genomic control for association studies. Biometrics. 1999;55:997–1004. doi: 10.1111/j.0006-341x.1999.00997.x. [DOI] [PubMed] [Google Scholar]
- 26.Benjamini Y., Hochberg Y. Controlling the false discovery rate: a practical and powerful approach to multiple testing. J. R. Stat. Soc., B. 1995;57:289–300. [Google Scholar]
- 27.Benjamini Y., Yekutieli D. The Control of the False Discovery Rate in Multiple Testing under Dependency. Ann. Stat. 2001;29:1165–1188. [Google Scholar]
- 28.Prokopenko I., Langenberg C., Florez J.C., Saxena R., Soranzo N., Thorleifsson G., Loos R.J., Manning A.K., Jackson A.U., Aulchenko Y. Variants in MTNR1B influence fasting glucose levels. Nat. Genet. 2009;41:77–81. doi: 10.1038/ng.290. [DOI] [PMC free article] [PubMed] [Google Scholar]
- 29.Chen W.M., Erdos M.R., Jackson A.U., Saxena R., Sanna S., Silver K.D., Timpson N.J., Hansen T., Orrù M., Grazia Piras M. Variations in the G6PC2/ABCB11 genomic region are associated with fasting glucose levels. J. Clin. Invest. 2008;118:2620–2628. doi: 10.1172/JCI34566. [DOI] [PMC free article] [PubMed] [Google Scholar]
- 30.Bouatia-Naji N., Bonnefond A., Cavalcanti-Proença C., Sparsø T., Holmkvist J., Marchand M., Delplanque J., Lobbens S., Rocheleau G., Durand E. A variant near MTNR1B is associated with increased fasting plasma glucose levels and type 2 diabetes risk. Nat. Genet. 2009;41:89–94. doi: 10.1038/ng.277. [DOI] [PubMed] [Google Scholar]
- 31.Bouatia-Naji N., Rocheleau G., Van Lommel L., Lemaire K., Schuit F., Cavalcanti-Proença C., Marchand M., Hartikainen A.L., Sovio U., De Graeve F. A polymorphism within the G6PC2 gene is associated with fasting plasma glucose levels. Science. 2008;320:1085–1088. doi: 10.1126/science.1156849. [DOI] [PubMed] [Google Scholar]
- 32.Lyssenko V., Nagorny C.L., Erdos M.R., Wierup N., Jonsson A., Spégel P., Bugliani M., Saxena R., Fex M., Pulizzi N. Common variant in MTNR1B associated with increased risk of type 2 diabetes and impaired early insulin secretion. Nat. Genet. 2009;41:82–88. doi: 10.1038/ng.288. [DOI] [PMC free article] [PubMed] [Google Scholar]
- 33.Sabatti C., Service S.K., Hartikainen A.L., Pouta A., Ripatti S., Brodsky J., Jones C.G., Zaitlen N.A., Varilo T., Kaakinen M. Genome-wide association analysis of metabolic traits in a birth cohort from a founder population. Nat. Genet. 2009;41:35–46. doi: 10.1038/ng.271. [DOI] [PMC free article] [PubMed] [Google Scholar]
- 34.Orho-Melander M., Melander O., Guiducci C., Perez-Martinez P., Corella D., Roos C., Tewhey R., Rieder M.J., Hall J., Abecasis G. Common missense variant in the glucokinase regulatory protein gene is associated with increased plasma triglyceride and C-reactive protein but lower fasting glucose concentrations. Diabetes. 2008;57:3112–3121. doi: 10.2337/db08-0516. [DOI] [PMC free article] [PubMed] [Google Scholar]
- 35.Victor R.G., Haley R.W., Willett D.L., Peshock R.M., Vaeth P.C., Leonard D., Basit M., Cooper R.S., Iannacchione V.G., Visscher W.A., Dallas Heart Study Investigators The Dallas Heart Study: a population-based probability sample for the multidisciplinary study of ethnic differences in cardiovascular health. Am. J. Cardiol. 2004;93:1473–1480. doi: 10.1016/j.amjcard.2004.02.058. [DOI] [PubMed] [Google Scholar]
- 36.Romeo S., Kozlitina J., Xing C., Pertsemlidis A., Cox D., Pennacchio L.A., Boerwinkle E., Cohen J.C., Hobbs H.H. Genetic variation in PNPLA3 confers susceptibility to nonalcoholic fatty liver disease. Nat. Genet. 2008;40:1461–1465. doi: 10.1038/ng.257. [DOI] [PMC free article] [PubMed] [Google Scholar]
- 37.Blair S.N., Kohl H.W., 3rd, Paffenbarger R.S., Jr., Clark D.G., Cooper K.H., Gibbons L.W. Physical fitness and all-cause mortality. A prospective study of healthy men and women. JAMA. 1989;262:2395–2401. doi: 10.1001/jama.262.17.2395. [DOI] [PubMed] [Google Scholar]
- 38.Hedges L.V. Meta-Analysis. J. Educ. Stat. 1992;17:279–296. [Google Scholar]
- 39.Friedman J.R., Kaestner K.H. The Foxa family of transcription factors in development and metabolism. Cell. Mol. Life Sci. 2006;63:2317–2328. doi: 10.1007/s00018-006-6095-6. [DOI] [PMC free article] [PubMed] [Google Scholar]
- 40.Dupuis J., Langenberg C., Prokopenko I., Saxena R., Soranzo N., Jackson A.U., Wheeler E., Glazer N.L., Bouatia-Naji N., Gloyn A.L. New genetic loci implicated in fasting glucose homeostasis and their impact on type 2 diabetes risk. Nat. Genet. 2010;42:105–116. doi: 10.1038/ng.520. [DOI] [PMC free article] [PubMed] [Google Scholar]
- 41.Chapman J.M., Cooper J.D., Todd J.A., Clayton D.G. Detecting disease associations due to linkage disequilibrium using haplotype tags: a class of tests and the determinants of statistical power. Hum. Hered. 2003;56:18–31. doi: 10.1159/000073729. [DOI] [PubMed] [Google Scholar]
- 42.Spencer C.C., Su Z., Donnelly P., Marchini J. Designing genome-wide association studies: sample size, power, imputation, and the choice of genotyping chip. PLoS Genet. 2009;5:e1000477. doi: 10.1371/journal.pgen.1000477. [DOI] [PMC free article] [PubMed] [Google Scholar]
- 43.Benjamini Y., Yekutieli D. Quantitative trait Loci analysis using the false discovery rate. Genetics. 2005;171:783–790. doi: 10.1534/genetics.104.036699. [DOI] [PMC free article] [PubMed] [Google Scholar]
- 44.Genovese C.R., Roeder K., Wasserman L. False discovery rate control with p value weighting. Biometrika. 2006;93:509–524. [Google Scholar]
- 45.Hoggart C.J., Clark T.G., De Iorio M., Whittaker J.C., Balding D.J. Genome-wide significance for dense SNP and resequencing data. Genet. Epidemiol. 2008;32:179–185. doi: 10.1002/gepi.20292. [DOI] [PubMed] [Google Scholar]
- 46.Dudbridge F., Gusnanto A. Estimation of significance thresholds for genomewide association scans. Genet. Epidemiol. 2008;32:227–234. doi: 10.1002/gepi.20297. [DOI] [PMC free article] [PubMed] [Google Scholar]
- 47.Pe'er I., Yelensky R., Altshuler D., Daly M.J. Estimation of the multiple testing burden for genomewide association studies of nearly all common variants. Genet. Epidemiol. 2008;32:381–385. doi: 10.1002/gepi.20303. [DOI] [PubMed] [Google Scholar]
- 48.Wellcome Trust Case Control Consortium Genome-wide association study of 14,000 cases of seven common diseases and 3,000 shared controls. Nature. 2007;447:661–678. doi: 10.1038/nature05911. [DOI] [PMC free article] [PubMed] [Google Scholar]
- 49.Wakefield J. Bayes factors for genome-wide association studies: comparison with P values. Genet. Epidemiol. 2008;33:79–86. doi: 10.1002/gepi.20359. [DOI] [PubMed] [Google Scholar]
Associated Data
This section collects any data citations, data availability statements, or supplementary materials included in this article.