

Abstract
Many popular methods for exploring gene-gene interactions, including the case-only approach, rely on the key assumption that physically distant loci are in linkage equilibrium in the underlying population. These methods utilize the presence of correlation between unlinked loci in a disease-enriched sample as evidence of interactions among the loci in the etiology of the disease. We use data from the CGEMS case-control genome-wide association study of breast cancer to demonstrate empirically that the case-only and related methods have the potential to create large-scale false positives because of the presence of population stratification (PS) that creates long-range linkage disequilibrium in the genome. We show that the bias can be removed by considering parametric and nonparametric methods that assume gene-gene independence between unlinked loci, not in the entire population, but only conditional on population substructure that can be uncovered based on the principal components of a suitably large panel of PS markers. Applications in the CGEMS study as well as simulated data show that the proposed methods are robust to the presence of population stratification and are yet much more powerful, relative to standard logistic regression methods that are also commonly used as robust alternatives to the case-only type methods.
Introduction
The completion of the Human Genome Project and rapid advancement of genotyping technologies have now given rise to much interest in genome-wide association studies (GWAS). Standard analysis of GWAS often explores disease-gene association one locus at a time. Although this approach has already led to the successful mapping of more than 400 novel susceptibility regions for various chronic diseases and quantitative traits, it is recognized that, in the future, researchers will need to explore gene-gene (G-G) interactions to obtain a more complete depiction of the genetic basis of these traits. In particular, studying interactions among genetic markers can lead to the discovery of new disease-associated loci, a better understanding of the biology of the existing susceptibility regions, and more accurate models for individual risk prediction.1
Case-control designs are now widely used for conducting association scans for complex diseases that are relatively rare, such as cancers and diabetes. Many popular methods2–7 for the analysis of case-control data assume that physically distant loci in the genome are in linkage equilibrium (LE) and thus that their genotypes are distributed independently of each other in the underlying population. These methods explore interactions among unlinked loci in the etiology of the disease by searching for evidence of correlation among them in the disease-enriched case-control sample. In particular, it has been noted that the interaction odds ratio between two markers on the risk of a disease can be estimated by the correlation odds ratio between the same markers in the cases alone.2,3 Moreover, such a case-only test of interaction can be far more powerful than the corresponding test for interaction that could be obtained from the classical prospective analysis of case-control data. Prospective logistic regression essentially requires contrasting the estimate of the correlation odds ratio between the markers in the cases with that in the controls. The case-only method constrains the correlation between the markers in the controls to be zero, its assumed value in the population assuming a rare disease, and thus gains efficiency by not incurring additional variability because of the estimation of the additional correlation parameter among the controls.
In this article, we study the impact of population stratification (PS) in the case-only and related retrospective analysis methods for exploring gene-gene interactions in large-scale association studies. In the presence of a hidden ethnic substructure, it is likely that there will exist groups of loci across the genome for which the frequencies of the variants covary along the strata, causing those variants to be in linkage disequilibrium (LD) in the population as a whole. Thus, in such a setting, the case-only type methods could falsely detect the LD or correlation between two unlinked markers as evidence of interaction between the markers on the risk of the disease. The nature of such bias that could arise due to PS in the case-only type methods is quite different from the confounding bias that has been widely studied in the context of case-control studies of genetic main effects. Confounding bias can arise only if both gene frequencies and disease rates vary in the same direction across the underlying ethnic strata. In contrast, the bias in the case-only type methods resulting from the violation of the gene-gene independence assumption could arise merely because of the existence of underlying strata by which the frequencies of certain genes covary.
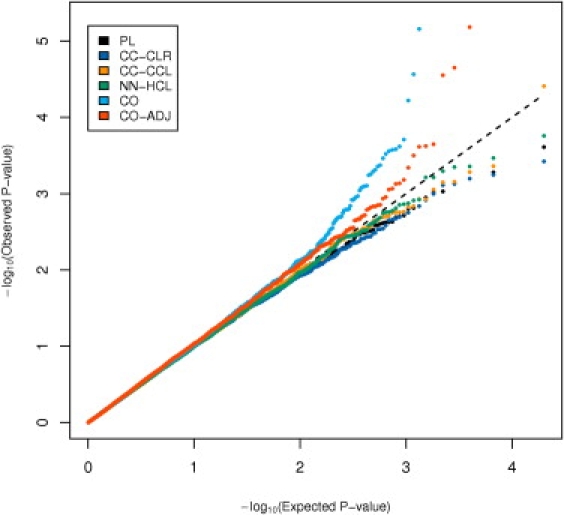
In Figure 1, we use data from the CGEMS study8,9 of breast cancer to display a q-q plot for alternative tests for interactions between a SNP (rs2322659) in LCT, a gene region in Chr 2 that is well known to be under the effect of population stratification,10,11 and 472,786 SNPs from 21 other chromosomes. It can be noted that the case-only method (light blue dots) produces a highly excess number of smaller p values than expected by chance (diagonal line) or that produced by the more robust case-control comparison based on the standard logistic regression analysis (black dots). Given that it is very unlikely that the LCT gene has any relationship with the risk of breast cancer, by itself or by interaction with other SNPs in the genome, it is fairly evident that the case-only method has a severe bias resulting from the presence of many loci across the genome that are correlated with the LCT locus simply because of the existence of hidden population stratification. We believe that such a problem could be ubiquitous in any large-scale exploration of interactions, where it is easy to come across pairs or larger groups of unlinked markers, the frequencies of which covary across the underlying strata.
Figure 1.

Genome-wide Scan for Interactions in CGEMS Breast Cancer Data
q-q plots of (− log10 transformed) p values for tests of gene-gene interaction between rs2322659 in LCT gene (chr 2) and 472786 SNPs from remaining 21 autosomes. The five different methods implemented are PL (black line), the standard prospective logistic regression method (adjusted for significant PCs); CO (light blue line), the standard case-only method; CO-ADJ (red line), proposed adjusted case-only method; CC-CLR (dark blue line), standard conditional logistic regression with case-control matching; CC-CCL (orange line), proposed constrained conditional logistic method with case-control matching; and NN-HCL (green line), proposed hybrid conditional logistic method with nearest-neighbor matching. Genomic control inflation factor (IF) is shown for each analysis.
Principal component analysis (PCA) of genome-wide panels of PS markers12 has become a widely popular method for examining evidence of population stratification in association studies. PCA is a general statistical method for transforming a vector of covariates into orthogonal axes, known as the principal components (PCs), sorted in descending order according to their contribution to the total variation of the original covariates. It has been noted that the overdispersion or excess variance of the first principal component of a genome-wide panel of markers can be used to detect evidence of any substructure in a population. Moreover, one could test for the overdispersion of other top-ranked PCs to detect the presence of any additional significant axes of population stratification. For analysis of GWAS, it has now become fairly routine to use regression models to adjust for significant principal components of genetic variation and hence avoid possible confounding bias that could arise resulting from differences in population structure between the cases and the controls. Further, some recent reports13,14 have proposed tight matching of the cases and the controls based on the PS markers and then performing conditional logistic regression analysis of the resulting matched data so that the gene frequencies between the cases and controls are compared only within the homogeneous matched sets.
In this article, we demonstrate that PCA has a novel and powerful role in the exploration of gene-gene interactions in case-control studies. In particular, we show that PCA can be used to remove the bias in the case-only and other related methods resulting from PS in such a way that the methods can still retain major power advantages over standard logistic regression methods. We assume that physically distant markers are in linkage equilibrium, not in the whole population, but only within the underlying ethnic strata that could potentially be detected by the principal components of PS markers. We consider a parametric, principal component adjusted, case-only analysis that assumes that genotype frequencies for putative susceptibility loci vary across the underlying ethnic strata in a logistic-linear fashion in the directions of the significant PCs. We also consider nonparametric methods that do not require any modeling assumption for genotype frequencies but involve tightly matching subjects in case-control and case-only studies based on the significant PCs so that subjects within a matched set can be considered highly homogeneous in terms of their underlying ethnicity. For the analysis of different types of matched data sets, we propose alternative conditional likelihoods that can gain efficiency by utilizing genotype combinations associated with various “pseudo-controls” that can be generated under the conditional G-G independence assumption. All of the methods are computationally simple and can be scaled up for large-scale exploration of interactions.
We study the performance of these methods in empirical settings. We demonstrate how the proposed methods perform in the setting of Figure 1, where we noted severe bias in the case-only type methods. Moreover, we conducted extensive simulation studies imitating the population substructure of the CGEMS study and with alternative panels of PS markers to explore the type I error and power of the proposed methods under a variety of scenarios. We also conducted theoretical relative efficiency calculations to demonstrate the potential sample size reduction that can be achieved by these novel methods, compared with standard logistic regression. These studies suggest that the proposed methods indeed could be very robust and powerful for exploration of G-G interactions in case-control and case-only studies.
Material and Methods
Model and Assumptions
Suppose we are interested in testing for interaction between the genotypes at two physically unlinked SNP loci, say, numerically coded by G and H, on the risk of a binary disease outcome D, with a population logistic regression model of the form
| (1) |
where L(x) = {1 + exp(-x)}−1 denotes the logistic distribution function, P indexes the underlying ethnic subpopulation in which a subject belongs, and m(•) is a known but arbitrary function that specifies the odds ratio of the disease associated with the joint genotype status (G, H) in terms of a set of parameters β. Model (1) allows the population-specific intercept parameter αP to account for potential heterogeneity in disease risk between underlying subpopulations. Model (1) also allows the joint log odds ratio (log-relative-risk assuming rare disease) function m(G,H,β) to be of a very general form, so that it can include many different kinds of interaction models, including standard multiplicative and additive forms. We assume that the two loci are in linkage equilibrium in each subpopulation P but that they can be in LD in the overall population if the genotype frequencies for both the loci vary across the underlying subpopulations. Mathematically speaking, we simply assume that pr(G, H | P) = pr(G | P)pr(H | P). We note that the assumption of gene-gene independence within ethnically homogenous subpopulations is much weaker than the same assumption for the whole population.
Parametric Method
As a parametric method, we consider a case-only analysis of association between G and H after adjustments for principal components of PS markers via a trichotomous logistic regression model of the form
| (2) |
where g, h = 0, 1, 2 correspond to the three ordered levels for SNP-genotype data, α0 = 0, PCk, k = 1, …, K denote a set of significant PCs that capture directions of PS for the underlying population and γk, k = 1, …, K denote associated regression coefficients that measure association between genotype frequencies and the PC directions. We show in Appendix A that the parameter θ in the model (2) can be interpreted as an odds-ratio interaction coefficient under a standard logistic regression model for disease risk of the form
| (3) |
Thus, model (2) can be used not only to perform a case-only test for interaction, but also to obtain parameter estimates for odds-ratio interaction coefficients. We refer to this method as CO-ADJ. The standard unadjusted case-only method (CO) was also implemented with model (2) without the adjustment for principal components.
Nonparametric Methods Based on Genetic Matching
The parametric case-only method described above requires the assumption that genotype frequencies at putative susceptibility loci vary across the underlying subpopulations in a logistic-linear fashion as a function of the underlying principal components. To avoid potential bias from the misspecification of such models, we also consider a number of nonparametric methods based on genetic matching. Suppose a case-control study has recruited N diseased and N healthy subjects with possibly heterogeneous ethnic backgrounds. Our main idea here is to use genetic matching algorithms that use a large panel of null genetic markers to find groups of subjects in a study, each with a very similar ethnic background (P), so that the assumption of LE between unlinked genes is reasonable within each such homogeneous group. We use a slightly modified version of the recently proposed GEM algorithm13 for matching pairs of subjects based on genetic distance constructed from the major principal components of the PS markers. We consider three matching strategies; two are applicable for case-control studies and one for case-only studies. In case-control (CC) matching, we match each case to the nearest control in terms of genetic distance. In nearest-neighbor (NN) matching, we find pairs of subjects who are genetically closest to each other, without regard to their disease status. Thus, under NN matching, matched pairs could be genetically closer than they are in CC matching. Finally, if only cases are available in a study, then we consider case-only (CO) matching that involves NN matching among pairs of cases.
In the following, we describe various conditional likelihoods that could be used to analyze data with the different matching strategies described above. Each conditional likelihood allows matched pairs of subjects to be analyzed under the assumption of LE or gene-gene independence between physically distant loci after properly accounting for the case-control sampling and the associated matching strategies. Each type of conditional likelihood is also “model free” in the sense that it does not require any modeling assumption about the distribution of allele frequencies for the putative causal loci across the underlying subpopulations.
Case-Control Matching
Suppose there are N matched case-control pairs. For the i-th such pair, let (Di0, Di1) denote the disease status and (Gi0, Hi0) and (Gi1, Hi1) denote the genotype status at the pair of loci for the control and case, respectively. Data for matched case-control pairs can be analyzed with the widely used conditional logistic regression (CLR),15 with the associated likelihood given by
| (4) |
In (4), for each matched set i, the conditional likelihood is formed based on the probability of the observed disease configuration for the members of the matched set, conditional on their joint genotype information at the two loci and the ascertainment event that Di1 + Di0 = 1 by design. It is noteworthy that LCC–CLR is free of the population-specific intercept parameters aP and therefore does not require any modeling assumption about possible mechanisms of heterogeneity in disease risk between subpopulations. Moreover, similar to standard prospective logistic regression, the likelihood in formula (4) is constructed based on probabilities that condition on all the genotype information in a matched set and therefore is free of any assumption about the joint genotype distribution in the underlying population. As a result, this method cannot exploit the gene-gene independence assumption when it is reasonable to do so.
For family-based case-control studies, a modification of the standard conditional logistic regression was proposed previously16 to extract additional power for a gene-environment (G-E) interaction test from the G-E independence assumption by conditioning on “sets” of observed genotypes within families instead of the individual genotypes of the members. We consider applying the same strategy here for mapping G-G interactions with a case-control sample, where the subjects matched by PS markers serve as a “family” with similar genetic background. For the i-th matched pair of subjects, if we let be the set of observed genotypes at locus G without regard to any link with the case-control status of the subjects, then the alternative “constrained conditional likelihood” (CCL) can be defined as
| (5) |
where the main difference from the standard conditional likelihood is that conditioning has been performed with respect to the set genotype as opposed to individual genotype (Gi1, Gi0). As shown in the second line of the formula, under a rare-disease approximation, the likelihood is equivalent to that for a standard CLR with 1:3 matching, where the two pseudo-controls are created by swapping the genotypes of the case and the control at one of the loci; under the G-G independence assumption, such “pseudo” controls are as likely to appear in a matched set as the observed subjects in the same set.
Nearest-Neighbor Matching
For the nearest-neighbor matched pair analysis, let (Di1, Di2), (Gi1, Gi2), and (Hi1, Hi2) denote the disease status, genotype at locus G, and genotype at locus H for the two subjects in the i-th matched pair. Unlike case-control matching, where, by design, there is exactly one case and one control in a matched pair, under NN matching there could be two cases, two controls, or one case and one control within different matched pairs. We propose use of the “hybrid conditional likelihood” (HCL)
where the notation P∗ corresponds to the probability distribution under the original case-control design (before matching), in which exactly N cases and N controls were sampled by design. With some algebra (see Appendix B), LNN–HCL can be rewritten in the form
| (6) |
where αP∗ = αP + κ is a shifted intercept parameter that reflects that under case-control design the sample is more enriched by cases compared to the population. Similar to LCC–CCL, the derivation of LNN–HCL exploits the “weak” assumption that unlinked loci are independent within genetically homogeneous matched sets in the underlying population. Unlike LCC–CCL and LCC–CLR, however, it depends on the population-specific baseline disease risk parameter . We specify based on regression modeling of disease risk as a function of the major principal components, a technique that is now commonly used for adjustment of confounding bias in unmatched case-control studies.12 An advantage of such parametric modeling of the baseline risks in LNN–HCL is that it allows borrowing some information across matched pairs that is lost in LCC–CLR and LCC–CCL because of the additional conditioning on the number of disease subjects in each matched set. Any efficiency gain, however, comes with the risk of confounding bias because of residual heterogeneity in disease risk that is not captured by the regression approach. For studies of main effects, the use of principal components in a regression model has often been reported to be adequate for adjustment of confounding bias. Later, we will explore this issue of bias versus efficiency for studies of interaction through in-depth simulations.
Case-Case Matching
If only cases are available in a study, then we consider matching pairs of cases by the NN method and analyzing the resulting matched data with the “case-only constrained conditional likelihood”
The conditioning event in LCO–CLR is similar to that in LCC–CCL and LNN–HCL except that it now includes (Di1 = 1, Di2 = 1) to reflect the case-only design. The above likelihood can be simplified (see Appendix C) as
| (7) |
Note that, like LCLR and LCC–CCL, LCO–CLR does not involve the population-specific risk parameter αP and hence is free of any model assumption about risk heterogeneity in the underlying subpopulations.
Asymptotic Relative Efficiency
When there is no bias because of PS, we analytically evaluated the asymptotic relative efficiencies (AREs) of the different methods as a ratio of the corresponding asymptotic variances, obtained from the inverse information matrices, for the interaction parameter of interest. The ARE is defined as the ratio of the noncentrality parameters of two tests and can be interpreted as the inverse ratio of sample sizes that give the same power for the two tests at any fixed significance level. For example, if method A has an ARE of two with respect to method B, it can be concluded that method A gives comparable power to method B with only half the sample size.
Simulation Scheme
We evaluated the performance of the proposed methods by using simulations that mimic the population stratification structure observed in the CGEMS study. We used two mutually uncorrelated panels (low LD within and between panels) of 12,821 and 7,017 SNPs, respectively, that have been previously shown to be adequate PS markers17 for the CGEMS study. We defined a total of up to 3 × 3 × 3 × 3 = 81 population strata based on the tertiles of the four most significant principal components of the 12K panel. The stratum-specific allele frequencies for the PS markers, for both the original 12K panel and the independent 7K panel, were recorded from the CGEMS study and were used to generate the genotypes for the PS markers in the simulation studies.
In our simulation, we assumed that each of the 81 strata is equally likely in the underlying population and that within each such stratum, the PS markers are independent of each other, the disease end-point, and the putative causal loci. For the general population, we assumed a logistic regression model of the form
| (8) |
where S indexes the underlying population strata and G1 and G2 denote the genotype status for each of the two putative causal loci. We assumed that the alleles within each locus act on the risk of the disease in an additive fashion (on the logistic scale) and thus coded each of G1 and G2 as the number of minor alleles carried by an individual in the respective locus. The stratum-specific baseline disease risk αS and common allele frequency pS of the two causal SNPs were preassigned in different ways to generate for the following three scenarios.
No stratification: Both pS and αS were held constant across strata. In this setting, no bias is expected, resulting from either confounding induced by risk stratification or allele frequency stratification.
Uncorrelated stratification: pS varied across the 81 strata in such a way that it was monotonically increasing, but in a highly nonlinear fashion, along the tertiles of each PC direction. αS varied randomly independent of PC directions (for details, see Table S1 available online). To give an idea about the extent of stratification generated, the Fst of the causal SNPs was 0.024 and the overall Fst of the 12K PS SNPs was 0.020. In this setting, we expect potential bias could arise due to gene-gene dependence but not due to confounding, because the directions of variations for allele frequencies and disease risks were orthogonal.
Correlated stratification: Both αS and pS varied across the 81 strata in such a way that they were both monotonically increasing along the tertiles of each PC direction (see Table S1). In this setting, bias could arise because of both confounding and gene-gene dependence.
In our simulations, we generated the underlying stratum indicators (S), the genotypes for PS markers (M), and the genotypes for the putative susceptibility loci (G) conditional on the case-control status of the subjects in a manner that was consistent with the population models described above (see Appendix D for details). During the analysis of each simulated data set, we assumed that only M was observed, but not S.
We analyzed each simulated data set with two existing methods: (1) the standard case-only (CO) method without adjustment for PCs and (2) the standard prospective logistic (PL) regression method. The CO method2,3 assumes gene-gene independence in the entire population and hence in the controls for a rare disease, whereas the PL method allows the joint distribution of the genotypes to remain completely unconstrained.18,19 In addition, each simulated data set was analyzed with the standard CC-CLR method and with the proposed methods CO-ADJ, CC-CCL, and NN-HCL.
Results
Analysis of CGEMS Study
We illustrate an application of the proposed methods by using the first-stage data from the CGEMS multistage GWAS of breast cancer.8,9 The study consisted of 1042 cases and 1045 controls, all white women, sampled from the Nurses' Health Cohort Study. To account for PS, we used a panel of 12,821 SNPs (also used in our simulations) that have been shown previously17 to be informative for PS detection in the CGEMS study. The GEM algorithm (without outlier removal steps) identified four significant axes of genetic variation (see Figure 2). These principal components were used to construct genetic distances and to obtain the case-control and nearest-neighbor matches, required for the methods CC-CLR, CC-CCL, and NN-HCL. Figure 1 shows q-q plots of the interaction p values between rs2322659 in LCT, a gene in Chr 2 known to be under the effect of PS in populations of European descent, and 472,786 SNPs from the remaining 21 autosomes, via the two standard methods PL and CO as well as the proposed methods. The CO method, which assumes G-G independence for the entire population, showed a large shift (inflation factor = 1.39) from the diagonal line that corresponds to the distribution of p values expected by chance. The corresponding plots for PL and CC-CLR, both of which allow for unconstrained joint genotype distribution, were well aligned to the diagonal line, suggesting that these methods were not susceptible to any large-scale inflation of type I error resulting from PS bias. CC-CCL and NN-HCL, both of which make use of the G-G independence assumption within matched sets, also showed similar behavior, indicating that these methods were also robust to the PS bias that is seen for the CO method. The parametric CO-ADJ method, which adjusted for the four significant PCs, showed slight inflation of type I error near the tail. However, the overall inflation factor was close to 1 and it is possible that the subtle inflation in the tail was due to random fluctuations.
Figure 2.

Principal Components in CGEMS Breast Cancer Data
Pairwise scatter plots of the first four principal axes of genetic variation (labeled PC1, PC2, PC3, and PC4) in the CGEMS breast cancer data.
Asymptotic Relative Efficiency
Figure 3 shows the theoretical AREs of the different methods for the odds-ratio interaction (θ) between a pair of susceptibility SNPs as a function of the minor allele frequencies (MAFs) and the main effect odds ratios for those SNPs. Here, the widely used PL method was used as a common reference for all of the ARE evaluations. We observe that if there were no bias due to PS, then the CO method would be the most powerful of all the methods; its ARE is always above 2, indicating that this method could reach the same or higher power compared with prospective logistic regression with only half the sample size. The strategy of 1:1 case-control matching and standard CLR analysis of the resulting matched data was the least powerful of all the methods considered. The method, however, lost only modest power compared with standard prospective logistic regression (PL) analysis, indicating that the loss of efficiency because of individual matching is generally not large.
Figure 3.
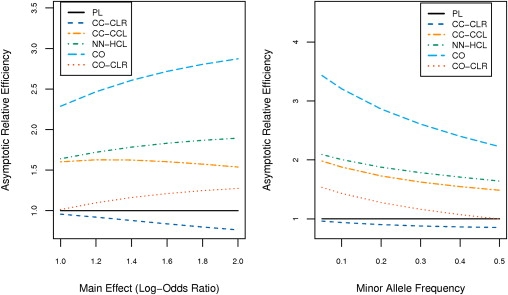
Asymptotic Relative Efficiency of Alternative Methods in the Absence of Population Stratification
All AREs are evaluated in reference to standard prospective logistic regression (PL). The AREs are shown for PL (black line), CO (light blue line), CC-CLR (dark blue line), CC-CCL (orange line), NN-HCL (green line), and CO-CLR (red line). Left panel plots ARE as a function of the common main effect (β1 = β2 = β) of the two causal SNPs (fixing the common MAF at 0.3). Right panel plots ARE as a function of the common MAF (fixing the common main effect odds ratio at 1.4).
We observe that although the constrained methods CC-CCL and NN-HCL suffer significant loss of power compared with the CO method that relies on a much stronger gene-gene independence assumption, they are substantially more powerful than the completely “unconstrained” PL and CC-CLR methods; the ARE always remained 1.5 or higher, indicating that these methods can achieve the same power as the unconstrained methods with a 50% smaller sample size. The NN-HCL method was able to gain modest power over CC-CCL by allowing for comparisons between matched pairs. The CO-CLR method, although less efficient than the other proposed methods, provided modest efficiency gain over the unconstrained methods PL and CC-CLR.
Simulation Studies
Table 1 shows the type I error of different methods at α = 0.01 for detecting odds ratio interaction between a given pair of null SNPs over 10,000 simulated data sets, each consisting of 500 cases and 500 controls. Under “no stratification,” all of the methods produced type I error close to the nominal significance level. Under “uncorrelated” population stratification, the CO method produced severe inflation of type I error because of the violation of the underlying gene-gene independence constraint. The parametric CO-ADJ method also substantially reduced the bias of CO but had substantial inflation of type I error, especially when the 7K panel of markers was used. The proposed matching-based methods, CC-CCL and NN-HCL, reduced the bias dramatically producing type I error much closer to the nominal significance level. When matching was performed based on the 7K panel of markers, the type I errors of the methods increased because of imperfect matching, but still remained much lower than those of the CO and CO-ADJ methods. Moreover, in this setting, the NN-HCL method produced substantially smaller type I error than that of CC-CCL. When we simulated “correlated stratification,” we observed a relatively subtle effect of “confounding” bias in all the methods.
Table 1.
Type I Error
| PL | CO | CO-ADJ | CC-CLR | CC-CCL | NN-HCL | |
|---|---|---|---|---|---|---|
| PCA with 12,821 SNPs | ||||||
| No stratification | 0.013 | 0.010 | 0.012 | 0.011 | 0.008 | 0.010 |
| Uncorrelated stratification | 0.011 | 0.095 | 0.018 | 0.010 | 0.013 | 0.011 |
| Correlated stratification | 0.012 | 0.112 | 0.017 | 0.010 | 0.013 | 0.009 |
| PCA with 7,017 SNPs | ||||||
| No stratification | 0.010 | 0.009 | 0.010 | 0.010 | 0.009 | 0.010 |
| Uncorrelated stratification | 0.010 | 0.095 | 0.060 | 0.010 | 0.020 | 0.017 |
| Correlated stratification | 0.008 | 0.109 | 0.052 | 0.008 | 0.021 | 0.013 |
Simulated type I error at a nominal significance level of 0.01. Three scenarios are considered depending on the nature of stratification of disease risk and allele frequencies and their correlation. Two sets of PS markers are considered: PCA and matching are based on the original 12K SNPs that were used to generate stratification, and PCA and matching are based on a 7K SNP panel uncorrelated with the original 12K panel. The five methods compared are the standard prospective logistic regression method (PL), the standard case-only method (CO), proposed adjusted case-only method (CO-ADJ), standard conditional logistic regression (CC-CLR), proposed constrained conditional likelihood (CC-CCL), and the proposed hybrid conditional likelihood (NN-HCL).
In Figure 4, we show the q-q plots for 10,000 pairs of null SNPs where different pairs are assumed to be under the effect of different types of stratification. Overall, we assumed that 96% of the SNP pairs were not under any population stratification. Further, we assumed that out of the remaining 4% pairs, an equal number of pairs (i.e., 1%) had randomly generated allele frequencies that were increasing along one of the four principal axes of variation. Moreover, we specified the disease risk to increase along the tertiles of the first axis. This scenario is more realistic for large-scale exploration of gene-gene interactions where, for a large number of loci, the effect of population stratification may be negligible and different subsets of the remaining SNPs may have strong stratification along different axes of variation, such as the north-south and east-west gradients for a white population with a European origin.
Figure 4.
q-q Plot for Interactions among Simulated Null SNPs
q-q plot of interaction p values for 10,000 pairs of simulated null SNPs where 96% of the pairs have constant allele frequencies across strata and 1% of the pairs have SNP frequencies covarying along each of the four possible axes of variation. The disease risk also varies along the first axis. See Figure 1 legend for details about the methods compared.
Interestingly, we observe that even with a small fraction of SNPs under nonnegligible population stratification, the CO method produced a serious distortion of the q-q plot from its expected null distribution. The CO-ADJ method also showed significant inflation toward its tail, presumably for those pairs of markers for which the allele frequencies increased in a nonlinear fashion (in the logistic scale) along the tertiles. The other proposed methods, even with imperfect matching based on the 7K panel of markers, produced q-q plots that indicated similar expected and observed numbers of false discoveries across a wide range of significance levels.
In Figure 5, we show the simulation-based power curves for detecting the odds ratio interactions between a pair of susceptibility SNPs at a significance level of α = 0.01 over 1000 simulated data sets, each consisting of 500 cases and 500 controls. These results correspond well with the theoretical ARE results shown in Figure 3. In particular, both the CC-CCL and NN-HCL methods showed a significant power advantage over the unconstrained PL and CC-CLR methods, irrespective of whether or not the pair of SNPs under study were under the effect of population stratification. Unlike the theoretical ARE plot, however, here we observed that CC-CCL can be slightly more powerful than NN-HCL in some instances. The power of CO-ADJ was considerably lower than CO, possibly because of adjustment for a large number of significant PCs that were often detected on different simulated data sets. Overall, the CO and CO-ADJ methods clearly had the highest power among all the methods, but as seen from Table 1 and Figures 1 and 4, they can also produce an unacceptably high number of false positives in the presence of complex population stratification.
Figure 5.

Simulation-Based Estimate of Power
Simulation-based estimates of power for detecting interaction between a pair of susceptibility SNPs with 500 cases and 500 controls at a significance level of 0.01. Three scenarios are considered depending on how the allele frequencies of the causal SNPs and the disease risk vary along the underlying strata. The same panel of 12K PS markers are used for both simulation and data analysis. See Figure 1 legend for details about the methods compared.
Discussion
In this article, we have proposed several alternative methods for exploring gene-gene interactions between unlinked regions in case-control studies. These methods can gain major power by exploiting gene-gene independence in the underlying population in a robust manner so that false positives can be avoided in the presence of long-range linkage disequilibrium in the genome that could arise because of the presence of population stratification. The key principle is to assume gene-gene independence conditional on population substructure that could be detected based on panels of population stratification markers. We used data from the CGEMS genome-wide association study and closely related simulations to demonstrate some advantages of the proposed methods compared with some widely used existing methods that either are completely “unconstrained” with regard to the joint genotype distribution or invoke the very strong assumption of gene-gene independence in the entire population.
We consider both parametric and nonparametric methods for exploiting the conditional gene-gene independence assumption. Our simulation results suggested that although the parametric case-only method can be substantially more powerful than the nonparametric conditional-likelihood-based methods, it can potentially suffer from significant residual bias when the underlying assumption about the parametric relationship between genotype frequencies for certain putative susceptibility loci and the principal components of PS directions is not correct. In the application involving CGEMS study, however, both parametric and nonparametric methods performed very well in removing the excess of low p values that were seen for the unadjusted case-only method.
The control of type I error in the proposed matching-based methods depends on how well subjects can be matched based on their genetic backgrounds, so that the chance of any residual population stratification within matched sets can be minimized. Both the choice of the PS marker panel and that of the matching algorithm are important in this regard. We observe that in our simulation study, where the principal components for a panel of 12K markers in the CGEMS study were used to generate the population stratification structure, the type I error of these methods achieved exact nominal level when we the used the same 12K markers for matching the subjects in the simulated data sets. The results were encouraging because even with the original 12K set of markers, matching could not be expected to be perfect because of sampling variation. When an independent panel of 7K markers was used, however, we observed an inflation in the type I error for all of the proposed methods. In this setting, the NN-HCL method produced a substantially smaller bias than did CC-CCL, indicating that the NN method produced better matching of subjects in terms of their genetic background than the did case-control matching. Although arguably the amount of stratification we simulated in the setting of Table 1 involving a total of 81 distinct strata is fairly extreme, these simulations demonstrate that a rich panel of informative PS markers and efficient matching algorithms are important for the application of the proposed methods. Apart from better PCA-based matching algorithms, other clustering approaches such as Spectral GEM20 could also be explored in the future.
In this article, we also proposed a conditional likelihood for robust gene-gene interaction analysis with only a sample of cases. Our ARE calculations, however, demonstrated that if both cases and well-matched controls are available in a study, then one could be much more efficient analyzing both the cases and the controls with either the CC-CCL or NN-HCL methods compared with a case-only analysis with the CO-CLR method. The proposed CO-CLR method can be valuable when only a sample of cases is available in a study or even if a sample of controls is available, but it is suspected that it may not be from the same source population from which the cases were drawn.
An advantage of the NN-HCL and CC-CCL methods is that they allow estimation of all of the parameters, including but not limited to interactions, that are required to describe the full joint effect of a pair of loci on the risk of a disease. Consequently, these methods can be used not only to test for certain forms of interactions but also to perform various types of joint and conditional tests of associations that previous studies have suggested in order to search for novel susceptibility loci in the presence of potential interactions.21–25 In addition, availability of the estimates for the full joint effect leads to a better interpretation of any significant interaction finding and eventual incorporation of the results for risk modeling. In principle, the parametric case-only method we considered can also be extended for estimation of all of the parameters of a logistic model via a general constrained maximum likelihood framework26 that can incorporate data from both cases and controls.
So far we have assumed 1:1 matching, but the principal components can also be used for more general m:n matching, and the proposed conditional likelihoods can be modified to account for such grouped matching. We expect that as matching gets cruder, both the precision and PS bias of CC-CCL and NN-HCL will increase and eventually will achieve those of the CO methods, because in limit, the gene-gene independence assumption within matched sets will be the same as that for the entire population. Thus, although a cruder matching can be considered for increasing efficiency of the methods, one needs to ensure that a certain level of homogeneity is achieved within each matched set to avoid a potential increase in bias.
The proposed methods can also be generalized for studying interactions involving more than two genetic loci. One can partition multiple loci into independent “bins” and then use suitable conditional likelihoods to generate pseudo-controls by swapping genes, held together within each bin but independently between bins, among subjects in matched sets. The gain in efficiency from the gene-gene independence assumption can be expected to increase with the order of the interactions because, as the number of loci increases, the number of subjects in cells of crossing genotypes decreases and empirical estimation of the unconstrained multivariate genotype distribution becomes more imprecise. The strategy could be applied to gain efficiency in a variety of data mining methods27–29 that have been proposed for exploring gene-gene interaction in high dimensions.
The proposed methods have applications for gene-environment interaction analysis, where the use of the gene-environment independence assumption and application of the case-only type methods have also been advocated to achieve gain in power. The assumption of G-E independence can be violated in the presence of population stratification for many environmental exposures, such as height, body mass index, diet, and sunlight exposures, the distribution of which can have geographic variation in directions that are also related to genetic variations. In such settings, the proposed methods can provide powerful tools for exploring gene-environment interactions by exploiting a “weak” gene-environment independence assumption that is required to hold only within homogenous groups of subjects with similar population backgrounds.
The methods proposed here as well as other related methods for G-G and G-E interaction studies have been implemented in a user-friendly R package CaseControl.Genetics.
Acknowledgments
The authors would like to acknowledge Dr. Jay Sethuraman for helpful discussions on matching algorithms and Dr. B.J. Stone for proof reading and editing the manuscript. The research of S.B., J.C., K.Y., S.C., and N.C. was supported by the National Cancer Institute Intramural Program and a Gene-Environment Initiative (GEI) grant from the National Heart, Lung, and Blood Institute. The research of P.K. was supported by NIH P01 CA87969. We would also like to thank three anonymous reviewers for their helpful comments to improve the manuscript. This study utilized the high-performance computational capabilities of the StatPro Linux cluster at the National Cancer Institute and the Biowulf Linux cluster at the National Institutes of Health, Bethesda, MD.
Appendix A
Derivation of Parametric Model for Case-Only Analysis
Suppose, we assume that the variation in genotype frequencies for putative susceptibility loci G across the underlying subpopulations (P) can be described by a trichotomous logistic model of the form
| (9) |
where g = 0, 1, 2 correspond to the three ordered levels of SNP-genotype data, α0 = 0, PCk, k = 1, …, K denote a set of significant PCs that capture directions of PS for the underlying population, and γk, k = 1, …, K denote associated regression coefficients that measure association between genotype frequencies and the PC directions. Assuming rare disease, conditional independence of G and H given P, and models (9) and (3), it is easy to show that
| (10) |
the proposed parametric model for case-only analysis.
Appendix B
Derivation of the Hybrid Conditional Likelihood
The hybrid likelihood for a matched pair of subjects in stratum S = s can be written as
Now, under the assumption of independence of G and H given S = s, following Lemma 2 of the previous report,26 we can write
| (11) |
where μD = (nD/N)/Pr(D) for D = 0,1 are constant terms that denote the rate at which the cases and controls have been sampled from the respective populations. In formula (11), P∗(D, G | H, S) can be interpreted as the prospective probability of observing D and G given H and S under a population-based case-control design that sample cases and controls with selection probabilities proportional to μ1 and μ0, respectively. By noting that under the assumption of rare disease, we can write
and that under the assumption of homogeneity of subjects within strata we have
the formula for the hybrid conditional likelihood can be derived in the form of Equation (6), with κ = log(μ1/μ0) and
Appendix C
Derivation of the Case-Only Conditional Likelihood
With notation similar to that in Appendix A, LCO–CLR can be simplified as
The required expression follows by using the approximation Pr(Dj = 1|Gj, Hj, S = s) ≈exp [(αs + m(Gj, Hj;β)] and noting that the terms involving αs cancel out. In particular, when m(G, H;β) is an additive linear function of the form β1G + β2H + θGH, the terms involving the main effects also cancel out, giving the one-parameter CLR likelihood
Thus LCO–CLR simply captures the correlation of (G,H) within matched case-pairs.
Appendix D
Simulation of a Case-Control Sample
We jointly generated S and G for the cases and controls from two separate multinomial distributions. The multinomial probabilities for the controls were specified according to the population model described in the “Simulation Scheme” section and those for the cases were obtained by multiplication of the multinomial probabilities of the controls by the odds of the disease associated with S and G, as specified by the assumed logistic model. Specifically, for each control, the triplet (G1, G2, S) of the two putative functional SNP genotypes and the unknown stratum membership (S) were simulated under the rare disease assumption with the formula:
where we have assumed that all L strata are equally likely and within each stratum the two SNPs are in linkage equilibrium. We obtain P(G1 | S = s) and P(G2 | S = s) assuming Hardy-Weinberg Equilibrium (HWE) with a MAF pS as prespecified for that stratum.
For each case, the triplet (G1, G2, S) was simulated with the formula:
where αs is the prespecified stratum baseline disease risk.
We assumed that the PS markers have no relationship with the disease, conditional on the population stratum. Hence, for each subject, given the simulated stratum number S, the genotypes of the PS marker panel were simulated from independent multinomial distributions assuming HWE with MAFs as estimated from the CGEMS data for that stratum. Once all the PS markers were simulated for all the 1000 subjects, the significant principal components (z1, z2…zk) were determined. The genetic distance matrix was constructed and subjects were matched via CC and NN matching strategies. Let denote the matched set to which a subject is assigned. The simulated vector for each subject was then used for computing the statistics.
Supplemental Data
Web Resources
The URLs for data presented herein are as follows:
Biowulf Linux cluster, http://biowulf.nih.gov
Catalog of published genome-wide association studies, http://www.genome.gov/gwastudies
R package CaseControl.Genetics, http://dceg.cancer.gov/about/staff-bios/chatterjee-nilanjan
References
- 1.Moore J.H., Williams S.M. Epistasis and its implications for personal genetics. Am. J. Hum. Genet. 2009;85:309–320. doi: 10.1016/j.ajhg.2009.08.006. [DOI] [PMC free article] [PubMed] [Google Scholar]
- 2.Piegorsch W.W., Weinberg C.R., Taylor J.A. Non-hierarchical logistic models and case-only designs for assessing susceptibility in population-based case-control studies. Stat. Med. 1994;13:153–162. doi: 10.1002/sim.4780130206. [DOI] [PubMed] [Google Scholar]
- 3.Khoury M.J., Flanders W.D. Nontraditional epidemiologic approaches in the analysis of gene-environment interaction: Case-control studies with no controls! Am. J. Epidemiol. 1996;144:207–213. doi: 10.1093/oxfordjournals.aje.a008915. [DOI] [PubMed] [Google Scholar]
- 4.Zhao J., Jin L., Xiong M. Test for interaction between two unlinked loci. Am. J. Hum. Genet. 2006;79:831–845. doi: 10.1086/508571. [DOI] [PMC free article] [PubMed] [Google Scholar]
- 5.Zhang Y., Liu J.S. Bayesian inference of epistatic interactions in case-control studies. Nat. Genet. 2007;39:1167–1173. doi: 10.1038/ng2110. [DOI] [PubMed] [Google Scholar]
- 6.Song M., Nicolae D.L. Restricted parameter space models for testing gene-gene interaction. Genet. Epidemiol. 2009;33:386–393. doi: 10.1002/gepi.20392. [DOI] [PMC free article] [PubMed] [Google Scholar]
- 7.Tang W., Wu X., Jiang R., Li Y. Epistatic module detection for case-control studies: A Bayesian model with a Gibbs sampling strategy. PLoS Genet. 2009;5:e1000464. doi: 10.1371/journal.pgen.1000464. [DOI] [PMC free article] [PubMed] [Google Scholar]
- 8.Hunter D.J., Kraft P., Jacobs K.B., Cox D.G., Yeager M., Hankinson S.E., Wacholder S., Wang Z., Welch R., Hutchinson A. A genome-wide association study identifies alleles in FGFR2 associated with risk of sporadic postmenopausal breast cancer. Nat. Genet. 2007;39:870–874. doi: 10.1038/ng2075. [DOI] [PMC free article] [PubMed] [Google Scholar]
- 9.Thomas G., Jacobs K.B., Kraft P., Yeager M., Wacholder S., Cox D.G., Hankinson S.E., Hutchinson A., Wang Z., Yu K. A multistage genome-wide association study in breast cancer identifies two new risk alleles at 1p11.2 and 14q24.1 (RAD51L1) Nat. Genet. 2009;41:579–584. doi: 10.1038/ng.353. [DOI] [PMC free article] [PubMed] [Google Scholar]
- 10.Epstein M.P., Allen A.S., Satten G.A. A simple and improved correction for population stratification in case-control studies. Am. J. Hum. Genet. 2007;80:921–930. doi: 10.1086/516842. [DOI] [PMC free article] [PubMed] [Google Scholar]
- 11.Gerbault P., Moret C., Currat M., Sanchez-Mazas A. Impact of selection and demography on the diffusion of lactase persistence. PLoS ONE. 2009;4:e6369. doi: 10.1371/journal.pone.0006369. [DOI] [PMC free article] [PubMed] [Google Scholar]
- 12.Price A.L., Patterson N.J., Plenge R.M., Weinblatt M.E., Shadick N.A., Reich D. Principal components analysis corrects for stratification in genome-wide association studies. Nat. Genet. 2006;38:904–909. doi: 10.1038/ng1847. [DOI] [PubMed] [Google Scholar]
- 13.Luca D., Ringquist S., Klei L., Lee A.B., Gieger C., Wichmann H.-E., Schreiber S., Krawczak M., Lu Y., Styche A. On the use of general control samples for genome-wide association studies: Genetic matching highlights causal variants. Am. J. Hum. Genet. 2008;82:453–463. doi: 10.1016/j.ajhg.2007.11.003. [DOI] [PMC free article] [PubMed] [Google Scholar]
- 14.Guan W., Liang L., Boehnke M., Abecasis G.R. Genotype-based matching to correct for population stratification in large-scale case-control genetic association studies. Genet. Epidemiol. 2009;33:508–517. doi: 10.1002/gepi.20403. [DOI] [PMC free article] [PubMed] [Google Scholar]
- 15.Breslow N.E., Day N.E. Conditional logistic regression for matched sets. In: Brown N.E., Day N.E., editors. Statistical Methods in Cancer Research. Volume I: The Analysis of Case-Control Studies. International Agency for Research on Cancer; Lyon: 1980. pp. 247–279. [Google Scholar]
- 16.Chatterjee N., Kalaylioglu Z., Carroll R.J. Exploiting gene-environment independence in family-based case-control studies: increased power for detecting associations, interactions and joint effects. Genet. Epidemiol. 2005;28:138–156. doi: 10.1002/gepi.20049. [DOI] [PubMed] [Google Scholar]
- 17.Yu K., Wang Z., Li Q., Wacholder S., Hunter D.J., Hoover R.N., Chanock S., Thomas G. Population substructure and control selection in genome-wide association studies. PLoS ONE. 2008;3:e2551. doi: 10.1371/journal.pone.0002551. [DOI] [PMC free article] [PubMed] [Google Scholar]
- 18.Prentice R.L., Pyke R. Logistic disease incidence models and case-control studies. Biometrika. 1979;66:403–411. [Google Scholar]
- 19.Hosmer D.W., Lemeshow S. Second Edition. John Wiley; New York: 2000. Applied Logistic Regression. [Google Scholar]
- 20.Lee A.B., Luca D., Klei L., Devlin B., Roeder K. Discovering genetic ancestry using spectral graph theory. Genet. Epidemiol. 2009;34:51–59. doi: 10.1002/gepi.20434. [DOI] [PMC free article] [PubMed] [Google Scholar]
- 21.Marchini J., Donnelly P., Cardon L.R. Genome-wide strategies for detecting multiple loci that influence complex diseases. Nat. Genet. 2005;37:413–417. doi: 10.1038/ng1537. [DOI] [PubMed] [Google Scholar]
- 22.Kraft P., Yen Y.-C., Stram D.O., Morrison J., Gauderman W.J. Exploiting gene-environment interaction to detect genetic associations. Hum. Hered. 2007;63:111–119. doi: 10.1159/000099183. [DOI] [PubMed] [Google Scholar]
- 23.Millstein J., Conti D.V., Gilliland F.D., Gauderman W.J. A testing framework for identifying susceptibility genes in the presence of epistasis. Am. J. Hum. Genet. 2006;78:15–27. doi: 10.1086/498850. [DOI] [PMC free article] [PubMed] [Google Scholar]
- 24.Chatterjee N., Kalaylioglu Z., Moslehi R., Peters U., Wacholder S. Powerful multilocus tests of genetic association in the presence of gene-gene and gene-environment interactions. Am. J. Hum. Genet. 2006;79:1002–1016. doi: 10.1086/509704. [DOI] [PMC free article] [PubMed] [Google Scholar]
- 25.Chapman J., Clayton D. Detecting association using epistatic information. Genet. Epidemiol. 2007;31:894–909. doi: 10.1002/gepi.20250. [DOI] [PubMed] [Google Scholar]
- 26.Chatterjee N., Carroll R.J. Semiparametric maximum likelihood estimation exploiting gene-environment independence in case-control studies. Biometrika. 2005;92:399–418. [Google Scholar]
- 27.Ritchie M.D., Hahn L.W., Roodi N., Bailey L.R., Dupont W.D., Parl F.F., Moore J.H. Multifactor-dimensionality reduction reveals high-order interactions among estrogen-metabolism genes in sporadic breast cancer. Am. J. Hum. Genet. 2001;69:138–147. doi: 10.1086/321276. [DOI] [PMC free article] [PubMed] [Google Scholar]
- 28.Kooperberg C., Ruczinski I. Identifying interacting SNPs using Monte Carlo logic regression. Genet. Epidemiol. 2005;28:157–170. doi: 10.1002/gepi.20042. [DOI] [PubMed] [Google Scholar]
- 29.Park M.Y., Hastie T. Penalized logistic regression for detecting gene interactions. Biostatistics. 2008;9:30–50. doi: 10.1093/biostatistics/kxm010. [DOI] [PubMed] [Google Scholar]
Associated Data
This section collects any data citations, data availability statements, or supplementary materials included in this article.