

Abstract
Gene by environment (GxE) interactions are clearly important in many human diseases, but they have proven to be difficult to study on a molecular level. We report genetic analysis of thousands of transcript abundance traits in human primary endothelial cell (EC) lines in response to proinflammatory oxidized phospholipids implicated in cardiovascular disease. Of the 59 most regulated transcripts, approximately one-third showed evidence of GxE interactions. The interactions resulted primarily from effects of distal-, trans-acting loci, but a striking example of a local-GxE interaction was also observed for FGD6. Some of the distal interactions were validated by siRNA knockdown experiments, including a locus involved in the regulation of multiple transcripts involved in the ER stress pathway. Our findings add to the understanding of the overall architecture of complex human traits and are consistent with the possibility that GxE interactions are responsible, in part, for the failure of association studies to more fully explain common disease variation.
Introduction
During the past few years, great progress has been made in understanding the overall genetic architecture of complex traits in human populations and the genetic control of gene expression.1 Genome-wide association (GWA) studies, in particular, have revealed hundreds of loci that contribute to many common diseases as well as other complex traits. These studies are poorly powered, however, to detect gene by gene (GxG) and gene by environment (GxE) interactions,2 which are likely to be important in common diseases such as heart disease,3 behavioral disorders,4,5 and cancer.6 In particular, such studies are limited to a small number of phenotypes and loci, and the underlying molecular details have generally not been examined. The importance of such interactions is evident in the commonly observed context-dependent effects of quantitative trait loci (QTL) in studies of experimental organisms (reviewed in Mackay et al.5). Thus, when QTL studies are performed in different environments, it has frequently been observed that different loci are observed or the magnitude of the QTL effects differ. Recently, more global analyses of GxE interactions have been studied with global expression traits in yeast7,8 and worms.9 Such studies revealed common GxE interactions in a variety of environmental conditions such as drug treatments, energy sources, and growth temperatures. Global expression studies of lymphoblastoid cell responses to radiation also suggested the importance of GxE interactions in human cells.10 Clearly, an understanding of GxE interactions in human populations will be important for studying common disease susceptibility and for influencing lifestyle decisions based on genetic variation. For example, widespread GxE interactions could very well account for the marginal effects of loci in GWA studies.5
Atherosclerosis, the primary cause of heart disease, is a disease in which both genetic and environmental factors play a major role. Among the important environmental factors in atherosclerosis are diet, smoking, exercise, and infectious agents, and there is evidence from candidate gene studies that some of these interact with genetic factors.3 Over the past two decades, it has become clear that atherosclerosis is an inflammatory disorder and that oxidized lipids present in low-density lipoproteins (LDLs) or dying cells trapped in the vessel wall contribute to this inflammation.11 Oxidized lipids induce the overlying endothelial cells (ECs) to express adhesion molecules and cytokines that promote the recruitment of monocytes and lymphocytes to the vessel wall.12 However, the mechanisms underlying the wide responses caused by oxidized lipids remain poorly understood.
To better understand the mechanisms underlying vascular inflammation, and the nature of genetic variations contributing to disease susceptibility, we performed a systems genetics analysis of EC responses to oxidized phospholipids. We utilized a population of primary early passage human aortic endothelial cell (HAEC) cultures from 96 unrelated heart transplant donors. The donors in this study were anonymous and so ethnicity was unknown. The cells were treated with the oxidized phospholipid species, oxidized 1-palmitoyl-2-arachidonoyl-sn-glycero-3-phosphatidylcholine (Ox-PAPC), a component of oxidized LDL found in atherosclerotic lesions of animal models and humans.12 Ox-PAPC is known to promote vascular inflammation and robust gene regulation of over 1000 transcripts in this cell type.13 We then performed global expression array analyses on our population of HAECs both with and without Ox-PAPC treatment. In addition, we typed each of the cultures for approximately one million common single nucleotide polymorphisms (SNPs) using high-density SNP arrays. Genome-wide association (GWA) analysis of the data revealed thousands of loci controlling transcript levels, which we term expression quantitative trait loci (eQTL). Among these were many loci controlling responses to Ox-PAPC.
One important conclusion to emerge from these results, relevant to the understanding of genetic architecture underlying mRNA expression levels, was evidence of GxE interactions. Gene expression responsiveness trait values were examined as a function of common SNPs on a genome-wide level to identify GxE interactions, in which natural DNA variation was the genetic perturbation and Ox-PAPC treatment status was the environmental perturbation. We show that individual responses to Ox-PAPC were highly variable and that responsiveness to Ox-PAPC for 32% of the most highly Ox-PAPC regulated transcripts exhibited regulation by at least one genetic locus.
Material and Methods
Cell Culture and Treatment with Ox-PAPC
An overview of the experimental design and subsequent data processing and analyses are shown in Figure 1 and Figure S1 available online. HAECs were isolated from aortic explants of heart transplant donors of anonymous origin through the UCLA transplant program and grown to confluence in 100 mm dishes as previously described.14 A total of 250,000 cells were plated into each well of a standard six-well dish. At 90% confluence, cells were treated for 4 hr in duplicate with either media alone or Ox-PAPC-containing media. Treatment media consisted of Medium 199 (Mediatech, Inc., Manassas, VA) containing 1% fetal bovine serum. Ox-PAPC treatment media additionally contained 40 ug/ml Ox-PAPC, prepared from PAPC purchased from Avanti Polar Lipids (Alabaster, AL) as previously described15 and checked for oxidation by mass spectrometry. Overall, two preparations of Ox-PAPC were used in the course of the experiment for prevention of increased oxidation of the Ox-PAPC over time. The first preparation was used for 47 HAEC donors and was completed within 4 months and the second set of 49 donors were treated and collected several months later. This “batch effect” was removed in downstream analysis by normalizing expression values between groups with COMBAT software.16 Cytoplasmic RNA was extracted with the RNeasy kit including optional DNase treatment (QIAGEN, Valencia, CA). RNA concentrations were measured with the NanoDrop 2000 (Thermo Fisher Scientific, Waltham, MA) and quality checked with the Agilent 2100 Bioanalyzer (Agilent, Palo Alto, CA).
Figure 1.

Experimental Design
Gene Expression and siRNA Experiments
RNA was prepared for hybridization to Affymetrix HT-HU133A microarrays with a standard protocol described previously.13 Intensity values were normalized with the robust multiarray average (RMA)17,18 normalization method in R 2.5.0 with the justRMA function of the affy package of Bioconductor. We utilized an alternative CDF file that excluded misaligned probes that were artifacts of the previous transcriptome build that was used for creating the publicly available Affymetrix CDF file. To create an updated CDF, we used the custom CDF created by Zhang J et. al.19 that was created for the Affymetrix U133A array. Because of the differences in the underlying location of probes between the U133A and HT-U133A arrays, we first created a probe-to-probe map between the arrays. Then we converted the alternate CDF file from the U133A format to the HT-U133A format using this map. No other alterations were made.
Consistent with previous studies that evaluated the genetics of gene expression with Affymetrix platforms,20,21 we did not remove probes that had SNPs in them because the quantification of Affymetrix Probe Set IDs (PSIDs) is a reflection of multiple probes that are scattered throughout the targeted transcript. In the case where a SNP caused differential hybridization between alleles in one of the probes in a PSID, on average, ten additional probes would have contributed to the calculation of PSID intensity. It is important that probes containing SNPs are removed in array platforms in which a single oligonuclotide sequence is used for quantifying transcripts such as Agilent and Illumina platforms; however, this a less pertinent issue for RMA-normalized Affymetrix data.
Probe sets were excluded from local- analysis if they aligned to multiple locations in the genome that were more than 1 Mb apart. A total of 385 microarrays, corresponding to 96 unique donors, were used in this study. Sex was determined from heterozygous genotype calls on the X chromosome and revealed that 73 donors were male and 23 were female. There were 11 females and 36 males in “batch 1” and 12 females and 37 males in “batch 2.” COMBAT software16 was used for normalizing expression values for sex and batch. We did not normalize for treatment in COMBAT because we wanted to maintain the differences in expression patterns between control and Ox-PAPC-treated arrays. Treatment conditions were always performed in parallel and were therefore not confounded by batch. We performed principal component analysis to identify known technical variables, such as array plate, row, column, and hybridization date that correlated with PCs. This analysis showed that the first PC was driven by treatment (control versus Ox-PAPC); however, the other PCs were not explained by known variables. Transcript expression was used for clustering the microarray samples and confirmed that no outlier arrays were used in downstream analysis. Expression values were averaged between duplicate arrays per condition and donor. Three expression data sets were used in downstream analysis: control (i.e., basal), Ox-PAPC-treated values, and the fold change of Ox-PAPC over basal levels, which was calculated as the (log2(Ox-PAPC) – log2(basal)) expression values. Equal amounts of cDNA for qRT-PCR were made with the ABI High Capacity cDNA Reverse Transcription Kit (Foster City, CA). The Roche LightCycler 480 Master Mix and LightCycler 480 machine (Roche Diagnostics, Indianapolis, IN) were used for qRT-PCR reactions. Primer sequences used for qRT-PCR can be found in Table S1. siRNA experiments were performed as previously described.22 In brief, cells were transfected at 75% confluence for 4 hr with Lipofectamine 2000 (Invitrogen, Carlsbad, CA) and 40 nmole of siRNA (QIAGEN) (sequences found in Table S1). After 24–48 hr, cells were treated with Ox-PAPC for 4 hr and mRNA was collected for qRT-PCR or microarrays. ATF4 (MIM 604064) and XBP1 (MIM 194355) knockdown experiment RNA preparations were hybridized to Illumina Human Ref-8 microarrays and normalized as previously described.23
SNP Genotypes
Genomic DNA was isolated from HAECs with the DNeasy extraction kit with optional DNase treatment (QIAGEN) and quantified with NanoDrop 2000 (Thermo Fisher Scientific, Waltham, MA). All samples were randomly arrayed into three 96-well microtiter plates at 50 ng/ul. Per Affymetrix Genome wide Human SNP Array 6.0 assay protocol, 2 × 250 ng of gDNA were digested by restriction enzymes NspI and StyI separately and products were ligated to respective adaptors (Affymetrix Human SNP 6.0 assay). PCR was used for amplifying ligation products and checked for size and quality by QIAxcel (QIAGEN). Labeled PCR products were hybridized to the Human SNP 6.0 array. Array hybridization, washing and scanning were performed according to the Affymetrix recommendations. Scanned images were subjected to visual inspection and a chip quality report was generated by the Affymetrix GeneChip Operating System (command console) and the Genotyping console (Affymetrix). The image data was processed with the Affymetrix Genotyping Console or Birdsuite algorithm24 for determining the specific hybridizing signal for each SNP call and copy-number detection. SNPs used in association analysis were filtered according to the following criteria: (1) 296,151 SNPs were removed with minor allele frequencies (MAF) less than 10% or from sex chromosomes, (2) 92,316 SNPs were removed that violated Hardy-Weinberg Equilibrium (p value > 0.05), and (3) 6,250 SNPs were removed that had missing values in >10% of individuals. The remaining 545,098 SNPs were used for association testing of distal- variants. Given that the method of multiple testing correction used in this study relied on the number of linkage disequilibrium blocks, and not the number of SNPs, we could have used a smaller MAF in our eQTL analysis. Had we used the MAF of 5%, we would have identified many thousands of additional eQTLs in the basal and Ox-PAPC data sets. However, we used the more conservative MAF (10%) in this study to avoid spurious eQTL that may arise from small samples of heterozyotes or minor allele homozygotes. All SNP filtering was performed with the freely downloadable whole-genome association toolkit PLINK 1.4.25
Because our HAEC population was derived from aortic explants of anonymous heart transplant donors, we have no individual information, including ethnicity, history, or disease status. We therefore sought to ascertain the population structure of our population to ensure that gross population stratification would not cause spurious association results. We tested for population structure in PLINK by using the “-clustering” function that clusters individuals on the basis of the IBS sharing of their autosomal genotypes. This analysis resulted in a single cluster of individuals, suggesting that the individuals in our HAEC population had similar genetic structure. Further analysis of population structure was implemented by plotting the first two principal components of the sharing of autosomal genotypes. Visual inspection suggested that modest population structure existed in our data; however, removing these samples had little effect of the results of the study (Figure S2).
Association Analysis
Normalized expression values were associated to SNPs using the –assoc command in PLINK that tests for additive SNP effects. For local-association testing, only SNPs within the ±500 kb window measured from the 5′ and 3′ edges of the transcript were used. The local- region was extended to ±1 Mb when searching for local-expression traits that comapped to distal-gxeQTL of interest. A total of 1000 permutations between each expression values and local-SNPs determined the empirical locus-wide corrected p values for each SNP. SNPs used for distal- association included all filtered SNPs outside of the local- region. Five percent false discovery was determined for basal and Ox-PAPC distal-association data sets with point-wise thresholds = (r/t)∗FDR, where r is the rank based on ascending p values, t is the number of tests, and FDR is the desired FDR threshold (5%).26 For our data set the number of tests was 1.278 × 10⁹ (19,092 transcripts × 66,923 LD blocks27). When association p values exceeded the calculated point-wise threshold, we considered the result significant at 5% FDR. In our gxeHotspot analysis distal- associations were considered when they exceeded 7.47 × 10⁻⁷, corresponding to the Bonferroni corrected threshold given the number of linkage disequilibrium blocks estimated from the CEPH HapMap genome.27 All transcripts were considered for GxE local-gxeQTL, whereas only transcripts that were regulated by more than an average of 2-fold by Ox-PAPC (59 transcripts) were considered when testing for distal-gxeQTL. We chose to focus on the transcripts that were regulated by more than an average of 2-fold by Ox-PAPC for two reasons. First, highly Ox-PAPC regulated transcripts are likely to have a biological impact in the Ox-PAPC response and are therefore likely to be an important source of variation between donors. Second, limiting the number of transcripts included in distal-GxE analysis reduced the burden of multiple testing to enable our detection of true positives.
Results
Evidence for Genetic Control of Basal Gene Expression and Expression Responsiveness to Ox-PAPC
To directly observe gene expression variation in our population of 96 primary HAECs, we measured transcript levels for control and Ox-PAPC-treated cultures. To test for repeatability in expression values to ensure that expression variation among HAEC donors was stable and not due to technical variation, we selected the 100 most variable transcripts across all donors. Then we analyzed the correlations for these 100 genes between (1) ten independent culture pairs from separate passages of cells that originated from the same donor and (2) 43 random pairings of cultures from different donors. We tested for repeatability in gene expression for three expression data sets after normalization: expression measured at baseline, expression measured after Ox-PAPC treatment, and the individual response values calculated as Ox-PAPC treated/untreated. All three data sets demonstrated repeatability for intraindividual pairs relative to interindividual pairs (Figure S3). Calculated from the 100 most variable genes in their basal levels, we found that intra-individual expression was replicated on different passage (R = 0.721, p < 2.2e−16), whereas inter-individual expression was not correlated (R = −0.007, p = 0.657). The same trend was observed for expression of the 100 most variable genes after Ox-PAPC treatment (intra: R = 0.698, p < 2.2e−16, inter: R = −0.016, p = 0.280) and the individual fold change values caused by Ox-PAPC of the 100 most variable transcripts (intra: R = 0.158, p = 5.0e−7, inter: R = 0.008, p = 0.618). To formally test for repeatability in gene expression signatures, we compared the R2 value distributions for the 1000 most variable genes between intraindividual pairs and 43 random interindividual pairs (Figure S4A). Expression was significantly more similar within as compared to between donors for basal (p < 2.2 × 10⁻¹⁶), Ox-PAPC-treated (p < 2.2 × 10⁻¹⁶), and individual Ox-PAPC-induced fold change values (p < 2.2 × 10⁻¹⁶) as determined by t test. As expected, duplicate arrays were highly correlated (Figure S4B).
Basal expression values as well as individual responses to Ox-PAPC were variable in our HAEC population (Figure 2). Expression patterns fell into several different classes: 17,582 transcripts were not affected by Ox-PAPC across all individuals (examples in Figure 2A), 1,510 transcripts were altered by an average of at least 1.2-fold by Ox-PAPC, 261 transcripts were altered by at least 1.5-fold, and 59 were altered on average by more than 2-fold (examples in Figures 2B and 2C). Responsive transcripts were determined by a two-sided paired t test between control and Ox-PAPC measurements. These observations met a 5% false discovery rate (FDR), meaning that up to 5% of these results could have been deemed significant by chance. There is a large overlap in the genes identified to be regulated by Ox-PAPC in this study and that reported previously.13 Seventy-four percent of the transcripts that were differentially expressed by more than 1.5-fold in this study had been previously reported in the analysis of 12 HAEC donors. Discrepancies between the studies may be due to different preparations of Ox-PAPC, culturing conditions, and sample sizes. These data confirm that Ox-PAPC robustly regulates transcription in ECs.
Figure 2.
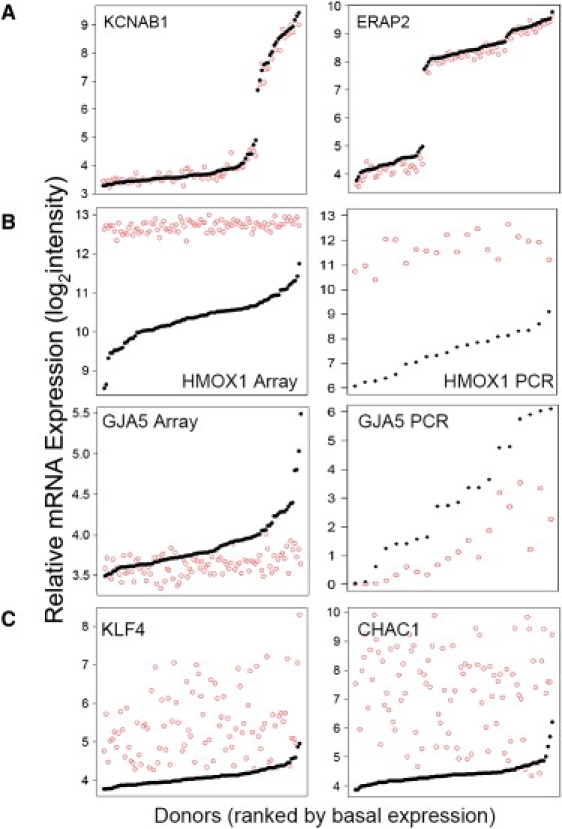
Expression Variation in the HAEC Population
Gene expression intensity (y axis) for the indicated transcripts are shown for basal (solid black circles) and Ox-PAPC-treated (open red circles). Variations in the HAEC population are shown in (A) for transcripts KCNAB1 (left) and ERAP2 (right) in which basal levels were variable but unresponsive to Ox-PAPC. In (B), expression variation in HMOX1 (top) and GJA5 (bottom) are shown from microarrays (left) and with RT-PCR (right). Variation in these transcripts was greater at baseline compared to after Ox-PAPC treatment. Transcripts KLF4 (left) and CHAC1 (right), whose Ox-PAPC treated expression was more variable than basal levels, are shown in (C). Donors are rank ordered by basal expression along the x axis and expression values are on a log2 scale (y axis).
HAEC Gene Expression Regulation by Local and Distal Genetic Variants
To test whether common genetic polymorphisms explained differences in gene expression, we genotyped each primary HAEC culture using the Affymetrix 6.0 SNP platform. For this analysis, the ∼1 million SNPs on the array were filtered to a working set of 545,098 autosomal SNPs by removal of SNPs that (1) exhibited less than 10% minor allele frequency, (2) violated Hardy-Weinberg equilibrium, and (3) had more than 10% missing values. Three data sets were used for expression-based whole-genome association: (1) basal gene expression, (2) expression for cells treated with Ox-PAPC, and (3) the change in gene expression trait values caused by Ox-PAPC-treatment (also called “response” to Ox-PAPC). Significant associations identified in the latter data set were defined as gxeQTL because they reflect genetic variation that associated with individual variability in the environmentally induced (Ox-PAPC) changes in gene expression trait values (discussed below). The series of data analysis we performed are outlined in Figure S1.
One unique characteristic of gene expression phenotypes is that they have a physical address in the genome. This provides the opportunity to define two distinct types of expression associations: local-expression quantitative trait loci, abbreviated as local-eQTL (commonly also referred to as cis-), and distal-expression quantitative trait loci, abbreviated as distal-eQTL (commonly also called trans-) (reviewed in Rockman and Kruglyak28). Local regions were defined in this study as SNPs in the range of 500 kb upstream to 500 kb downstream of the physical location of the regulated trait. Distal-eQTL were those outside the local- region. We chose to use the terms local- and distal-, rather than cis- and trans-, because we feel they are more accurate (as discussed by Rockman and Kruglyak28) and avoid any confusion microbiologists and other nongeneticists may have with the terms cis- and trans-.
The number of SNPs per local- region ranged from 1 to 1398 (mean = 187.5, median = 182). In our HAEC data set, 2,668 expression traits had at least one significant local-eQTL for basal expression at a locus-wide empirical significance level less than 0.05. Additionally, for expression values measured after Ox-PAPC treatment we observed 2,766 significant associations. As measured by regression R2, the proportion of variation in expression trait values by single local-eQTL ranged from 23%–84% (mean 34%) (Figure S5). These data are consistent with the magnitude of local-expression associations found in other studies of similar size10,20,29–31 and confirmed our hypothesis that basal gene expression traits were genetically regulated in our HAEC population. Half of the transcripts with local- regulators of basal expression levels also showed local- regulation in their Ox-PAPC-treated values (Figure S6).
KCNAB1 (MIM 601141) and ERAP2 (MIM 609497) are examples of genes not regulated by Ox-PAPC that show highly significant local-eQTL for basal expression levels (Figures 3A and 3B). KCNAB1 basal levels exhibited a 16-fold difference in expression between HAEC donors homozygous for minor versus major alleles of rs6775600 (p value = 1.07 × 10⁻³⁵). The regression coefficient (R2) for this eAssociation was 0.81, demonstrating nearly Mendelian regulation of KCNAB1 transcript levels by local variation. A fold change of similar magnitude was observed between HAEC donors carrying different genotypes at the ERAP2 local-eQTL rs27290 (R2 = 0.84, p value = 1.68 × 10−38). Additional examples of local-eQTL for basal expression are shown in Figure 3C. These data confirm that expression was strongly influenced by common genetic variation in our system and provide an atlas of local-regulatory relationships in a primary vascular cell type.
Figure 3.
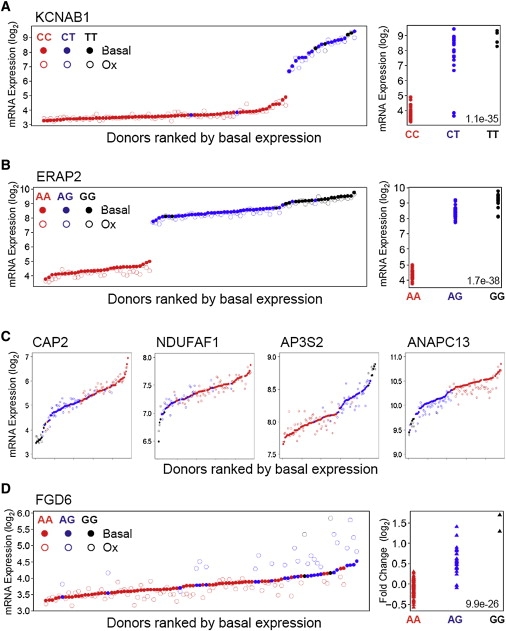
HAEC Gene Expression Is Genetically Regulated by Local Variants
Expression of KCNAB1 in untreated (solid circles) and Ox-PAPC-treated (open circles) samples are shown in (A). Donors are across the x axis in order of increasing basal expression and colored according to genotypes at the local-eQTL rs6775600. The right-hand plot shows basal transcript values of KCNAB1 as a function of genotype at the same SNP. In (B), expression of ERAP2 is shown according to the same schema described in (A) for local-association to rs27290, and for four additional genes (CAP2 [MIM 601697], NDUFAF1 [MIM 606934], AP3S2 [MIM 602416], and ANAPC13) with respective local-eQTL in (C). (D) shows the local-gxeQTL rs7135847 association to expression levels of FGD6 at basal and after Ox-PAPC treatment (left panel) with the same schema described in (A) and (B). The right panel shows the log2 fold regulation of FGD6 upon Ox-PAPC treatment as a function of genotypes at rs7135847.
Distal-genetic regulation of expression has been reported in various association studies; however, the effect sizes of distal- regulation are generally smaller and thus more difficult to detect relative to local- regulation. Nonetheless, we were able to detect significant evidence of genetic regulation of expression traits by distal variants. At a 5% FDR, we identified 6696 distal- associations for basal expression (Table 1). The FDR procedure we implemented would not account for strong p values that occur as a result of outliers. It would have been optimal to perform two-way SNP and transcript permutation analysis to adjust for the validity of each transcript's distal profile; however, this was not feasible given the number of SNPs and traits in our data set. For this reason, we chose a conservative MAF of 10% so that our association results would be less prone to the effects of outliers. The proportion of trait variation explained by single distal-eQTL ranged between 23%–61% for basal expression data (Figure S5). This includes the full set of unique transcript/eQTL association pairs and therefore includes situations in which transcripts associated to multiple distal-eQTL and in which distal-eQTL associated to many transcripts. For basal transcript levels, 5494 unique eQTL were associated with at least one transcript, and 2978 transcripts showed distal- regulation by at least one eQTL. The number of post-Ox-PAPC measured expression distal- associations were on the same order as those observed for basal expression traits (Table 1). These data clearly show that distal- variants robustly regulated endothelial gene expression and furthermore provide a detailed atlas of distal-regulatory relationships for this specialized human cell type.
Table 1.
Basal and OxPAPC-Treated Expression Traits Are Regulated by Distal Variants
| Transcript/Distal-eQTL pairs | Distal-eQTL | Transcripts | Unique Gene Symbols | |
|---|---|---|---|---|
| Basal | 6696 | 5494 | 2978 | 2584 |
| OxPAPC | 8243 | 6571 | 3684 | 3150 |
The number of significant transcript distal-eQTL pairs is shown at 5% FDR. For these associations, the corresponding number of eQTL, transcripts (probe sets from the microarray), and the corresponding number of unique genes are shown.
To investigate whether SNPs underlying probe sequences may have created “ghost eQTLs” in our data, we examined the distribution of SNP-containing probe sets among our eQTL results for basal expression. This was calculated with the full set of SNPs in dbSNP 129, many of which are rare and thus unlikely to be polymorphic in our population. We identified the same proportion of probe sets with SNPs in significant eQTLs as in nonsignificant eQTLs. Specifically, 69% of eQTLs contained at least one probe containing a SNP per probe set for both significant and nonsignificant eQTLs. These data suggest that SNPs in probe sets did not affect our eQTL results.
Gene-by-Environment Interaction with Local Variants
To find genetic variations associated to individual gene responsiveness to Ox-PAPC treatment, and thus GxE interactions, we tested for local-gxeQTL in our population of HAECs by associating SNPs to individual Ox-PAPC-induced fold changes of transcripts. We chose to perform the association analysis as described because it was an intuitive way to test for GxE associations. A thousand permutations in each local region (500 kb up to 500 kb down of transcripts) determined the empirical locus-wide significance values. A total of 1,005, 247, and 37 unique genes had respective local-gxeQTL at locus-wide significance thresholds of 0.05, 0.01, and 0.001 (Table 2). These results corresponded to more significant observations than would be expected by chance, indicating that local-gxeQTL played a role in individual Ox-PAPC responsiveness. However, the false discovery rate of these observations is high (59%, 48%, and 32%), making it difficult to conclude how common local-gxeQTL are in regulating expression. The seven most significant local-gxeQTL associations are listed in Table S2.
Table 2.
Evidence for local-gxeQTL
| Locus-wide α Significance | Significant Transcripts (Expected False Positives) | Significant Genes (Expected False Positives) |
|---|---|---|
| 0.001 | 38 (18) | 37 (12) |
| 0.01 | 253 (184) | 247 (118) |
| 0.05 | 1069 (918) | 1005 (592) |
The fold induction of FGD6 was the most significant local-gxeQTL in our data set (p value = 9.9 × 10⁻²⁶) (Figure 3D). FGD6 is thought, by sequence homology, to be a Rho family guanine nucleotide exchange factor (RhoGEF) that catalyzes GDP/GTP exchange for small G proteins involved in cytoskeletal pathways. rs7135847 was the peak gxeQTL located within the second intron of FGD6 within linkage disequilibrium of the FGD6 promoter and several lesser-associated gxeQTL. In the case of FGD6, both basal and Ox-PAPC treated levels were genetically controlled. Thus, cells from individuals with the AA genotypes exhibited significantly lower levels of expression than cells from AG or GG individuals. Upon treatment with Ox-PAPC, AA cells showed decreased expression, whereas AG or GG cells showed increased expression, representing a striking example of a local-gene-by-environment interaction and evidence of a local-regulatory element that modifies Ox-PAPC responsiveness in ECs.
Evidence of Gene-by-Environment Interactions for Distal Variants
On the basis of studies in yeast8 and human lymphoblastoid cell lines,10 we hypothesized that most of the gxeQTL that regulate individual responses to Ox-PAPC treatment would be distal- as opposed to local- variants. To test this hypothesis, we focused on the 59 expression traits (corresponding to 49 unique transcripts) that were an average of at least 2-fold regulated by Ox-PAPC across our HAEC population. Thirty-two percent of these transcripts exhibited at least one significant distal-gxeQTL association at 5% FDR. In total, 21 unique gxeQTL were associated to 19 transcripts (corresponding to 18 unique genes) (Table S3). The amount of variation in the fold change of a given transcript explained by single gxeQTL ranged from 24%–32%, indicating that a quarter or more of the variability in responsiveness to Ox-PAPC could be attributed to single loci for these transcripts. Three of the 21 distal-gxeQTL were located in LD blocks containing genes. The remaining distal-gxeQTL were in intergenic LD blocks not containing genes. One such gxeQTL, associated to the Ox-PAPC response values of ENC1 (MIM 605173), was within clear linkage disequilibrium of two genes, GPX2 (MIM 138319) and RAB15 (MIM 610848). Of these two candidates, only RAB15 was highly expressed in HAECs. Whereas most gxeQTL were only associated to one expression trait, distal-gxeQTL rs2831649 was associated to the Ox-PAPC response of seven expression traits, thus identifying a locus on chromosome 21 as an important putative regulator of Ox-PAPC responsiveness for several transcripts (discussed below).
Distal regulation of expression traits is likely to occur through the action of an intermediate gene product. We therefore sought to better prioritize candidate causal genes located at distal- loci, and responsible for the distal- signal, by asking whether distal-gxeQTL also associated to local transcript levels. Locally associated expression traits would then be strong candidates for the observed changes in target expression traits at distal- loci. In scanning for local-associated transcripts, we extended the local search criteria to span 1 Mb upstream to 1 Mb downstream of transcriptional start sites and considered associations to basal, Ox-PAPC, or response values of local transcripts. Ox-PAPC-treated expression levels of USP16 (ubiquitin specific peptidase 16 [MIM 604735]) showed evidence (nominal p value = 3.3 × 10⁻⁵) of local-expression association to rs2831649, the aforementioned distal-gxeQTL on chromosome 21 that associated to 7 expression traits (Figure S7). Another distal-gxeQTL, rs2412524, which associated to the Ox-PAPC response values of NAV3 (MIM 611629), showed evidence of local-association to two local transcripts: one 83,475 bp downstream of the SNP, IVD (isovaleryl coenzyme A dehydrogenase, [MIM 607036]) (nominal p value = 4.6 × 10⁻⁵), and the other 266,809 bp downstream of the SNP, DNAJC17 (DnaJ homolog subfamily C member 17) (nominal p value = 3.2 × 10⁻⁴). Both of these local- associations to gxeQTL rs2412524 were for the basal levels of local transcripts, suggesting a mechanism in which baseline expression differences would determine the Ox-PAPC inducibility of target genes at distal- loci. The remaining distal-gxeQTL lacked local- candidates and ranged in distance from 28,508 to 809,716 base pairs to the nearest transcript. Four genes (HMOX1 [MIM 141250], SLC7A11 [MIM 607933], VEGFA [MIM 192240], and TRIB3 [MIM 607898]) exhibited distal-gxeQTL associations at two unique loci, whereas all other genes were associated to one distal-gxeQTL (Table S3).
One pattern suggestive of GxE regulation that we observed for Ox-PAPC-regulated genes was greater variation across donors in basal expression relative to Ox-PAPC-treated values (n = 180) (examples in Figure 2B). In contrast, Ox-PAPC-treated levels were generally more variable than the corresponding basal values (n = 530) (examples in Figure 2C) (Figure S8). Heme oxygenase 1 (HMOX1) was an example of a gene in which the basal expression varied widely among the individuals studied, with more than a 10-fold difference between the extremes (Figure 2B, top-left panel). Ox-PAPC treatment resulted in a dramatic induction of HMOX1 in these individuals, ranging from ∼2-fold to 16-fold. However, the levels of HMOX1 transcript in the induced state were very similar among all individuals and showed no relationship to basal levels. For the case of GJA5 (MIM 121013), basal levels again varied considerably, but Ox-PAPC treatment caused a decrease in expression such that all individuals exhibited similar levels, independently of baseline expression (Figure 2B, bottom-left panel). Our observation that Ox-PAPC induced HMOX1 expression to reach a maximum value and reduced GJA5 expression to a minimum value could have been due to technical artifacts such as saturation of the array capture probes or by a limited dynamic detection range of arrays. We tested this possibility by performing quantitative RT-PCR, which is not limited by the same constraints, on a subset of individuals. qRT-PCR for HMOX1 confirmed that Ox-PAPC induced HMOX1 to similar levels for all individuals regardless of baseline expression, suggesting that there was a biological limit to the amount of HMOX1 cells produced after treatment (Figure 2B, top-right panel), confirming that HMOX1 expression after treatment does not appear to be genetically regulated but environmentally regulated. qRT-PCR for GJA5 confirmed that basal expression was not predictive of the degree of Ox-PAPC-dependent downregulation; however, the limited sensitivity of the arrays, as compared to qRT-PCR appeared to contribute to the level of downregulation by Ox-PAPC (Figure 2B, bottom-right panel).
Genotype x Ox-PAPC-Dependent Regulatory Hotspots
We tested for large-scale differences in genetic transcript regulation that were condition dependent. To be more inclusive when looking for widespread regulation, we considered all distal-eQTL where p < 7.47 × 10⁻⁷, which corresponded to the transcript-specific Bonferroni correction threshold for the number of estimated unique linkage disequilibrium blocks interrogated by SNP array platforms in the human genome.27 Genomic loci that showed condition-specific associations for several expression traits were designated genotype × Ox-PAPC-dependent regulatory hotspots (gxeHotspots). Six gxeHotspots explained variation in responsiveness for ten or more transcripts (Figure 4). The most pronounced gxeHotspot associated to the Ox-PAPC-induced response for 33 transcripts. This was the same gxeQTL on chromosome 21 that associated to seven highly Ox-PAPC-regulated genes from our distal- analysis and was locally associated to the expression levels of USP16. The only additional gxeHotspot that exhibited regulation for a local- candidate was rs6743090 on chromosome 2 that locally associated to basal, Ox-PAPC, and Ox-PAPC-responsive values of MCM6 (MIM 601806) (Table S4), suggesting a role for MCM6 in regulating the Ox-PAPC inducibility of multiple targets.
Figure 4.

gxeHotspots
gxeHotspot loci were determined by counting the number of transcripts (y axis) whose response to Ox-PAPC comapped to gxeQTL across the autosomes (x axis). gxeAssociations with p < 7.47 × 10⁻⁷ were considered in this analysis.
USP16 Modulates Ox-PAPC Induction of Target Genes Involved in the UPR
To test the hypothesis that USP16 (a histone H2A deubiquitinase) regulated Ox-PAPC responsiveness for the seven highly induced Ox-PAPC genes identified in our distal- analysis, we used an RNAi approach. The Ox-PAPC fold induction for all seven target genes (ASNS [MIM 108370], CEBPB [MIM 189965], SLC7A11, SLC7A5 [MIM 600182], SLC3A2 [MIM 158070], TRIB3, and VEGFA) of gxeQTL rs2831649 were measured after transfection by two unique siRNAs against USP16 and compared to the scrambled control. USP16 transcript levels were reduced to ∼15% of control levels by USP16 siRNA1 and in 10% of control levels with siRNA2 (Figure 5A). Six of the seven transcripts (all but VEGFA) were induced by more than 2-fold by Ox-PAPC in the HAEC donor in this experiment. The G allele of rs2831649 was associated with higher USP16 expression as well as greater Ox-PAPC-induced fold changes of target genes. We therefore expected that USP16 knockdown would reduce the Ox-PAPC effect on target genes. As expected, the Ox-PAPC-induced fold change for five of these genes were reduced upon USP16 knockdown by at least one siRNA, whereas four targets exhibited reduced Ox-PAPC inducibility by both USP16 siRNAs (Figure 5B). IL8 [MIM 146930] and LDLR [MIM 606945], two additional genes known to be induced by Ox-PAPC but whose Ox-PAPC response did not associate to rs2831649, were included as negative controls. Ox-PAPC-response values for IL8 and LDLR were not significantly reduced by USP16 knockdown, demonstrating that USP16 selectively modulates the Ox-PAPC inducibility of predicted target genes.
Figure 5.
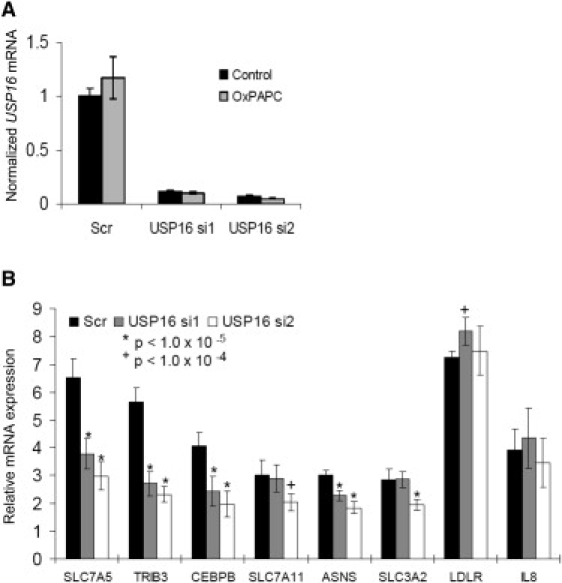
USP16 Regulates Target Gene Responsiveness to Ox-PAPC
(A) USP16 mRNA message levels were measured by qRT-PCR and normalized to the housekeeping gene B2M after transfection with the scrambled control and two USP16 siRNAs in HAECs.
(B) The Ox-PAPC-fold induction for six target genes and the negative control genes IL8 and LDLR. Averages ± SD are shown for both (A) and (B).
The seven genes associated to gxeHotspot rs2831649 have been shown to respond to amino acid deprivation,32,33 and some to the UPR stress response,23,33–35 which is known to be induced by Ox-PAPC in this cell type.22 Many of these molecules are regulated by or interact with activating transcription factor 4 (ATF4), a UPR-activated transcription factor that coordinates one of the UPR response pathways32,34–36 To test whether the Ox-PAPC fold induction values of these transcripts were regulated by two important UPR transcription factors, ATF4 and X-box binding protein (XBP1), which coordinate stress response pathways, we utilized microarray data collected after siRNA knockdown with and without Ox-PAPC treatment. ATF4 and XBP1 were both silenced by more than 70% of their control values (Figure S9). Of the seven targets, VEGFA was not significantly detected on the array. Four of the remaining six transcripts (ASNS, CEBPB, SLC7A5, and TRIB3) exhibited reduced Ox-PAPC-induced fold changes after ATF4 and XBP1 knockdown, suggesting that these genes are either direct or indirect targets of both transcription factors (Table 3). Together, these data support the hypothesis that variation at the chromosome 21 gxeHotspot locus, probably acting through USP16, coordinates cellular responses to ER stress that involves ATF4 and XPB1 transcription factors.
Table 3.
ATF4 and XPB1 Silencing Affects OxPAPC Inducibility of gxeHotspot rs2831649-Associated Genes
| Gene Symbol | Scr Fold Change (stdev) | ATF4 siRNA Fold Change (stdev) | ATF4 siRNA p Value | XBP1 siRNA Fold Change (stdev) | XBP1 siRNA p Value |
|---|---|---|---|---|---|
| ASNS | 2.41 (0.24) | 1.22 (0.03) | 0.0001 | 1.88 (0.14) | 0.0094 |
| CEBPB | 2.75 (0.23) | 1.43 (0.18) | 0.0001 | 1.65 (0.26) | 0.0007 |
| SLC7A5 | 3.15 (0.17) | 1.79 (0.25) | 0.0001 | 2.46 (0.21) | 0.0022 |
| TRIB3 | 2.67 (0.29) | 1.65 (0.13) | 0.0007 | 1.71 (0.10) | 0.0009 |
Discussion
We have investigated the nature of GxE interaction in the human population by monitoring global expression traits in HAECs after perturbation with biologically active lipids. HAECs, obtained from 96 heart transplant donors, were subjected to genotyping with high-density SNP arrays, enabling transcript responses to be associated with specific polymorphisms in the genome. Our experimental design enabled the identification of GxE interactions because we utilized a diverse human population of vascular cells that were treated by a clinically relevant perturbation in a controlled environment. Our results show that GxE interactions are common in the human population, consistent with previous studies in yeast and worms, and they reveal several different classes of interactions.
We first demonstrated strong evidence that the gene expression in primary HAECs, both in the basal state and after treatment with Ox-PAPC, were heritable. Thus, when the responses of cells from a single individual were examined in different passages, they were significantly correlated, whereas the responses from different individuals were not correlated (Figures S3 and S4). These results could be explained by epigenetic as well as genetic differences. We further observed that a significant fraction of variability in transcript levels could be attributed to genetic loci, some exhibiting essentially Mendelian expectations (Figure 3). The high heritability of expression traits has previously been observed in studies of related individuals and populations for primary lymphocytes,30 lymphoblastoid cell lines,20,21,37–39 brain cortex,40 osteoblasts,41 T cells,37 fibrobalsts,37 liver biopsies,42 and adipose biopsies29 of humans.
The key finding of our study is that there were very significant interactions between genotype and response to Ox-PAPC for approximately one-third of the most highly regulated expression traits. Many such GxE interactions involved distal- regulation, but we also observed some local-GxE interactions (Figure 3D and Table 2), indicating that although infrequent, local sequences have the potential to greatly perturb environment-dependent phenotypes. These results are consistent with those from genetic crosses between different strains of yeast8 and human lymphoblastoid cell lines treated with ionizing radiation.10 In our study, the most significant local-gxeQTL was for a variant of FGD6 (p value = 9.55e−22) (Figure 3D), suggesting that this gene harbors an Ox-PAPC-response element. Such an element has yet to be identified given that cloning of the proximal FGD6 promoter (−1898 to +224) into a luciferase reporter showed no difference between alleles in HAECs (data not shown).
We identified gxeHotpspot loci that associated distally to the Ox-PAPC fold induction of multiple transcripts. Of particular interest was the gxeHotspot on chromosome 21 that associated to the Ox-PAPC responsiveness for seven (12%) of the most highly Ox-PAPC regulated transcripts. We identified that USP16 was locally associated with this locus, thereby making it a strong causal candidate. Regulation of target gene responsiveness to Ox-PAPC, mediated by USP16, was validated with siRNA knockdown, which impaired the responsiveness of all induced targets in at least one siRNA condition (Figure 5). USP16 is a histone H2A deubiquitinase that has been described in regulating progression through the cell cycle.43,44 Functionally, transcript response traits that map to the chromosome 21 gxeHotspot are known to be regulated by amino acid homeostasis and other ER stress stimuli, including Ox-PAPC.32–36 We confirmed that the Ox-PAPC response of these expression traits were regulated by the UPR transcription factors ATF4 and XBP1 (Table 3 and Figure S9). Taken together, our data suggest that variation at gxeHotspot SNP rs2831649 modulates the Ox-PAPC fold change in UPR genes, through the action of USP16. It remains unclear whether USP16 is the sole functional element at the chromosome 21 gxeHotspot locus or whether additional regulatory elements also modulate ER stress pathways. Variation at the rs2831649 locus is not in clear LD with the proximal promoter of USP16 (Figure S7B), making the mechanism of local-gxeAssociation difficult to determine. It is possible that a USP16 enhancer is located near rs2831649. This explanation is consistent with the observation that many SNPs identified in GWAS studies do not reside in LD blocks that containing genes,45 as is the case with the widely replicated heart disease locus on 9p2146,47 and has been described to occur more frequently with tissue-specific gene expression traits.37 USP16 expression is highly correlated with several of the targets, however, supporting the hypothesis that USP16 modulates target expression. An attractive hypothesis is that USP16 could alter chromatin structure upon Ox-PAPC treatment to enable the selective transcription of UPR genes such as ATF4 and XBP1 that orchestrate the ER stress response.
The most common GxE interaction pattern we observed for expression traits was little or no variation in the basal state but differences in the transcript level after Ox-PAPC treatment (Figure S8). In some cases, as in the FGD6 example above (Figure 3D), local-eQTL regulating basal transcript levels also exhibited regulation for the Ox-PAPC response pattern for the same transcript. In other cases, local-eQTL for Ox-PAPC levels exhibited shared regulation for transcript responses to Ox-PAPC, whereas some local-gxeQTL were not shared in either basal nor Ox-PAPC data sets (Figure S6). One form of GxE interaction involved an apparent limit to the level of induction or repression by Ox-PAPC. For example, HMOX1 expression varied widely in the basal state, but upon treatment with Ox-PAPC, all donor cells exhibited similar levels of expression (Figure 2B).
The number of eQTL identified in our study is larger than in studies of eQTL in HapMap lymphoblastoid cell lines.20,21,38,39 We are not surprised, however, at the detection of more regulation because lymphoblastoid cells have limitations for this type of study. Specifically, lymphoblastoid cells are transformed, which probably causes degradation of genetic regulators.48 On the contrary, our population of cells was early passage primary cells. Other studies conducted in primary, nontransformed cells and tissue have found genetic regulation of similar numbers of expression traits. For example, we report that 13.5% of transcripts have a local-eQTL for basal expression levels. At a 5% FDR, Emilsson et al.29 reported that 11.5% of tested expression traits had a local-eQTL in blood and 14.6% of the traits had a local-eQTL in adipose samples that were both collected from 150 unrelated subjects. As a control to show that we detected true local- signals, we plotted the peak local-eQTL location relative to the transcription start site (TSS) (Figure S10) and found that most local-eQTL occur within 100 kb of the TSS, consistent with variation in proximal promoters that alter transcriptional activity.31 Pastinen et. al.49 assessed the reproducibility of expression traits between genetics of expression studies and showed that overall lymphoblastoid expression profiles are poorly reproducible. Specifically, they compare the expression profiles of lymphoblastoid cell mRNA, as measured by (1) biological replicates that originated from the same donor but were processed by separate laboratories and hybridized to the same Affymetrix probe sets in different laboratories and (2) technical replicates that were hybridized to Affymetrix GeneChips. Biological replicates for the significantly heritable transcripts showed an R2 of ∼0.2. Biological replicates are much more correlated in our data (R2 = 0.721 for basal and 0.678 for Ox-PAPC) (Figure S3). Technical replicates, originating from separate cell-culture wells and processed independently, were also much tighter than previous reports (Figure S4B) with the R2 > 0.990 for basal and Ox-PAPC-treated expression measures.
Our study design will enable the elucidation of Ox-PAPC action in ECs as a model for the complex process of atherosclerosis. To date, endothelial pathways are known to be affected by Ox-PAPC treatment, including inflammatory gene expression,50 coagulation,51 junction formation,52 vasodilation,53 angiogenesis,54 the unfolded protein response,13,23 and plasma membrane electron transport.55 Our data set should be useful in elucidating the specific relationships between these pathways in a single cell type relevant to complex disease.
GWA studies, over the past 2 years, have identified numerous loci contributing to common diseases, but these generally explain a small fraction of the genetic component in disease.2 There are several likely explanations, including the importance of relatively rare variation that would not be detected in such studies56 and the presence of gene-gene interactions.57 Given the difficulty of assessing environmental factors in typical human studies, the presence of GxE interactions would greatly reduce power to detect important susceptibility loci. Our findings are consistent with studies of GxE interactions in lower organisms and suggest that GxE interactions affecting gene expression may be a common and important attribute of complex disease.
Acknowledgments
This research was funded by NIH grant PO1-HL030568 (A.J.L. and J.A.B.), NIH training grant HL069766 (C.E.R.), an American Heart Association pre-doctoral fellowship (C.E.R.) and an American Heart Association postdoctoral fellowship (S.D.L.). We would like to thank the Atherosclerosis Research Unit (ARU) at UCLA for help collecting the HAECs and Calvin Pan for data management. R.Y., C.T., B.G., A.H., P.S.G., and T.G.K. are employees and shareholders of Bristol-Myers Squibb.
Contributor Information
Casey E. Romanoski, Email: casey.romanoski@ucla.edu.
Aldons J. Lusis, Email: jlusis@mednet.ucla.edu.
Supplemental Data
Web Resources
The URLs for data presented herein are as follows:
Bioconductor, http://www.bioconductor.org/
Online Mendelian Inheritance in Man (OMIM), http://www.ncbi.nlm.nih.gov/Omim
Accession Numbers
The microarray data used in this study has been deposited in GEO (accession number GSE20060).
References
- 1.Ioannidis J.P., Thomas G., Daly M.J. Validating, augmenting and refining genome-wide association signals. Nat. Rev. Genet. 2009;10:318–329. doi: 10.1038/nrg2544. [DOI] [PMC free article] [PubMed] [Google Scholar]
- 2.Hardy J., Singleton A. Genomewide association studies and human disease. N. Engl. J. Med. 2009;360:1759–1768. doi: 10.1056/NEJMra0808700. [DOI] [PMC free article] [PubMed] [Google Scholar]
- 3.Talmud P.J. Gene-environment interaction and its impact on coronary heart disease risk. Nutr. Metab. Cardiovasc. Dis. 2007;17:148–152. doi: 10.1016/j.numecd.2006.01.008. [DOI] [PubMed] [Google Scholar]
- 4.Caspi A., Sugden K., Moffitt T.E., Taylor A., Craig I.W., Harrington H., McClay J., Mill J., Martin J., Braithwaite A., Poulton R. Influence of life stress on depression: Moderation by a polymorphism in the 5-HTT gene. Science. 2003;301:386–389. doi: 10.1126/science.1083968. [DOI] [PubMed] [Google Scholar]
- 5.Mackay T.F., Stone E.A., Ayroles J.F. The genetics of quantitative traits: Challenges and prospects. Nat. Rev. Genet. 2009;10:565–577. doi: 10.1038/nrg2612. [DOI] [PubMed] [Google Scholar]
- 6.Ulrich C.M., Kampman E., Bigler J., Schwartz S.M., Chen C., Bostick R., Fosdick L., Beresford S.A., Yasui Y., Potter J.D. Colorectal adenomas and the C677T MTHFR polymorphism: Evidence for gene-environment interaction? Cancer Epidemiol. Biomarkers Prev. 1999;8:659–668. [PubMed] [Google Scholar]
- 7.Perlstein E.O., Ruderfer D.M., Roberts D.C., Schreiber S.L., Kruglyak L. Genetic basis of individual differences in the response to small-molecule drugs in yeast. Nat. Genet. 2007;39:496–502. doi: 10.1038/ng1991. [DOI] [PubMed] [Google Scholar]
- 8.Smith E.N., Kruglyak L. Gene-environment interaction in yeast gene expression. PLoS Biol. 2008;6:e83. doi: 10.1371/journal.pbio.0060083. [DOI] [PMC free article] [PubMed] [Google Scholar]
- 9.Li Y., Alvarez O.A., Gutteling E.W., Tijsterman M., Fu J., Riksen J.A., Hazendonk E., Prins P., Plasterk R.H., Jansen R.C. Mapping determinants of gene expression plasticity by genetical genomics in C. elegans. PLoS Genet. 2006;2:e222. doi: 10.1371/journal.pgen.0020222. [DOI] [PMC free article] [PubMed] [Google Scholar]
- 10.Smirnov D.A., Morley M., Shin E., Spielman R.S., Cheung V.G. Genetic analysis of radiation-induced changes in human gene expression. Nature. 2009;459:587–591. doi: 10.1038/nature07940. [DOI] [PMC free article] [PubMed] [Google Scholar]
- 11.Lusis A.J. Atherosclerosis. Nature. 2000;407:233–241. doi: 10.1038/35025203. [DOI] [PMC free article] [PubMed] [Google Scholar]
- 12.Berliner J.A., Watson A.D. A role for oxidized phospholipids in atherosclerosis. N. Engl. J. Med. 2005;353:9–11. doi: 10.1056/NEJMp058118. [DOI] [PubMed] [Google Scholar]
- 13.Gargalovic P.S., Imura M., Zhang B., Gharavi N.M., Clark M.J., Pagnon J., Yang W.P., He A., Truong A., Patel S. Identification of inflammatory gene modules based on variations of human endothelial cell responses to oxidized lipids. Proc. Natl. Acad. Sci. USA. 2006;103:12741–12746. doi: 10.1073/pnas.0605457103. [DOI] [PMC free article] [PubMed] [Google Scholar]
- 14.Navab M., Hough G.P., Stevenson L.W., Drinkwater D.C., Laks H., Fogelman A.M. Monocyte migration into the subendothelial space of a coculture of adult human aortic endothelial and smooth muscle cells. J. Clin. Invest. 1988;82:1853–1863. doi: 10.1172/JCI113802. [DOI] [PMC free article] [PubMed] [Google Scholar]
- 15.Watson A.D., Leitinger N., Navab M., Faull K.F., Hörkkö S., Witztum J.L., Palinski W., Schwenke D., Salomon R.G., Sha W. Structural identification by mass spectrometry of oxidized phospholipids in minimally oxidized low density lipoprotein that induce monocyte/endothelial interactions and evidence for their presence in vivo. J. Biol. Chem. 1997;272:13597–13607. doi: 10.1074/jbc.272.21.13597. [DOI] [PubMed] [Google Scholar]
- 16.Johnson W.E., Li C., Rabinovic A. Adjusting batch effects in microarray expression data using empirical Bayes methods. Biostatistics. 2007;8:118–127. doi: 10.1093/biostatistics/kxj037. [DOI] [PubMed] [Google Scholar]
- 17.Bolstad B.M., Irizarry R.A., Astrand M., Speed T.P. A comparison of normalization methods for high density oligonucleotide array data based on variance and bias. Bioinformatics. 2003;19:185–193. doi: 10.1093/bioinformatics/19.2.185. [DOI] [PubMed] [Google Scholar]
- 18.Irizarry R.A., Bolstad B.M., Collin F., Cope L.M., Hobbs B., Speed T.P. Summaries of Affymetrix GeneChip probe level data. Nucleic Acids Res. 2003;31:e15. doi: 10.1093/nar/gng015. [DOI] [PMC free article] [PubMed] [Google Scholar]
- 19.Zhang J., Finney R.P., Clifford R.J., Derr L.K., Buetow K.H. Detecting false expression signals in high-density oligonucleotide arrays by an in silico approach. Genomics. 2005;85:297–308. doi: 10.1016/j.ygeno.2004.11.004. [DOI] [PubMed] [Google Scholar]
- 20.Cheung V.G., Spielman R.S., Ewens K.G., Weber T.M., Morley M., Burdick J.T. Mapping determinants of human gene expression by regional and genome-wide association. Nature. 2005;437:1365–1369. doi: 10.1038/nature04244. [DOI] [PMC free article] [PubMed] [Google Scholar]
- 21.Morley M., Molony C.M., Weber T.M., Devlin J.L., Ewens K.G., Spielman R.S., Cheung V.G. Genetic analysis of genome-wide variation in human gene expression. Nature. 2004;430:743–747. doi: 10.1038/nature02797. [DOI] [PMC free article] [PubMed] [Google Scholar]
- 22.Gargalovic P.S., Gharavi N.M., Clark M.J., Pagnon J., Yang W.P., He A., Truong A., Baruch-Oren T., Berliner J.A., Kirchgessner T.G., Lusis A.J. The unfolded protein response is an important regulator of inflammatory genes in endothelial cells. Arterioscler. Thromb. Vasc. Biol. 2006;26:2490–2496. doi: 10.1161/01.ATV.0000242903.41158.a1. [DOI] [PubMed] [Google Scholar]
- 23.Mungrue I.N., Pagnon J., Kohannim O., Gargalovic P.S., Lusis A.J. CHAC1/MGC4504 is a novel proapoptotic component of the unfolded protein response, downstream of the ATF4-ATF3-CHOP cascade. J. Immunol. 2009;182:466–476. doi: 10.4049/jimmunol.182.1.466. [DOI] [PMC free article] [PubMed] [Google Scholar]
- 24.Korn J.M., Kuruvilla F.G., McCarroll S.A., Wysoker A., Nemesh J., Cawley S., Hubbell E., Veitch J., Collins P.J., Darvishi K. Integrated genotype calling and association analysis of SNPs, common copy number polymorphisms and rare CNVs. Nat. Genet. 2008;40:1253–1260. doi: 10.1038/ng.237. [DOI] [PMC free article] [PubMed] [Google Scholar]
- 25.Purcell S., Neale B., Todd-Brown K., Thomas L., Ferreira M.A., Bender D., Maller J., Sklar P., de Bakker P.I., Daly M.J., Sham P.C. PLINK: A tool set for whole-genome association and population-based linkage analyses. Am. J. Hum. Genet. 2007;81:559–575. doi: 10.1086/519795. [DOI] [PMC free article] [PubMed] [Google Scholar]
- 26.Hochberg Y.B.Y. Controlling the false discovery rate: A practical and powerful approach to multiple testing. J. R. Stat. Soc. Series B Stat. Methodol. 1995;57:289–300. [Google Scholar]
- 27.Duggal P., Gillanders E.M., Holmes T.N., Bailey-Wilson J.E. Establishing an adjusted p-value threshold to control the family-wide type 1 error in genome wide association studies. BMC Genomics. 2008;9:516. doi: 10.1186/1471-2164-9-516. [DOI] [PMC free article] [PubMed] [Google Scholar]
- 28.Rockman M.V., Kruglyak L. Genetics of global gene expression. Nat. Rev. Genet. 2006;7:862–872. doi: 10.1038/nrg1964. [DOI] [PubMed] [Google Scholar]
- 29.Emilsson V., Thorleifsson G., Zhang B., Leonardson A.S., Zink F., Zhu J., Carlson S., Helgason A., Walters G.B., Gunnarsdottir S. Genetics of gene expression and its effect on disease. Nature. 2008;452:423–428. doi: 10.1038/nature06758. [DOI] [PubMed] [Google Scholar]
- 30.Göring H.H., Curran J.E., Johnson M.P., Dyer T.D., Charlesworth J., Cole S.A., Jowett J.B., Abraham L.J., Rainwater D.L., Comuzzie A.G. Discovery of expression QTLs using large-scale transcriptional profiling in human lymphocytes. Nat. Genet. 2007;39:1208–1216. doi: 10.1038/ng2119. [DOI] [PubMed] [Google Scholar]
- 31.Veyrieras J.B., Kudaravalli S., Kim S.Y., Dermitzakis E.T., Gilad Y., Stephens M., Pritchard J.K. High-resolution mapping of expression-QTLs yields insight into human gene regulation. PLoS Genet. 2008;4:e1000214. doi: 10.1371/journal.pgen.1000214. [DOI] [PMC free article] [PubMed] [Google Scholar]
- 32.Su N., Kilberg M.S. C/EBP homology protein (CHOP) interacts with activating transcription factor 4 (ATF4) and negatively regulates the stress-dependent induction of the asparagine synthetase gene. J. Biol. Chem. 2008;283:35106–35117. doi: 10.1074/jbc.M806874200. [DOI] [PMC free article] [PubMed] [Google Scholar]
- 33.Lee J.I., Dominy J.E., Jr., Sikalidis A.K., Hirschberger L.L., Wang W., Stipanuk M.H. HepG2/C3A cells respond to cysteine deprivation by induction of the amino acid deprivation/integrated stress response pathway. Physiol. Genomics. 2008;33:218–229. doi: 10.1152/physiolgenomics.00263.2007. [DOI] [PubMed] [Google Scholar]
- 34.Ohoka N., Yoshii S., Hattori T., Onozaki K., Hayashi H. TRB3, a novel ER stress-inducible gene, is induced via ATF4-CHOP pathway and is involved in cell death. EMBO J. 2005;24:1243–1255. doi: 10.1038/sj.emboj.7600596. [DOI] [PMC free article] [PubMed] [Google Scholar]
- 35.Oskolkova O.V., Afonyushkin T., Leitner A., von Schlieffen E., Gargalovic P.S., Lusis A.J., Binder B.R., Bochkov V.N. ATF4-dependent transcription is a key mechanism in VEGF up-regulation by oxidized phospholipids: Critical role of oxidized sn-2 residues in activation of unfolded protein response. Blood. 2008;112:330–339. doi: 10.1182/blood-2007-09-112870. [DOI] [PMC free article] [PubMed] [Google Scholar]
- 36.Jousse C., Deval C., Maurin A.C., Parry L., Chérasse Y., Chaveroux C., Lefloch R., Lenormand P., Bruhat A., Fafournoux P. TRB3 inhibits the transcriptional activation of stress-regulated genes by a negative feedback on the ATF4 pathway. J. Biol. Chem. 2007;282:15851–15861. doi: 10.1074/jbc.M611723200. [DOI] [PubMed] [Google Scholar]
- 37.Dimas A.S., Deutsch S., Stranger B.E., Montgomery S.B., Borel C., Attar-Cohen H., Ingle C., Beazley C., Gutierrez Arcelus M., Sekowska M. Common regulatory variation impacts gene expression in a cell type-dependent manner. Science. 2009;325:1246–1250. doi: 10.1126/science.1174148. [DOI] [PMC free article] [PubMed] [Google Scholar]
- 38.Dixon A.L., Liang L., Moffatt M.F., Chen W., Heath S., Wong K.C., Taylor J., Burnett E., Gut I., Farrall M. A genome-wide association study of global gene expression. Nat. Genet. 2007;39:1202–1207. doi: 10.1038/ng2109. [DOI] [PubMed] [Google Scholar]
- 39.Stranger B.E., Nica A.C., Forrest M.S., Dimas A., Bird C.P., Beazley C., Ingle C.E., Dunning M., Flicek P., Koller D. Population genomics of human gene expression. Nat. Genet. 2007;39:1217–1224. doi: 10.1038/ng2142. [DOI] [PMC free article] [PubMed] [Google Scholar]
- 40.Myers A.J., Gibbs J.R., Webster J.A., Rohrer K., Zhao A., Marlowe L., Kaleem M., Leung D., Bryden L., Nath P. A survey of genetic human cortical gene expression. Nat. Genet. 2007;39:1494–1499. doi: 10.1038/ng.2007.16. [DOI] [PubMed] [Google Scholar]
- 41.Grundberg E., Kwan T., Ge B., Lam K.C., Koka V., Kindmark A., Mallmin H., Dias J., Verlaan D.J., Ouimet M. Population genomics in a disease targeted primary cell model. Genome Res. 2009;19:1942–1952. doi: 10.1101/gr.095224.109. [DOI] [PMC free article] [PubMed] [Google Scholar]
- 42.Schadt E.E., Molony C., Chudin E., Hao K., Yang X., Lum P.Y., Kasarskis A., Zhang B., Wang S., Suver C. Mapping the genetic architecture of gene expression in human liver. PLoS Biol. 2008;6:e107. doi: 10.1371/journal.pbio.0060107. [DOI] [PMC free article] [PubMed] [Google Scholar]
- 43.Joo H.Y., Zhai L., Yang C., Nie S., Erdjument-Bromage H., Tempst P., Chang C., Wang H. Regulation of cell cycle progression and gene expression by H2A deubiquitination. Nature. 2007;449:1068–1072. doi: 10.1038/nature06256. [DOI] [PubMed] [Google Scholar]
- 44.Cai S.Y., Babbitt R.W., Marchesi V.T. A mutant deubiquitinating enzyme (Ubp-M) associates with mitotic chromosomes and blocks cell division. Proc. Natl. Acad. Sci. USA. 1999;96:2828–2833. doi: 10.1073/pnas.96.6.2828. [DOI] [PMC free article] [PubMed] [Google Scholar]
- 45.Visel A., Rubin E.M., Pennacchio L.A. Genomic views of distant-acting enhancers. Nature. 2009;461:199–205. doi: 10.1038/nature08451. [DOI] [PMC free article] [PubMed] [Google Scholar]
- 46.Helgadottir A., Thorleifsson G., Manolescu A., Gretarsdottir S., Blondal T., Jonasdottir A., Jonasdottir A., Sigurdsson A., Baker A., Palsson A. A common variant on chromosome 9p21 affects the risk of myocardial infarction. Science. 2007;316:1491–1493. doi: 10.1126/science.1142842. [DOI] [PubMed] [Google Scholar]
- 47.McPherson R., Pertsemlidis A., Kavaslar N., Stewart A., Roberts R., Cox D.R., Hinds D.A., Pennacchio L.A., Tybjaerg-Hansen A., Folsom A.R. A common allele on chromosome 9 associated with coronary heart disease. Science. 2007;316:1488–1491. doi: 10.1126/science.1142447. [DOI] [PMC free article] [PubMed] [Google Scholar]
- 48.Choy E., Yelensky R., Bonakdar S., Plenge R.M., Saxena R., De Jager P.L., Shaw S.Y., Wolfish C.S., Slavik J.M., Cotsapas C. Genetic analysis of human traits in vitro: Drug response and gene expression in lymphoblastoid cell lines. PLoS Genet. 2008;4:e1000287. doi: 10.1371/journal.pgen.1000287. [DOI] [PMC free article] [PubMed] [Google Scholar]
- 49.Pastinen T., Ge B., Hudson T.J. Influence of human genome polymorphism on gene expression. Hum. Mol. Genet. 2006;15(Spec No 1):R9–R16. doi: 10.1093/hmg/ddl044. [DOI] [PubMed] [Google Scholar]
- 50.Leitinger N. Oxidized phospholipids as modulators of inflammation in atherosclerosis. Curr. Opin. Lipidol. 2003;14:421–430. doi: 10.1097/00041433-200310000-00002. [DOI] [PubMed] [Google Scholar]
- 51.Drake T.A., Hannani K., Fei H.H., Lavi S., Berliner J.A. Minimally oxidized low-density lipoprotein induces tissue factor expression in cultured human endothelial cells. Am. J. Pathol. 1991;138:601–607. [PMC free article] [PubMed] [Google Scholar]
- 52.Birukova A.A., Chatchavalvanich S., Oskolkova O., Bochkov V.N., Birukov K.G. Signaling pathways involved in OxPAPC-induced pulmonary endothelial barrier protection. Microvasc. Res. 2007;73:173–181. doi: 10.1016/j.mvr.2006.12.004. [DOI] [PMC free article] [PubMed] [Google Scholar]
- 53.Vasques E., Almeida A.L., Noya V., D'Alegria B., Marathe G., McIntyre T.M., Tibiriçá E., Bozza P.T., Silva A.R., Castro-Faria-Neto H.C. Impairment of endothelium-dependent aorta relaxation by phospholipid components of oxidized low-density lipoprotein. Endothelium. 2006;13:1–8. doi: 10.1080/10623320600659948. [DOI] [PubMed] [Google Scholar]
- 54.Bochkov V.N., Philippova M., Oskolkova O., Kadl A., Furnkranz A., Karabeg E., Afonyushkin T., Gruber F., Breuss J., Minchenko A. Oxidized phospholipids stimulate angiogenesis via autocrine mechanisms, implicating a novel role for lipid oxidation in the evolution of atherosclerotic lesions. Circ. Res. 2006;99:900–908. doi: 10.1161/01.RES.0000245485.04489.ee. [DOI] [PubMed] [Google Scholar]
- 55.Lee S., Li R., Kim B., Palvolgyi R., Ho T., Yang Q.Z., Xu J., Szeto W.L., Honda H., Berliner J.A. Ox-PAPC activation of PMET system increases expression of heme oxygenase-1 in human aortic endothelial cell. J. Lipid Res. 2009;50:265–274. doi: 10.1194/jlr.M800317-JLR200. [DOI] [PMC free article] [PubMed] [Google Scholar]
- 56.Fahmi S., Yang C., Esmail S., Hobbs H.H., Cohen J.C. Functional characterization of genetic variants in NPC1L1 supports the sequencing extremes strategy to identify complex trait genes. Hum. Mol. Genet. 2008;17:2101–2107. doi: 10.1093/hmg/ddn108. [DOI] [PMC free article] [PubMed] [Google Scholar]
- 57.Cordell H.J. Genome-wide association studies: Detecting gene-gene interactions that underlie human diseases. Nat. Rev. Genet. 2009;10:392–404. doi: 10.1038/nrg2579. [DOI] [PMC free article] [PubMed] [Google Scholar]
Associated Data
This section collects any data citations, data availability statements, or supplementary materials included in this article.