

Abstract
It is now understood that epigenetic alterations occur frequently in sporadic breast carcinogenesis, but little is known about the epigenetic alterations associated with familial breast tumors. We performed genome-wide DNA-methylation profiling on familial breast cancers (n = 33) to identify patterns of methylation specific to the different mutation groups (BRCA1, BRCA2, and BRCAx) or intrinsic subtypes of breast cancer (basal, luminal A, luminal B, HER2-amplified, and normal-like). We used methylated DNA immunoprecipitation (MeDIP) on Affymetrix promoter chips to interrogate methylation profiles across 25,500 distinct transcripts. Using a support vector machine classification algorithm, we demonstrated that genome-wide methylation profiles predicted tumor mutation status with estimated error rates of 19% (BRCA1), 31% (BRCA2), and 36% (BRCAx) but did not accurately predict the intrinsic subtypes defined by gene expression. Furthermore, using unsupervised hierarchical clustering, we identified a distinct subgroup of BRCAx tumors defined by methylation profiles. We validated these findings in the 33 tumors in the test set, as well as in an independent validation set of 47 formalin-fixed, paraffin-embedded familial breast tumors, by pyrosequencing and Epityper. Finally, gene-expression profiling and SNP CGH array previously performed on the same samples allowed full integration of methylation, gene-expression, and copy-number data sets, revealing frequent hypermethylation of genes that also displayed loss of heterozygosity, as well as of genes that show copy-number gains, providing a potential mechanism for expression dosage compensation. Together, these data show that methylation profiles for familial breast cancers are defined by the mutation status and are distinct from the intrinsic subtypes.
Introduction
Breast cancer (MIM 11448) is one of the most common cancers in the Western world, affecting one in ten women during their lifetime.1 Mutations in the known breast cancer susceptibility genes, including BRCA1 (MIM 113705) and BRCA2 (MIM 600185), account for approximately only 25% of familial breast tumors.2 Expression profiling has shown that breast cancers fall into five intrinsic subtypes: luminal A, luminal B, HER2-amplified, basal, and normal-like.3 Most BRCA1-related tumors are of the basal subtype.4 However, we have shown that there is considerable heterogeneity among familial breast tumors, with almost all five subtypes being found in each mutation class.5
Epigenetic processes include DNA methylation, histone modifications, chromatin structure, and noncoding RNA-mediated regulation of gene expression.6 Historically, DNA-methylation studies in cancer have revealed both hypermethylation of promoter CpG islands and hypomethylation of repetitive DNA sequences.7 There are over 90 candidate genes reported throughout the literature as promoter hypermethylated in breast cancers (Pubmeth web resource). More recently, DNA-methylation alterations have been studied in breast tumor tissue on a genome-wide scale, revealing hypermethylated as well as hypomethylated loci, compared to matched adjacent tissues.8,9 Novak et. al.9 interrogated 16 unselected breast tumors, five normal breast specimens, and several breast cancer cell lines with Affymetrix promoter arrays and identified 2033 hypermethylated and 1473 hypomethylated regions in the tumors, compared to the whole sections of normal breast. Most of the differentially methylated regions were recurrent, 90% of them occurring in at least five tumors. Both the hyper- and hypomethylated regions were also clustered in regions of long-range epigenetic silencing (LRES)10 and were frequently found at gene family clusters, including the proto-cadherin gene cluster on chromosome 5.9,11 Ordway et al.8 evaluated nine infiltrating ductal breast carcinomas and matching normal tissue with custom promoter-methylation microarrays and identified 220 loci that distinguished tumor from normal tissue. Five of these loci were validated in a series of 230 clinical samples, and some showed considerable promise as biomarkers.8 Promoter-tiling arrays have also been used to evaluate a cell-line model of breast cancer metastasis and have identified differential methylation in genes involved in epithelial-mesenchymal transition and tumor cell migration.12
One previous study suggested that hereditary breast cancers have methylation similar to that of sporadic tumors in ten candidate genes.13 However, a more recent study investigated 11 candidate genes (five overlapping with the previous study) and suggested that BRCA1-related breast cancers have less methylation than sporadic breast cancers.14 To our knowledge, no study has yet performed genome-wide methylation analysis on familial breast cancers or looked for methylation differences between familial breast tumor mutation classes. Therefore, we sought to use genome-wide DNA-methylation profiling of familial breast cancer cases to identify patterns of methylation specific to the different mutation groups (BRCA1, BRCA2, non-BRCA1/2 [BRCAx]), which may provide clinically relevant diagnostic value. The same tumor DNA samples have been analyzed by gene-expression profiling and copy-number analysis,5 allowing for the first time a comprehensive integrated genomic analysis of familial breast tumors.
Material and Methods
Patient Material
For DNA-methylation microarray analysis, we analyzed 33 fresh frozen familial tumors, including BRCA1 (n = 11), BRCA2 (n = 8), and BRCAx (n = 14) tumors. Characteristics of these tumors have been described in more detail elsewhere.5 The tumors were collected by the Kathleen Cunningham Foundation for Research into Breast Cancer (kConFab), a consortium which ascertains multiple-case breast cancer families.15 Ethical approvals for recruitment were obtained from the institutional review boards or ethics committees at all of the sites. Written informed consent was obtained from each participant. The BRCAx tumors came from women from high-risk families ascertained by kConFab, and in each case the tumor donor had undergone full BRCA1/2 mutation testing by full sequencing and multiplex ligation-dependant probe amplification. The additional validation set of formalin-fixed paraffin embedded (FFPE) tumors consisted of BRCA1 (n = 14), BRCA2 (n = 13), and BRCAx (n = 20) tumors from kConFab. All specimens were evaluated by a pathologist for percentage of neoplasia prior to DNA isolation and were selected for DNA analyses if they were > 75% tumor after needle macrodissection. DNA was extracted by standard salt extraction and phenol-chloroform protocol. Estrogen receptor (ESR1 [MIM 133430]), progesterone receptor (PGR [MIM 607311]), and HER2 (ERBB2 [MIM 164870]) status, grade, and tumor type were available from clinical records (Table S1, available online).
CGI Methylation Profiling
We performed microarray-based DNA-methylation analysis by using methylated DNA immunoprecipitation (MeDIP) on high-density Affymetrix tiling microarrays.16 MeDIP was performed with the Diagenode MeDIP kit according to the manufacturer's protocol (Diagenode, Leige, Belgium). The Affymetrix GeneChip Human Promoter 1.0R Array comprises over 4.6 million probes tiled at an average resolution of 35 bp, covering approximately 10 kb around 25,500 transcription start sites (Affymetrix, High Wycombe, UK). We performed triplicate MeDIP reactions for each tumor and amplified them via whole-genome amplification with Genomiphi V2 according to the manufacturer's protocol (GE Healthcare). The triplicates were then pooled for one MeDIP array and one input array per sample. The arrays were hybridized with the use of Affymetrix hybridization reagents, with an Affymetrix hybridization oven, and stained and washed with the use of the Fluidics Station 450 (Affymetrix, High Wycombe, UK). Arrays were scanned with the GeneChip Scanner 3000 7G with autoloader. Raw data were extracted with the GeneChip Operating System (GCOS) software from Affymetrix.
qPCR Validation
Quality control of the MeDIP samples prior to microarray analysis was performed via quantitative PCR (qPCR)-based analysis of enrichment with the use of primers to “spiked in” and inherent controls provided with the Diagenode MeDIP kit. These included methylated sequence controls (human Alpha satellite and in vitro methylated Arabidopsis DNA) and unmethylated controls (human GAPDH promoter [MIM 138400] and unmethylated Arabidopsis DNA). qPCR was performed with an Eppendorf realtime PCR machine, and the reaction mix contained 1× SYBR green master mix (Applied Biosystems, Foster City, USA) and 0.5 mM each of forward and reverse primers in a volume of 30 μL. PCR cycling consisted of 95°C for 10 min, then 40 cycles of 95°C for 30 s, 60°C for 60 s, followed by a meltcurve analysis.
Bisulphite Sequencing
We have used both pyrosequencing and Epityper-based analysis for validation of DNA-methylation differences. Epityper was used to cover long segments of DNA, covering up to 50 CpG sites per gene. Pyrosequencing was used for shorter assays over higher-density CpG regions (4–9 CpG sites). All primers used in this study are presented in Table S2. DNA samples were bisulphite converted with the EZ-96 DNA Methylation-Gold kit according to the manufacturer's protocol (Zymo Research, Orange, CA).
Pyrosequencing
All pyrosequencing assays were designed with the PyroQ assay-design software. A common tag was placed on either the forward or the reverse primer (depending on the strand to be sequenced), and a common universal biotinylated primer was used for all reactions as previously described.17 PCR cycling conditions were performed as previously described.18 All assays were optimized with fully methylated gDNA (100%) (Zymo Research) compared to unmethylated gDNA (0%, whole-genome amplified DNA [GE Healthcare]). All products were confirmed to be single bands by agarose gel electrophoresis. Methylation values were calculated as an average of all CpG sites within each assay as determined by the Pyro Q-CpG software (Biotage, Uppsala, Sweden).
Epityper
Bisulphite-treated DNA (1 μL) was used in a 5 μl PCR reaction with the use of 0.2 μM′T7-promoter-tagged reverse primer, 0.2 μM 10-mer-tagged forward primer, 1.5 mM MgCl2, 200 μM dNTP mix, 1× FastStart Taq DNA Polymerase PCR Buffer (Roche Applied Science, Penzberg, Germany), and 0.4 U FastStart Taq DNA polymerase (Roche Applied Science, Penzberg, Germany). The PCR cycling conditions were 4 min at 94°C, followed by 9 cycles of 94°C for 20 s, 72°C to 62°C (−1°C per cycle) for 30 s, and 72°C for 1 min, followed by an additional 36 cycles at 62°C annealing temperature. Random products were visualized on a 1% agarose gel to confirm single-band amplification. After Shrimp Alkaline Phosphatase (SAP) treatment, PCR products were subjected to T cleavage transcription and RNase A cleavage according to the EpiTYPER Application Guide (Sequenom, San Diego, CA), spotted onto a SpectroCHIP array, and analyzed with the MassARRAY Compact System MALDI-TOF mass spectrometer (Sequenom, San Diego, CA). Data were analyzed with EpiTYPER software (Sequenom, San Diego, CA). Primers were designed with EpiDesigner (Sequenom, San Diego, CA).
Statistical Analysis
DNA-Methylation Profiling with MeDIP Data
Raw data were analyzed with the MAT algorithm, which models the baseline probe behavior and normalizes the probe t-value score according to a probe-sequence-based model, taking into account the MeDIP and input probe values.19 For transcription start-site analysis, the MAT output t-values were combined for each start site (obtained from USCS Genome Browser build 36) ± 250 bp around each start site (n = 20527 unique transcripts). These were subdivided into low-CpG-content promoters (LCPs, n = 5997), intermediate-CpG-content promoters (ICPs, n = 4544), and high-CpG-content promoters (HCPs, n = 9986) as previously described.16 In brief, HCPs (high-CpG promoters) contain a CpG ratio above 0.75 and GC content above 55%, LCPs (low-CpG promoters) contain a CpG ratio below 0.48, and ICPs (intermediate-CpG promoters) are neither HCPs nor LCPs. These were further filtered to the genes that were represented by both MeDIP and gene-expression data sets to 16237 genes (LCPs, n = 4738; ICPs, n = 3517; HCPs, n = 7982). Support vector machine learning was performed with the MLInterfaces package. In brief, the MLearn algorithm uses 5-fold balanced cross validation, using 80% of the data as a training set to predict the remaining 20% of the data, through five iterations, resulting in a prediction for each tumor in the data set. We used equal numbers of tumors from each mutation group (n = 8) or intrinsic subtype (n = 10) for each of the multiple iterations. The predictions presented are an average of ten permutations of sample selections of the BRCA1 (8/11) and BRCAx (8/14) tumors compared to the BRCA2 (8/8) tumors or basal (10/14) and luminal A (10/10) tumors. Significance of hierarchical clusters was calculated with the R package “pvclust,” which computes an approximate unbiased p value for clusters by using a multiscale bootstrap resampling method.20 Pvclust was performed with n = 1000 bootstrap with all genes or with n = 10,000 with ∼1700 most-variable loci, with similar results. Significant clusters were identified with a p value < 0.001. Gene set enrichment analysis (GSEA) was performed as previously described via the preranked gene list approach21. “Core enrichment” describes the leading edge of the plot representing the genes that are most enriched. Autocorrelation analysis (acf) was used for determining correlation between neighboring genes to look for genome-wide evidence of long-range epigenetic silencing. The frequency of high methylation in tumors (percentage of tumors with MeDIP t-value > 0.5) was calculated for each gene, and all genes were ordered by their chromosome location, such that each gene was next to its nearest gene irrespective of the distance between them. Only one representative transcription start site was used for genes with multiple start sites.
Pyrosequencing and Epityper Data
A Wilcoxon signed rank sum test was used to determine statistical significance between groups for all pyrosequencing or Epityper DNA-methylation data.
Results
DNA-Methylation Profiles Are Defined by Mutation Status
In this study, we performed genome-wide DNA-methylation analysis by using MeDIP on Affymetrix human promoter tiling arrays (1.0R) that cover over 25,500 individual promoters. We assayed 33 familial breast tumors (11 with BRCA1 mutations, 8 with BRCA2 mutations, and 14 from non-BRCA1/2 families [BRCAx]) to investigate the contribution of mutation status to the tumor DNA-methylation profile. These tumors have also been profiled with the Illumina gene expression and SNP-CGH array for copy numbers, thus allowing comparisons across all three platforms on the same samples.5 Tumor information, including hormone receptor status, stage, and intrinsic phenotypic subtype, is provided in Table S1. Validation of MeDIP enrichment before and after amplification was performed via qPCR for methylated and unmethylated controls, and the correlation between MeDIP t-value and methylation percentage was assessed by pyrosequencing for four genes: DHX33 (methylated [GeneID: 56919]), GRHL2 (unmethylated [MIM 608576]), IGF2 DMR0 (imprinted [MIM 147470]), and RASSF1A (frequently methylated in breast cancer [MIM 605082]) (Figure S1). These controls show good correlation between the absolute methylation percentage and the average MeDIP t-values provided by the microarray (R2 > 0.5, p < 0.0001). Interestingly, 15 of 33 tumors (45%) showed loss of imprinting (LOI) at IGF2 DMR0 with the use of a previously reported cutoff of < 35% methylation for sporadic breast cancers.22
Both gene-expression and DNA-methylation profiles were analyzed to identify the number of genes that could differentiate the mutation subgroups or the intrinsic subtypes (Figure 1A). For mutation-status groups, with comparison of BRCA1 tumors to BRCA2 and BRCAx tumors, the methylation profiles identified 822 significant genes (false discovery rate [FDR]-corrected p < 0.05, F-test), compared to only 47 significant (FDR-corrected p < 0.05, F-test) genes identified in the gene-expression profiles. When these data were broken down to promoter classes on the basis of the CpG ratio (defined previously16 and in Material and Methods; Figure S2), we observed that high-density CpG island promoters contribute most to the differences among mutation groups (p = 7.15 × 10−37, chi-square test), whereas gene-expression profiles, on the other hand (with only 47 significant genes), were not biased (p = 0.517, chi-square test). In contrast to the mutation groups, analysis of intrinsic subtypes identified 2811 genes that were significantly different (FDR-corrected p < 0.05, F-test) in the gene-expression profiles between basal and luminal A breast tumors, but the MeDIP methylation profiles did not identify any significant (FDR-corrected p < 0.05) differences between basal or luminal breast tumors.
Figure 1.

DNA-Methylation Profiles of BRCA1, BRCA2, and BRCAx Tumors
(A) Percentage of genes that pass the FDR-corrected p value cutoff of p < 0.05 in an F-test testing for differences among mutation subgroups (BRCA1 versus BRCA2 versus BRCAx) or for intrinsic subtypes (basal versus luminal A) across all genes. DNA-methylation data (MeDIP) was compared to gene-expression microarray data (GEM) for all genes or was broken down into LCPs, ICPs, and HCPs (see Figure S2). For mutation-status groups, the methylation profiles identified 822 significant (FDR-corrected p < 0.05) genes (112, 124, 586 for LCP, ICP, and HCP, respectively) compared to 47 significant (FDR-corrected p < 0.05) genes (11,13, 23) in the gene-expression profiles. The significant genes in the MeDIP profiles are biased toward the HCPs (p = 7.15 × 10−37, chi-square test), whereas the GEM profiles are not (p = 0.517, chi-square test). For intrinsic subtypes, the gene-expression profiles identify 2811 significant (FDR-corrected p < 0.05) genes (606, 634, 1571 for LCP, ICP, and HCP, respectively), whereas the methylation profiles did not identify any significant (FDR-corrected p < 0.05) differences.
(B) Heatmap and clustering of 822 significant (FDR-corrected p < 0.05) differences between 33 tumors representing mutation subgroups indicated on the right index—BRCA1 (red, n = 11), BRCA2 (green, n = 8), and BRCAx (blue, n = 14)—reveal a distinct cluster of BRCA1 tumors compared to BRCA2 and BRCAx tumors. BRAC2 and BRCAx tumors do not divide into separate clusters. The index on the left shows the intrinsic subtypes basal (red, n = 14), luminal A (blue, n = 10), luminal B (green, n = 4), HER2 (yellow, n = 4), and normal-like (gray, n = 1).
(C) Bisulphite-sequencing analysis of RASSF1A, SGK1, LRRC55, LHCGR, and PKD2 in 33 fresh frozen tumors. The median methylation levels are indicated by the red line. Genomic locations for the regions presented are from UCSC human March 2006 assembly (hg18). Stars indicate statistically significant differences between groups at p < 0.05 and p < 0.01 as indicated (Wilcoxon signed-rank sum test).
(D) Validation of methylation differences in RASSF1A, SGK1, LRRC55, LHCGR, and PKD2 in the 47 FFPE breast tumor DNA samples.
We further validated this finding by using a support vector machine (svm) classification algorithm to predict the mutation status or intrinsic subtype on the basis of either the gene-expression profiles or the MeDIP methylation profiles (Table 1). This algorithm contains a balanced 5-fold cross-validation system, which uses 80% of the data as a training set to predict the remaining 20% of the data, through five iterations, resulting in a prediction for each tumor in the data set. As expected, gene-expression data correctly predicts intrinsic subtype with 100% accuracy, and it predicts BRCA1 mutation with 90% accuracy, mainly because of the fact that BRCA1 tumors are also predominantly basal tumors. The GEM also predicts BRCA2 tumors correctly 55% of the time. However, the gene-expression profiles fail to predict BRCAx tumors. This is consistent with previous studies.23 Conversely, the MeDIP methylation profiles fail to predict the intrinsic subtypes, but prediction of mutation classes is improved by consideration of MeDIP methylation profiles. Methylation pattern predicted BRCA1, BRCA2, and BRCAx tumors with estimated error rates of 19%, 31%, and 36%, respectively, which is more accurate than the prediction error rates from gene-expression profiles (11%, 44%, 71% for BRCA1, BRCA2, and BRCAx, respectively). The most interesting improvement is the marked increase in prediction of BRCAx tumors: from 71% error with gene-expression profiling (more than would be expected by chance; 66% error), down to 36% with methylation profiling. This can be also represented as the percentage gain that is the improvement of the prediction over random chance (percentage expected), which shows a 30% gain for MeDIP prediction of BRCAx in comparison to the 4.5% loss of prediction over random chance for gene-expression predictions.
Table 1.
Genome-wide Methylation Profiles Predict Mutation Status, and Gene-Expression Profiles Predict Intrinsic Subtype
| MeDIP | Predicted | ||||||
|---|---|---|---|---|---|---|---|
| Given | BRCA1 | BRCA2 | BRCAx | Error (%) | Predicted (%) | Expected (%) | Gain (%) |
| BRCA1 | 6.5 | 0.6 | 1.2 | 18.8 | 81.3 | 33.3 | 47.9 |
| BRCA2 | 0.8 | 5.5 | 1.7 | 31.3 | 68.8 | 33.3 | 35.4 |
| BRCAx | 0.8 | 2.7 | 5.1 | 36.3 | 63.8 | 33.3 | 30.4 |
| MeDIP | Predicted | ||||||
| Given | Basal | LumA | Error (%) | Predicted (%) | Expected (%) | Gain (%) | |
| Basal | 5.8 | 4.3 | 42.0 | 58.0 | 50.0 | 8.0 | |
| LumA | 5 | 5.1 | 49.0 | 51.0 | 50.0 | 1.0 | |
| GEM | Predicted | ||||||
| Given | BRCA1 | BRCA2 | BRCAx | Error (%) | Predicted (%) | Expected (%) | Gain (%) |
| BRCA1 | 7.1 | 0.9 | 0 | 11.3 | 88.8 | 33.3 | 55.4 |
| BRCA2 | 0.3 | 4.5 | 3.2 | 43.8 | 56.3 | 33.3 | 22.9 |
| BRCAx | 1.9 | 3.8 | 2.3 | 71.3 | 28.8 | 33.3 | −4.6 |
| GEM | Predicted | ||||||
| Given | Basal | LumA | Error (%) | Predicted (%) | Expected (%) | Gain (%) | |
| Basal | 10 | 0 | 0.0 | 100.0 | 50.0 | 50.0 | |
| LumA | 0 | 10 | 0.0 | 100.0 | 50.0 | 50.0 | |
Support vector machine learning prediction of mutation status or intrinsic subtype based on methylation profiles (MeDIP) or gene-expression profiles (GEM). Analysis of MeDIP data was performed on a random selection of 24 tumors (eight from each group), and the numbers presented are an average of ten permutations of sample selections, such that all tumors were used in the analysis. These numbers do not always add up to 8, as a result of the averaging across the ten permutations. GEM analysis was performed on a random selection of 20 tumors (ten from each group), and the numbers presented are an average of ten permutations of sample selections, such that all tumors were used in the analysis. Analysis could be performed only on the two largest groups (basal and luminal A). Gain percentage represents the improvement of the prediction over random chance (percentage expected).
Hierarchical clustering of promoter methylation patterns of the 822 genes that defined the mutation groups shows a distinct group of BRCA1 tumors and a less-defined cluster of BRCA2 and BRCAx tumors (Figure 1B). We performed pyrosequencing-based and MALDI-TOF-based (Epityper) methylation analysis for eight of these genes, including one frequently hypermethylated gene, RASSF1A, and seven additional genes (SGK1 [MIM 602958], LRRC55 [GeneID: 219527], LHCGR [MIM 152790], PKD2 [MIM 173910], GRAMD1C [GeneID: 54762], DA103059 [hypothetical], and HTR6 [MIM 601109]) in the 33 frozen tumor samples from the test set. These genes were picked from the list of 822 genes that defined the mutation groups. Five of these eight genes (RASSF1A, SGK1, LRRC55, LHCGR, and PKD2) showed statistically significant differences between mutation groups in the original test set (n = 33) (Figure 1C) and, even more so, in the validation set of FFPE tumors (n = 47) (Figure 1D). The only genes that were not validated in the FFPE tumor panel were GRAMD1C, DA103059, and HTR6 (Figure S3). The LHCGR gene was analyzed by both pyrosequencing and Epityper, with good correlation over the overlapping sequence (r2 = 0.689, p < 0.0001).
DNA-Methylation Profiles Define BRCAx Subgroups
Given that BRCA1 breast tumors showed a specific methylation profile, we examined the methylation patterns in BRCAx tumors to determine whether subgroups could be delineated that might reflect germline mutations in the same genes or pathways. Using unsupervised hierarchical clustering of the 14 BRCAx tumor samples across all 16237 genes with a multiscale bootstrap resampling, we identified a subgroup of five tumors that significantly clustered together (p < 0.0001) (Figures 2A and 2B). These five tumors included two basal tumors, two luminal A tumors, and one luminal B tumor, suggesting that this cluster is not defined by the intrinsic subtypes. We identified 156 genes that significantly differentiate this group, designated BRCAx-a, from the remaining nine tumors, which are designated BRCAx-b (Table S3). We validated three of these genes, HTR6, LHCGR, and GEMIN8 (GeneID: 54960), in both tumor panels (Figures 2C and 2D). In the fresh frozen tumor panel (n = 33), we observed a significant increased methylation in the BRCAx-b group (median methylation of 47.9%) as compared to the BRCAx-a group (12.3%) (p = 0.016, t test) in the promoter CpG island of the LHCGR gene. In the HTR6 gene, we observed regions of significantly higher methylation in the BRCAx-b group (57.8%) as compared to the BRCAx-a group (34.5%). In GEMIN8, we observed significantly increased methylation in the BRCAx-a group (15.9%) as compared to the BRCAx-b group (6.5%). We were unable to clearly define two subgroups in the FFPE tumor panel (n = 47) on the basis of these three genes alone; however, we did observe bimodal distribution of methylation in each of these genes potentially indicative of different groups (Figure 2D).
Figure 2.
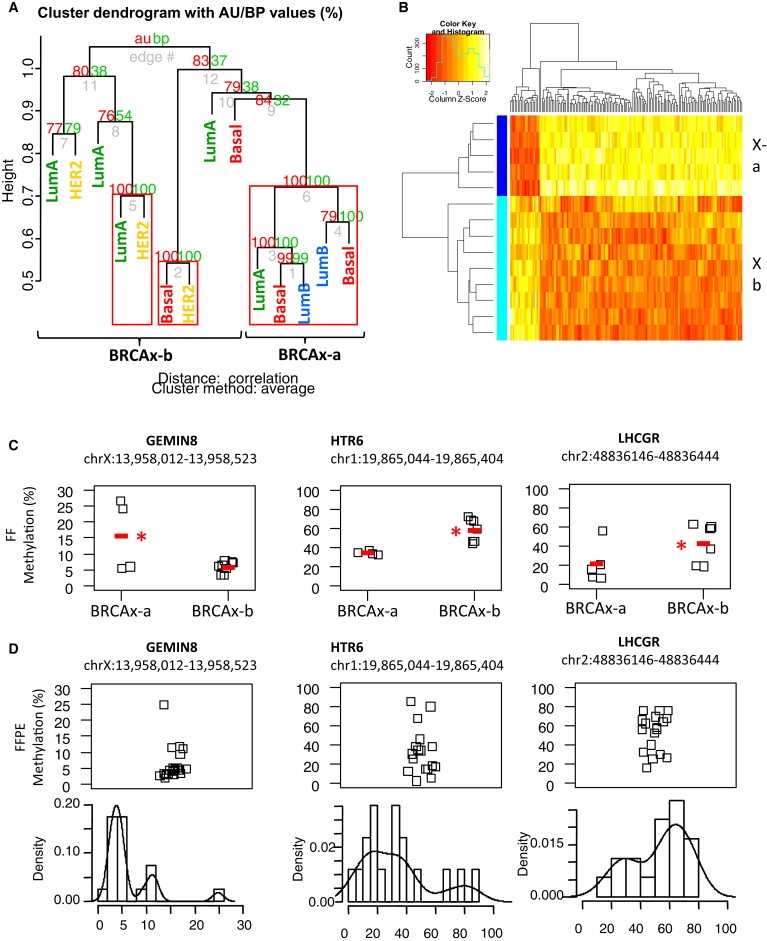
Methylation Profiling Reveals a Distinct Subgroup of BRCAx Tumors
(A) Unsupervised heirarchical clustering of the 14 BRCAx tumor samples across all 16237 genes using multiscale bootstrap resampling to generate p values for clusters (pvclust). Clusters with p < 0.0001 are boxed in red. Samples are labeled with their intrinsic subtype to show that the groupings are not related to the tumor phenotype.
(B) Heatmap and clustering of 156 significant (p.fdr < 0.05) differences between the BRCAx-a subgroup (dark blue) compared to the remaining tumors (pale blue, termed BRCAx-b) shows that the majority of differences (136/156) are increases in methylation in BRCAx-b. The full list of genes is presented in Table S2.
(C) Bisulphite sequencing validation of GEMIN8, HTR6 and LHCGR comparing BRCAx-a subgroup to the BRCAx-b subgroup. The median methylation levels are indicated by the red line. Genomic locations for the regions presented are from Human Mar. 2006 Assembly (hg18). Stars indicate statistically significant differences between groups at p < 0.05 and p < 0.01 as indicated, wilcoxon signed rank sum test.
(D) Validation of methylation differences in GEMIN8, HTR6 and LHCGR in 47 formalin fixed paraffin embedded breast tumor DNA samples. Distribution histograms are presented below to show the bimodal distribution of methylation for these genes.
Validation of Previous Findings in Sporadic Breast Cancer
Until recently, the majority of DNA-methylation studies have identified individual genes or small sets of candidate genes that are hypermethylated in breast cancers with varying frequencies. With our genome-wide data, we were able to validate previous findings such as hypermethylation of various candidate genes in breast cancer and regions of long-range epigenetic silencing (LRES) and to perform fine mapping of regions of hypermethylation.
Using gene set enrichment analysis, we investigated a list of genes that were previously identified as hypermethylated in breast cancer in greater than 20% of tumors and that were also represented on the microarray (n = 72 (Figures 3A and 3B, Table S4). The reported hypermethylated genes are indeed enriched in the MeDIP microarray analysis (p = 0.042), and we identified 38 genes in the core enrichment that are most frequently methylated in the familial breast cancers (Table S4), with the strongest enrichment in BRCA1 tumors (p = 0.044). We identified the genes, including HRAS (MIM 190020), CXCL1 (MIM 155730), GREM1 (MIM 603054), CDCP1 (MIM 611735), and RB1 (MIM 180200), from this list that significantly differentiate the mutation subgroups (Figures 3C and 3D), and we have presented detailed Epityper-based validation of the Gremlin 1 gene (GREM1) (Figure 3E). In this gene, we observed higher methylation in the BRCA2 (median methylation 30.8%) and BRCAx (25.8%) tumors as compared to the BRCA1 tumors (19.9%).
Figure 3.
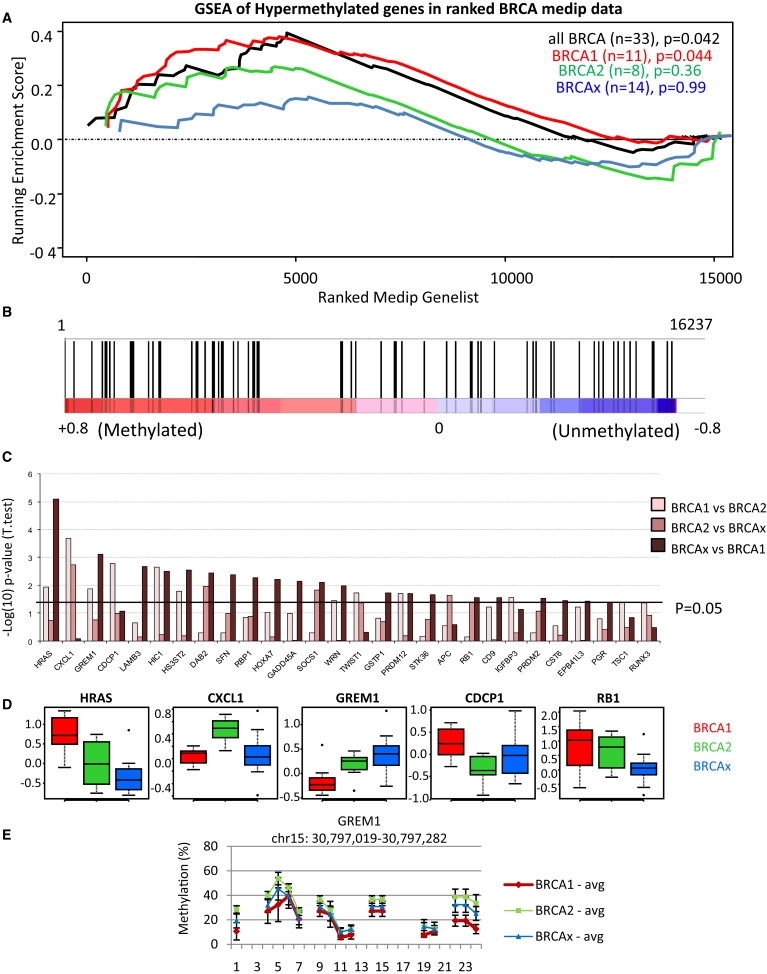
Validation of Previously Identified Hypermethylated Genes in Breast Cancer
(A) GSEA comparing a list of genes that are commonly hypermethylated in breast cancers (n = 72) to the 16237 genes preranked on MeDIP t-values averaged across all tumors (black line), or separated into BRCA1 (red), BRCA2 (green), or BRCAx (blue) tumors. The nominal p value estimates the statistical significance of the enrichment score for a single gene set using a random permutation of the gene list.
(B) GSEA of all breast tumors (black line in Figure 4A) showing each of the 72 genes represented by black bars. This analysis shows enrichment (p = 0.042) of the hypermethylated genes across the whole data set, with a core set of 38 genes significantly enriched (p < 0.0001) among the frequently methylated genes (core hypermethylated genes; Table S3).
(C) t test for intergroup analyses comparing BRCA1 to BRCA2, BRCA2 to BRCAx, or BRCAx to BRCA1, presented as −log(10) p values. Bars above 1.3 (p = 0.05) indicate significant differences in methylation among the groups for 28 of these genes.
(D) Representative examples of genes that differentiate tumors on the basis of mutation status. MeDIP t-values are presented as box and whisker plots representing median (center line), interquartile range (box), and 95th percentiles (whisker), and samples outside this range are represented as points.
(E) Epityper validation of GREM1 comparing 33 familial breast tumors representing mutation subgroups BRCA1 (red, n = 11), BRCA2 (green, n = 8), and BRCAx (blue, n = 14). Presented is the mean methylation at each CpG site (or CpG cluster) across the amplicon (± SEM). The line between sites indicates contiguous CpG sites. Genomic location for the region presented is from the UCSC human March 2006 assembly (hg18).
LRES has been reported previously in sporadic breast cancer and in colorectal cancer (MIM 114500) and suggests that there may be a relationship between frequently methylated genes in gene family clusters or on nearby chromosomal locations.9,11 We used an autocorrelation analysis to look for genome-wide evidence of LRES in familial breast tumors. We show that there are over 1500 genes that are frequently methylated (MeDIP t-value > 0.5) in more than 30% of tumors (n = 33; Figure 4A) and that there is a statistically significant autocorrelation between any gene and up to three of its nearest neighbors (Figure 4B).
Figure 4.

Autocorrelation between Frequently Methylated Genes in Familial Breast Cancer
(A) Histogram of the frequency of methylation in tumors (percentage of tumors with MeDIP t-value > 0.5) across all unique genes, showing 1581 genes methylated in > 30% of tumors.
(B) All genes were ordered by their chromosome location, such that each gene was next to its nearest gene. Only one representative transcription start site was used for genes with multiple start sites. Autocorrelation analysis of the frequencies of methylation for each gene shows increased autocorrelation (>95% confidence interval, blue dotted line) between any gene and its next three neighboring genes, showing evidence for LRES in clusters up to four genes.
The high-density array allows for fine mapping of DNA-methylation differences with the use of a probe-wise analysis, and we have used this approach to validate ESR1 (ERα) methylation. Previous studies have shown that five individual CpG dinucleotides in the ESR1 promoter were more methylated in BRCA1 tumors as compared to ER-negative tumors and have suggested that this may be an important factor in transcriptional repression of this gene in BRCA1-linked breast cancers.24 We have mapped the critical region of hypermethylation in BRCA1-linked ER-negative tumors to a 147 bp region (region 2) of the CpG island containing 20 CpG sites (chr6:152171256–152171402; NCBI build 36.1) (Figure S4). We further validated this in our samples by using pyrosequencing, showing median methylation of 10.6% in BRCA1 ER-negative tumors, as compared to 7.5% in the other ER-negative tumors (p = 0.0056).
Integration of Methylation, Copy-Number, and Gene-Expression Data
This data set represents, to our knowledge, the first fully integrated analysis of familial breast tumors with genome-wide DNA-methylation, copy-number, and gene-expression data. For each tumor, every gene was scored as overlapping with regions of homozygous deletion (HD), loss of heterozygosity (LOH), copy-neutral LOH, copy gains (GAIN), or no change (diploid) in that tumor. For each gene, the median MeDIP t-value was then calculated from tumors in each of the five copy-number groups (if present) with the use of the diploid tumors as a reference level for that gene (Figure 5). Hierarchical clustering identified two groups of genes, the first containing both LOH and high methylation in tumors and the second containing copy-number gains and high methylation in tumors (Figure 5A). This was observed in 607/4921 (12.3%) genes with LOH and in 1032/9070 (11.4%) genes with copy-number gains. In contrast, the methylation of genes in copy-neutral LOH regions was higher than in diploid tumors for only 129/15213 (0.8%) genes. This is statistically supported by chi-squared analysis (χ2 = 407.2, p < 2.2 × 10⁻⁶) (Table S5). Similar results were obtained when tumors were separated into mutation groups (Figure S5). Furthermore, the median methylation (t-values) for all genes with LOH was 0.72 (range 0.5–4.0) and copy gain was 0.70 (range 0.5–6.3), both of which were significantly higher than that of copy-neutral LOH genes, which had a median of 0.60 (range 0.5–1.3) (Figure 5B). Gene expression of these groups shows that genes within regions of LOH and high methylation more often have decreased expression (p = 0.00022) and that genes within regions of copy gain often maintain higher expression (p = 1.7 × 10⁻⁵), albeit a very modest median increase: 0.08 (log2 Δ gene expression) (Figure 5C).
Figure 5.
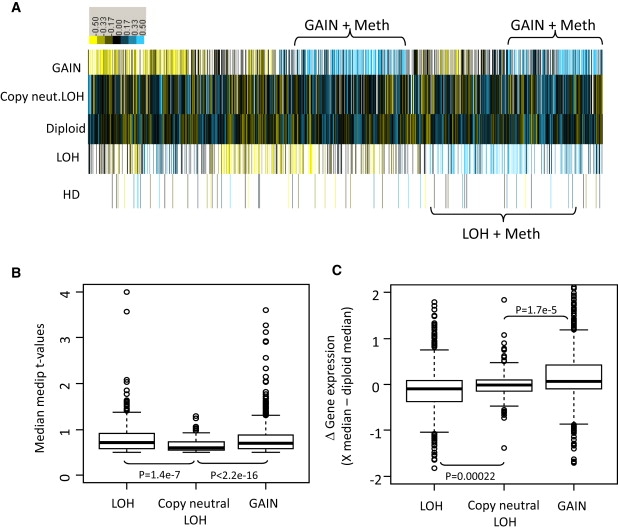
Copy Number versus Methylation Reveals Frequent Methylation in Tumors with LOH or Copy-Number Gains
(A) Heatmap of median methylation levels (MeDIP t-values) for each copy-number group. For each gene (n = 16237), tumors were broken down into copy-number groups (y axis) of tumors showing homozygous deletion (HD, n = 653), loss of heterozygosity (LOH, n = 4921), normal diploidy (n = 16237), copy-neutral LOH (n = 15213), or gains (n = 9070). This shows 607 (12.3%) genes with increased methylation in the tumors that show LOH compared to the normal diploid tumors and 1032 (11.4%) genes with increased methylation in the tumors that show copy-number gains compared to diploid tumors. The methylation of genes in copy-neutral LOH regions was not significantly different from that of diploid tumors, with only 123 genes with increased methylation (0.8%). Blue, increased methylation; yellow, decreased methylation.
(B) Box plot of median methylation levels (y axis, MeDIP t-values) for the genes that have LOH and increased methylation (compared to diploid tumors), copy-neutral LOH and increased methylation, or copy-number gains and increased methylation. This analysis shows a wider range of increased methylation in the LOH and GAIN tumors compared to the neutral LOH genes.
(C) Gene-expression analysis (log-fold change) of the same genes shown as a box plot of difference in median expression levels of diploid tumors compared to LOH tumors, copy-neutral tumors, or copy-gain tumors. This shows that tumors containing LOH and methylation more often have decreased expression and that copy-gain tumors often maintain higher expression.
Discussion
Hypermethylation of promoter CpG islands occurs frequently in numerous genes in almost all human cancers.25 Genome-wide hypomethylation is also frequently observed in tumor cells compared to normal tissue.25 Which, if any, of these frequent epigenetic changes are early “driving” epimutations or late-event “passenger” epimutations is not clear, nor is the mechanism of how these alterations occur known. In this study, we have shown that different germline mutations can lead to very different epigenetic profiles in breast tumors. Methylation markers might therefore be useful as an additional tool for predicting mutation status of tumors, prior to confirmation by sequence analysis, and for distinguishing pathogenic from neutral variants in BRCA1.26,27
An epigenetic role for BRCA1 has been proposed because of its binding to HDAC1 (MIM 601241) and HDAC2 (MIM 601241) and chromatin-remodelling complexes.28,29 However, a direct role for BRCA1 in DNA methylation has not yet been investigated. There are conflicting reports about the level of methylation in BRCA1-mutated tumors compared to sporadic breast tumors.13,14 We showed that the BRCA1 tumors have the most distinct genome-wide DNA-methylation profiles with the highest svml predictions and the most significant clustering. In the genes that we have validated in both sets of tumors (e.g., RASSF1A, SGK1, HTR6, LHCGR, PKD2, and others), we observed lower methylation levels in the BRCA1 breast tumors compared to the BRCA2 and BRCAx tumors. Low levels of methylation have been observed in other genes in BRCA1 tumors, best exemplified by HIN1 (SCGB3A1 [MIM 606500]).13,14,30,31 Together, these data are consistent with a role for BRCA1, direct or indirect, in de novo methylation of these genes or in the spreading and maintenance of methylation marks, a function that is likely to be absent in BRCA1-mutated tumors. Therefore, further investigation of the role of BRCA1 in DNA methylation is warranted. Recently, DNA demethylation has been shown to be cyclical in the estrogen-responsive promoters dependant on deamination and glycosylation and on base-excision-repair pathways, suggesting a rapidly changing DNA-methylation state.32,33 There is now compelling evidence that DNA demethylation involves DNA repair via a 5-meC deaminase, activation-induced deaminase (AICDA [MIM 605257]), and a G:T mismatch-specific thymine glycosylase, Mbd4 (MIM 603574), and is promoted by GADD45 (MIM 126335) proteins through physical interactions with both AICDA and Mbd4.34,35 These data suggest that the enzymatic reaction maintaining the DNA methylation is in a fine balance that can be shifted rapidly and that fully functional DNA repair pathways are required. Interestingly, although BRCA1 transactivates GADD45 promoter in response to DNA damage, it has been reported to repress GADD45 transcription in unperturbed cells through interaction with CtIP (RBBP8 [MIM 604124]), a corepressor.36 Thus, it is possible that increased GADD45 expression in the absence of BRCA1 may account for hypomethylation seen in BRCA1 tumors compared to other familial tumors.
Gene-expression profiling of sporadic and familial breast tumors can categorize them into defined pathological and clinically different intrinsic subtypes, including basal tumors (often triple-negative, BRCA1-mutated tumors and poorer prognosis), HER2-amplified tumors, and luminal tumors (hormone-receptor positive and better prognosis).3,5 In this study, we have attempted to use the DNA-methylation profiles to recapitulate the clustering into these intrinsic subtypes. However, we observed no significantly different genes between the basal and luminal groupings; thus, it is not surprising that the svml predictions using the methylation profiles were unable to identify whether the tumors were basal or luminal breast tumors. We do not discount the possibility that larger numbers of tumors may identify statistically significant differences between intrinsic subtypes. Given that BRCA1 tumors were accurately predicted and that almost all BRCA1 tumors are basal tumors, one might assume that the methylation profiling should have predicted the basal tumors. However, there were an additional four basal tumors that were BRCAx tumors, and these tumors had methylation profiles very different from those of the BRCA1 tumors, which accounts for the poor prediction of basal tumors. These data suggest that the differences in gene expression that define these intrinsic subgroups are not regulated by differential DNA methylation.
We have recently shown by gene-expression profiling that, like sporadic tumors, BRCAx tumors are heterogeneous and manifest all five intrinsic subtypes.5 However, we have found that DNA-methylation profiling predicted a higher number of BRCAx tumors, with 64% accuracy, than did gene-expression data (29% accuracy). Furthermore, when we performed unsupervised hierarchical clustering on these samples, we found a subset of tumors that clustered together in a highly significant branch of the cluster (p < 0.0001). These five tumors included two basal, two luminal, and one HER2 tumor, indicating that these groupings are not reliant on the intrinsic subtypes. Given that the BRCA1 tumors, all of which harbor mutations in the same gene, have a distinctive methylation profile, we hypothesize that this subgroup of BRCAx tumors with similar profiles may harbor mutations in the same gene or same pathway. The methylation of genes such as HTR6, LHCGR, and GEMIN8, in which we have validated the differences in these groups, may be used in future studies to subdivide this heterogeneous tumor group into a subclass that may be more homogenous and may increase the sensitivity of linkage analysis or high-throughput-sequencing mutation screening for the identification of breast cancer susceptibility genes. However, we note that only 14 BRCAx tumors were profiled in this study. Although validation in the 47 FFPE tumors showed bimodal distribution of methylation for these genes, the existence of BRCAx subtypes with different methylation profiles needs to be further validated with a larger panel of genes in more BRCAx tumors, including sets from within the same family, in order to determine whether there might be a genetic basis to such methylation subtypes.
The genome-wide nature of our methylation analysis has allowed us to investigate the methylation of any gene with high probe-level resolution (∼35 bp resolution). We used this resolution to validate the fine mapping of increased methylation changes in the first intron of the ESR1 gene in BRCA1 tumors compared to non-BRCA1 tumors.24 This has been proposed as one specific mechanism by which BRCA1 tumors alter ESR1 expression, thereby altering the response to antiestrogen therapies, and may account for a difference between BRCA1 and non-BRCA1 basal tumors.24,37 BRCA1 is also recruited to the ESR1 promoter by Oct1, where it is required for ESR1 expression.38 It is not yet known whether this binding of BRCA1 to the promoter is responsible for the change in CpG island methylation.
We performed validation of variable methylation levels in numerous genes, including RASSF1A, SGK1, PKD2, HTR6, LHCGR, and GEMIN8. We hypothesize that differential methylation of these genes may contribute to phenotypic differences among these mutation classes. For example, we observed increased methylation of the luteinizing hormone/choriogonadotropin receptor (LHCGR) in BRCA2 and BRCAx compared to BRCA1 tumors. This gene is regulated by DNA methylation and histone modifications, and its mRNA is undetectable in up to 65% of unselected breast cancers.39,40 Furthermore, the expression of LHCGR is increased in more invasive breast tumors; thus, the decreased methylation of LHCGR that we observed in BRCA1 tumors may contribute to their increased aggressiveness as compared to other tumors.41,42 PKD2 is a membrane-bound protein involved in tubulogenesis.43 Increased methylation of PKD2 in BRCA2-related breast tumors may, therefore, promote the increased tubular or tubulo-lobular morphology observed in BRCA2 tumors compared to other tumors.44 The serum- and glucocorticoid-inducible kinase 1 (SGK1) is a serine/threonine protein kinase that is involved in cellular stress and may have an important role in breast tumor aggressiveness.45 Furthermore, it is induced in a p53-dependent manner after DNA damage and is activated by the mTOR pathway.46,47 Our finding that SGK1 is less methylated in BRCA1-mutated tumors is consistent with the increased activity of the mTOR signaling pathway observed in basal-like breast cancers.42,48 Further investigation of the role of methylation of these genes in breast carcinogenesis is warranted.
We have generated, for the first time, a complete data set of DNA-methylation, gene-expression, and copy-number variation on 33 familial breast tumors covering 16237 gene transcripts (freely available resource; GEO accession no. GSE17125). We did not observe a strong genome-wide correlation between gene expression and methylation. This is not surprising, given that the majority of genes have unmethylated promoters despite differential gene expression regulated by transcription factors and other regulatory mechanisms. However, we could identify ∼800 genes in which gene expression was significantly inversely correlated with DNA methylation (Table S5). We did observe a strong relationship between methylation and copy number, a significant number of genes showing both LOH and increased methylation, which suggests that these genes conform to the Knudson two-hit hypothesis for tumor-suppressor genes.49 In addition, we observed a large number of genes that show copy-number gain and increased methylation, which we hypothesize may be a mechanism for dosage compensation to reduce the level of expression of amplified genes.
In summary, we have shown that methylation profiles for familial breast cancers are defined by the mutation status and are distinct from the intrinsic subtypes. This finding requires independent confirmation in a larger panel of familial tumors. Finally, we have provided a novel resource integrating genomic analysis of DNA-methylation, gene-expression, and copy-number changes that will be useful for future genomic research in familial breast cancers.
Acknowledgments
The authors would like to acknowledge Lynne Reid, Patricia Keith, and Jeremy Arnold for their assistance. We would also like to acknowledge the Wolfson Institute for Biomedical Research and the UCL Cancer Institute Scientific Support Services for performing the microarray hybridizations, in particular Jacob Raby and Catherine King. We wish to thank Heather Thorne, Eveline Niedermayr, all of the kConFab research nurses and staff, the heads and staff of the Family Cancer Clinics, and the Clinical Follow Up Study (funded by NHMRC grants 145684, 288704, and 454508) for their contributions to this resource, as well as the many families who contribute to kConFab. kConFab is supported by grants from the National Breast Cancer Foundation, funded by the National Health and Medical Research Council (NHMRC), and by the Queensland Cancer Fund, the Cancer Councils of New South Wales, Victoria, Tasmania and South Australia, and the Cancer Foundation of Western Australia. This work was funded by a Susan Komen Foundation grant to G.C.T. J.M.F. was funded in part by Cancer Research UK to C.B. and University College London Hospital Charities to J.M.F. J.M.F. is a Breast Cancer Campaign Fellow and is partly funded by Cancer Research UK program C536/A6689; G.C.T. and K.K. are NHMRC Research Fellows.
Supplemental Data
Web Resources
The URLs for data presented herein are as follows:
Entrez Gene, http://www.ncbi.nlm.nih.gov/gene
Gene Expression Omnibus (GEO), http://www.ncbi.nlm.nih.gov/geo/
Online Mendelian Inheritance in Man (OMIM), http://www.ncbi.nlm.nih.gov/Omim/
Accession Numbers
The Gene Expression Omnibus (GEO) accession number for the microarray data reported in this paper is GSE17125.
References
- 1.Jemal A., Murray T., Ward E., Samuels A., Tiwari R.C., Ghafoor A., Feuer E.J., Thun M.J. Cancer statistics, 2005. CA Cancer J. Clin. 2005;55:10–30. doi: 10.3322/canjclin.55.1.10. [DOI] [PubMed] [Google Scholar]
- 2.Smith P., McGuffog L., Easton D.F., Mann G.J., Pupo G.M., Newman B., Chenevix-Trench G., Szabo C., Southey M., Renard H., kConFab Investigators. BCFS, BRCAX Collaborators Group. Breast Cancer Susceptibility Collaboration (UK) A genome wide linkage search for breast cancer susceptibility genes. Genes Chromosomes Cancer. 2006;45:646–655. doi: 10.1002/gcc.20330. [DOI] [PMC free article] [PubMed] [Google Scholar]
- 3.Sørlie T., Perou C.M., Tibshirani R., Aas T., Geisler S., Johnsen H., Hastie T., Eisen M.B., van de Rijn M., Jeffrey S.S. Gene expression patterns of breast carcinomas distinguish tumor subclasses with clinical implications. Proc. Natl. Acad. Sci. USA. 2001;98:10869–10874. doi: 10.1073/pnas.191367098. [DOI] [PMC free article] [PubMed] [Google Scholar]
- 4.Lakhani S.R., Reis-Filho J.S., Fulford L., Penault-Llorca F., van der Vijver M., Parry S., Bishop T., Benitez J., Rivas C., Bignon Y.J., Breast Cancer Linkage Consortium Prediction of BRCA1 status in patients with breast cancer using estrogen receptor and basal phenotype. Clin. Cancer Res. 2005;11:5175–5180. doi: 10.1158/1078-0432.CCR-04-2424. [DOI] [PubMed] [Google Scholar]
- 5.Waddell N., Arnold J., Cocciardi S., da Silva L., Marsh A., Riley J., Johnstone C., Mohammad M., Eng C., Reid L. Subtypes of familial breast tumors revealed by expression and copy number profiling. Breast Cancer Res. Treat. 2009 doi: 10.1007/s10549-009-0653-1. Published online December 3, 2009. [DOI] [PubMed] [Google Scholar]
- 6.Kouzarides T. Chromatin modifications and their function. Cell. 2007;128:693–705. doi: 10.1016/j.cell.2007.02.005. [DOI] [PubMed] [Google Scholar]
- 7.Feinberg A.P., Ohlsson R., Henikoff S. The epigenetic progenitor origin of human cancer. Nat. Rev. Genet. 2006;7:21–33. doi: 10.1038/nrg1748. [DOI] [PubMed] [Google Scholar]
- 8.Ordway J.M., Budiman M.A., Korshunova Y., Maloney R.K., Bedell J.A., Citek R.W., Bacher B., Peterson S., Rohlfing T., Hall J. Identification of novel high-frequency DNA methylation changes in breast cancer. PLoS ONE. 2007;2:e1314. doi: 10.1371/journal.pone.0001314. [DOI] [PMC free article] [PubMed] [Google Scholar]
- 9.Novak P., Jensen T., Oshiro M.M., Watts G.S., Kim C.J., Futscher B.W. Agglomerative epigenetic aberrations are a common event in human breast cancer. Cancer Res. 2008;68:8616–8625. doi: 10.1158/0008-5472.CAN-08-1419. [DOI] [PMC free article] [PubMed] [Google Scholar]
- 10.Clark S.J. Action at a distance: epigenetic silencing of large chromosomal regions in carcinogenesis. Hum. Mol. Genet. 2007;16(Spec No 1):R88–R95. doi: 10.1093/hmg/ddm051. [DOI] [PubMed] [Google Scholar]
- 11.Frigola J., Song J., Stirzaker C., Hinshelwood R.A., Peinado M.A., Clark S.J. Epigenetic remodeling in colorectal cancer results in coordinate gene suppression across an entire chromosome band. Nat. Genet. 2006;38:540–549. doi: 10.1038/ng1781. [DOI] [PubMed] [Google Scholar]
- 12.Rodenhiser D.I., Andrews J., Kennette W., Sadikovic B., Mendlowitz A., Tuck A.B., Chambers A.F. Epigenetic mapping and functional analysis in a breast cancer metastasis model using whole-genome promoter tiling microarrays. Breast Cancer Res. 2008;10:R62. doi: 10.1186/bcr2121. [DOI] [PMC free article] [PubMed] [Google Scholar]
- 13.Esteller M., Fraga M.F., Guo M., Garcia-Foncillas J., Hedenfalk I., Godwin A.K., Trojan J., Vaurs-Barrière C., Bignon Y.J., Ramus S. DNA methylation patterns in hereditary human cancers mimic sporadic tumorigenesis. Hum. Mol. Genet. 2001;10:3001–3007. doi: 10.1093/hmg/10.26.3001. [DOI] [PubMed] [Google Scholar]
- 14.Suijkerbuijk K.P., Fackler M.J., Sukumar S., van Gils C.H., van Laar T., van der Wall E., Vooijs M., van Diest P.J. Methylation is less abundant in BRCA1-associated compared with sporadic breast cancer. Ann. Oncol. 2008;19:1870–1874. doi: 10.1093/annonc/mdn409. [DOI] [PMC free article] [PubMed] [Google Scholar]
- 15.Mann G.J., Thorne H., Balleine R.L., Butow P.N., Clarke C.L., Edkins E., Evans G.M., Fereday S., Haan E., Gattas M., Kathleen Cuningham Consortium for Research in Familial Breast Cancer Analysis of cancer risk and BRCA1 and BRCA2 mutation prevalence in the kConFab familial breast cancer resource. Breast Cancer Res. 2006;8:R12. doi: 10.1186/bcr1377. [DOI] [PMC free article] [PubMed] [Google Scholar]
- 16.Weber M., Hellmann I., Stadler M.B., Ramos L., Pääbo S., Rebhan M., Schübeler D. Distribution, silencing potential and evolutionary impact of promoter DNA methylation in the human genome. Nat. Genet. 2007;39:457–466. doi: 10.1038/ng1990. [DOI] [PubMed] [Google Scholar]
- 17.Royo J.L., Hidalgo M., Ruiz A. Pyrosequencing protocol using a universal biotinylated primer for mutation detection and SNP genotyping. Nat. Protoc. 2007;2:1734–1739. doi: 10.1038/nprot.2007.244. [DOI] [PubMed] [Google Scholar]
- 18.Flanagan J.M., Munoz-Alegre M., Henderson S., Tang T., Sun P., Johnson N., Fletcher O., Dos Santos Silva I., Peto J., Boshoff C. Gene-body hypermethylation of ATM in peripheral blood DNA of bilateral breast cancer patients. Hum. Mol. Genet. 2009;18:1332–1342. doi: 10.1093/hmg/ddp033. [DOI] [PMC free article] [PubMed] [Google Scholar]
- 19.Johnson W.E., Li W., Meyer C.A., Gottardo R., Carroll J.S., Brown M., Liu X.S. Model-based analysis of tiling-arrays for ChIP-chip. Proc. Natl. Acad. Sci. USA. 2006;103:12457–12462. doi: 10.1073/pnas.0601180103. [DOI] [PMC free article] [PubMed] [Google Scholar]
- 20.Suzuki R., Shimodaira H. Pvclust: an R package for assessing the uncertainty in hierarchical clustering. Bioinformatics. 2006;22:1540–1542. doi: 10.1093/bioinformatics/btl117. [DOI] [PubMed] [Google Scholar]
- 21.Mootha V.K., Lindgren C.M., Eriksson K.F., Subramanian A., Sihag S., Lehar J., Puigserver P., Carlsson E., Ridderstråle M., Laurila E. PGC-1alpha-responsive genes involved in oxidative phosphorylation are coordinately downregulated in human diabetes. Nat. Genet. 2003;34:267–273. doi: 10.1038/ng1180. [DOI] [PubMed] [Google Scholar]
- 22.Ito Y., Koessler T., Ibrahim A.E., Rai S., Vowler S.L., Abu-Amero S., Silva A.L., Maia A.T., Huddleston J.E., Uribe-Lewis S. Somatically acquired hypomethylation of IGF2 in breast and colorectal cancer. Hum. Mol. Genet. 2008;17:2633–2643. doi: 10.1093/hmg/ddn163. [DOI] [PMC free article] [PubMed] [Google Scholar]
- 23.Hedenfalk I., Ringner M., Ben-Dor A., Yakhini Z., Chen Y., Chebil G., Ach R., Loman N., Olsson H., Meltzer P. Molecular classification of familial non-BRCA1/BRCA2 breast cancer. Proc. Natl. Acad. Sci. USA. 2003;100:2532–2537. doi: 10.1073/pnas.0533805100. [DOI] [PMC free article] [PubMed] [Google Scholar]
- 24.Archey W.B., McEachern K.A., Robson M., Offit K., Vaziri S.A., Casey G., Borg A., Arrick B.A. Increased CpG methylation of the estrogen receptor gene in BRCA1-linked estrogen receptor-negative breast cancers. Oncogene. 2002;21:7034–7041. doi: 10.1038/sj.onc.1205844. [DOI] [PubMed] [Google Scholar]
- 25.Baylin S., Bestor T.H. Altered methylation patterns in cancer cell genomes: cause or consequence? Cancer Cell. 2002;1:299–305. doi: 10.1016/s1535-6108(02)00061-2. [DOI] [PubMed] [Google Scholar]
- 26.Easton D.F., Deffenbaugh A.M., Pruss D., Frye C., Wenstrup R.J., Allen-Brady K., Tavtigian S.V., Monteiro A.N., Iversen E.S., Couch F.J., Goldgar D.E. A systematic genetic assessment of 1,433 sequence variants of unknown clinical significance in the BRCA1 and BRCA2 breast cancer-predisposition genes. Am. J. Hum. Genet. 2007;81:873–883. doi: 10.1086/521032. [DOI] [PMC free article] [PubMed] [Google Scholar]
- 27.Waddell N., Ten Haaf A., Marsh A., Johnson J., Walker L.C., Investigators K., Gongora M., Brown M., Grover P., Girolami M. BRCA1 and BRCA2 missense variants of high and low clinical significance influence lymphoblastoid cell line post-irradiation gene expression. PLoS Genet. 2008;4:e1000080. doi: 10.1371/journal.pgen.1000080. [DOI] [PMC free article] [PubMed] [Google Scholar]
- 28.Bochar D.A., Wang L., Beniya H., Kinev A., Xue Y., Lane W.S., Wang W., Kashanchi F., Shiekhattar R. BRCA1 is associated with a human SWI/SNF-related complex: linking chromatin remodeling to breast cancer. Cell. 2000;102:257–265. doi: 10.1016/s0092-8674(00)00030-1. [DOI] [PubMed] [Google Scholar]
- 29.Yarden R.I., Brody L.C. BRCA1 interacts with components of the histone deacetylase complex. Proc. Natl. Acad. Sci. USA. 1999;96:4983–4988. doi: 10.1073/pnas.96.9.4983. [DOI] [PMC free article] [PubMed] [Google Scholar]
- 30.Krop I., Maguire P., Lahti-Domenici J., Lodeiro G., Richardson A., Johannsdottir H.K., Nevanlinna H., Borg A., Gelman R., Barkardottir R.B. Lack of HIN-1 methylation in BRCA1-linked and “BRCA1-like” breast tumors. Cancer Res. 2003;63:2024–2027. [PubMed] [Google Scholar]
- 31.Vasilatos S.N., Broadwater G., Barry W.T., Baker J.C., Jr., Lem S., Dietze E.C., Bean G.R., Bryson A.D., Pilie P.G., Goldenberg V. CpG island tumor suppressor promoter methylation in non-BRCA-associated early mammary carcinogenesis. Cancer Epidemiol. Biomarkers Prev. 2009;18:901–914. doi: 10.1158/1055-9965.EPI-08-0875. [DOI] [PMC free article] [PubMed] [Google Scholar]
- 32.Kangaspeska S., Stride B., Métivier R., Polycarpou-Schwarz M., Ibberson D., Carmouche R.P., Benes V., Gannon F., Reid G. Transient cyclical methylation of promoter DNA. Nature. 2008;452:112–115. doi: 10.1038/nature06640. [DOI] [PubMed] [Google Scholar]
- 33.Métivier R., Gallais R., Tiffoche C., Le Péron C., Jurkowska R.Z., Carmouche R.P., Ibberson D., Barath P., Demay F., Reid G. Cyclical DNA methylation of a transcriptionally active promoter. Nature. 2008;452:45–50. doi: 10.1038/nature06544. [DOI] [PubMed] [Google Scholar]
- 34.Barreto G., Schäfer A., Marhold J., Stach D., Swaminathan S.K., Handa V., Döderlein G., Maltry N., Wu W., Lyko F., Niehrs C. Gadd45a promotes epigenetic gene activation by repair-mediated DNA demethylation. Nature. 2007;445:671–675. doi: 10.1038/nature05515. [DOI] [PubMed] [Google Scholar]
- 35.Rai K., Huggins I.J., James S.R., Karpf A.R., Jones D.A., Cairns B.R. DNA demethylation in zebrafish involves the coupling of a deaminase, a glycosylase, and gadd45. Cell. 2008;135:1201–1212. doi: 10.1016/j.cell.2008.11.042. [DOI] [PMC free article] [PubMed] [Google Scholar]
- 36.Zheng W., Luo F., Lu J.J., Baltayan A., Press M.F., Zhang Z.F., Pike M.C. Reduction of BRCA1 expression in sporadic ovarian cancer. Gynecol. Oncol. 2000;76:294–300. doi: 10.1006/gyno.1999.5664. [DOI] [PubMed] [Google Scholar]
- 37.Lapidus R.G., Nass S.J., Butash K.A., Parl F.F., Weitzman S.A., Graff J.G., Herman J.G., Davidson N.E. Mapping of ER gene CpG island methylation-specific polymerase chain reaction. Cancer Res. 1998;58:2515–2519. [PubMed] [Google Scholar]
- 38.Hosey A.M., Gorski J.J., Murray M.M., Quinn J.E., Chung W.Y., Stewart G.E., James C.R., Farragher S.M., Mulligan J.M., Scott A.N. Molecular basis for estrogen receptor alpha deficiency in BRCA1-linked breast cancer. J. Natl. Cancer Inst. 2007;99:1683–1694. doi: 10.1093/jnci/djm207. [DOI] [PMC free article] [PubMed] [Google Scholar]
- 39.Kuijper T.M., Ruigrok-Ritstier K., Verhoef-Post M., Piersma D., Bruysters M.W., Berns E.M., Themmen A.P. LH receptor gene expression is essentially absent in breast tumor tissue: implications for treatment. Mol. Cell. Endocrinol. 2009;302:58–64. doi: 10.1016/j.mce.2008.12.016. [DOI] [PMC free article] [PubMed] [Google Scholar]
- 40.Zhang Y., Fatima N., Dufau M.L. Coordinated changes in DNA methylation and histone modifications regulate silencing/derepression of luteinizing hormone receptor gene transcription. Mol. Cell. Biol. 2005;25:7929–7939. doi: 10.1128/MCB.25.18.7929-7939.2005. [DOI] [PMC free article] [PubMed] [Google Scholar]
- 41.Hudelist G., Wuelfing P., Czerwenka K., Knöfler M., Haider S., Fink-Retter A., Gschwantler-Kaulich D., Pfeiler G., Kubista E., Singer C.F. Beta-hCG/LH receptor (b-HCG/LH-R) expression is increased in invasive versus preinvasive breast cancer: implications for breast carcinogenesis? J. Cancer Res. Clin. Oncol. 2009;135:191–195. doi: 10.1007/s00432-008-0458-3. [DOI] [PMC free article] [PubMed] [Google Scholar]
- 42.Robson M.E., Chappuis P.O., Satagopan J., Wong N., Boyd J., Goffin J.R., Hudis C., Roberge D., Norton L., Bégin L.R. A combined analysis of outcome following breast cancer: differences in survival based on BRCA1/BRCA2 mutation status and administration of adjuvant treatment. Breast Cancer Res. 2004;6:R8–R17. doi: 10.1186/bcr658. [DOI] [PMC free article] [PubMed] [Google Scholar]
- 43.Boletta A., Germino G.G. Role of polycystins in renal tubulogenesis. Trends Cell Biol. 2003;13:484–492. doi: 10.1016/s0962-8924(03)00169-7. [DOI] [PubMed] [Google Scholar]
- 44.Armes J.E., Egan A.J., Southey M.C., Dite G.S., McCredie M.R., Giles G.G., Hopper J.L., Venter D.J. The histologic phenotypes of breast carcinoma occurring before age 40 years in women with and without BRCA1 or BRCA2 germline mutations: a population-based study. Cancer. 1998;83:2335–2345. [PubMed] [Google Scholar]
- 45.Tangir J., Bonafé N., Gilmore-Hebert M., Henegariu O., Chambers S.K. SGK1, a potential regulator of c-fms related breast cancer aggressiveness. Clin. Exp. Metastasis. 2004;21:477–483. doi: 10.1007/s10585-004-4226-8. [DOI] [PubMed] [Google Scholar]
- 46.Hong F., Larrea M.D., Doughty C., Kwiatkowski D.J., Squillace R., Slingerland J.M. mTOR-raptor binds and activates SGK1 to regulate p27 phosphorylation. Mol. Cell. 2008;30:701–711. doi: 10.1016/j.molcel.2008.04.027. [DOI] [PubMed] [Google Scholar]
- 47.You H., Jang Y., You-Ten A.I., Okada H., Liepa J., Wakeham A., Zaugg K., Mak T.W. p53-dependent inhibition of FKHRL1 in response to DNA damage through protein kinase SGK1. Proc. Natl. Acad. Sci. USA. 2004;101:14057–14062. doi: 10.1073/pnas.0406286101. [DOI] [PMC free article] [PubMed] [Google Scholar]
- 48.Marty B., Maire V., Gravier E., Rigaill G., Vincent-Salomon A., Kappler M., Lebigot I., Djelti F., Tourdès A., Gestraud P. Frequent PTEN genomic alterations and activated phosphatidylinositol 3-kinase pathway in basal-like breast cancer cells. Breast Cancer Res. 2008;10:R101. doi: 10.1186/bcr2204. [DOI] [PMC free article] [PubMed] [Google Scholar]
- 49.Knudson A.G. Hereditary cancer: two hits revisited. J. Cancer Res. Clin. Oncol. 1996;122:135–140. doi: 10.1007/BF01366952. [DOI] [PMC free article] [PubMed] [Google Scholar]
Associated Data
This section collects any data citations, data availability statements, or supplementary materials included in this article.