Abstract
We measured the movements of soccer players heading a football in a fully immersive virtual reality environment. In mid-flight the ball’s trajectory was altered from its normal quasi-parabolic path to a linear one, producing a jump in the rate of change of the angle of elevation of gaze (α) from player to ball. One reation time later the players adjusted their speed so that the rate of change of α increased when it had been reduced and reduced it when it had been increased. Since the result of the player’s movement was to regain a value of the rate of change close to that before the disturbance, the data suggest that the players have an expectation of, and memory for, the pattern that the rate of change of α will follow during the flight. The results support the general claim that players intercepting balls use servo control strategies and are consistent with the particular claim of Optic Acceleration Cancellation theory that the servo strategy is to allow α to increase at a steadily decreasing rate.
Keywords: virtual reality, visuomotor, movement, action
Chapman (1968) demonstrated that a ball on a parabolic trajectory coming directly towards a fielder would be intercepted if the fielder ran at a constant speed such that the tangent of the angle of gaze from fielder to ball, α, increased at a constant rate. Chapman proposed that the fielder’s interception strategy was to maintain a steady increase of tanα. This became known as the Optic Acceleration Cancellation (OAC) theory of interception. Despite the fact that Chapman’s proof made certain simplifying assumptions that are not met in the real world (balls do not travel on parabolic trajectories and fielders seldom run at constant velocity) several empirical studies of catching have shown that tanα does indeed increase at a close to constant rate when people run to catch a ball (Dienes & McLeod, 1993; McLeod & Dienes, 1996; Michaels & Oudejans, 1992; Mori & Miyazaki, 2002).
A ball will be intercepted provided the fielder keeps the angle of gaze to the ball between 0° and 90° throughout the flight. However, McLeod and Dienes (1996) showed that to maximize the range of ball trajectories that can be intercepted, given the limited speed at which people can run compared to typical ball speeds, fielders should move so that α increases throughout the flight. But the rate of increase must be controlled because if α passes 90° the ball will go overhead. A general way of trying to achieve these potentially incompatible goals is to run so that α increases at a steadily decreasing rate. Keeping tanα increasing at a constant rate is one way of ensuring that α will increase throughout the flight without reaching 90°. McLeod, Reed & Dienes (2001, 2006) proposed that OAC strategy should be described by the more general goal of keeping α increasing at a steadily decreasing rate, and Chapman’s strategy be seen as one specific way to achieve this.1
Servo-theories of interception such as OAC theory and Linear Optic Trajectory (LOT) theory (McBeath, Shaffer & Kaiser, 1995) (see also Marken, 2001) propose that people continuously sample information obtained from watching the ball throughout its flight and use this to adjust the speed and direction in which they move, following an algorithm that ensures they arrive at the place where the ball can be intercepted. An alternative view is that experienced catchers can judge where the ball will land from the early part of its trajectory and they go there and wait for it (e.g., Adair, 1995; Chodosh, Lifson & Tabin, 1995). Most studies supporting servo theories of interception have been conducted with people intercepting balls on normal flights. These have reported behaviour that is consistent with servo theories but do not establish the causal link posited by the theories. For example, studies cited as supporting OAC theory have shown that people’s behaviour is consistent with the strategy of running so that α increases at a decreasing rate because that is how α changes as they run. But they have not shown a causal link between the rate of change of α (dα/dt) and the fielder’s behaviour. To do this it is necessary to manipulate dα/dt in mid-flight and show that people’s running behaviour changes in the way predicted by the theory. This cannot be done with normal ball flights because once the ball starts on a ballistic trajectory its path is determined. Only the fielder can change dα/dt (by moving faster or slower).
We directly tested servo theories in general (and OAC theory in particular) by conducting an experiment in Virtual Reality where the ball’s trajectory, and hence dα/dt, could be manipulated in mid-flight. We used an interception task in which soccer players tried to head a virtual ball. The task parameters were such that with a normal ball trajectory the player could usually intercept the ball successfully. As in previous studies of people running to catch balls, we found that α increased at a decreasing rate as the players moved to intercept the ball. We then altered the trajectory of the ball so that there was a step change in dα/dt in mid-flight. Servo theories, which claim that players use dα/dt to continuously control how they run, predict that one reaction time after the change in trajectory their behaviour should change.
Experiment 1
In the first experiment we examined players’ responses to a step reduction in dα/dt when they had to move backwards or forwards but not laterally to head the ball. The step took dα/dt close to zero. That is, the angle of elevation of gaze to the ball became constant. OAC theory predicts that they should accelerate towards the ball when dα/dt was suddenly reduced because this action would increase dα/dt. That is, it would start α increasing again. (LOT theory is an account of how players combine lateral and depth movement. It has no prediction independent of OAC theory about how players will respond to balls coming directly towards them, as in experiment 1.)
Method
The Virtual Reality system
This consisted of a head mounted display, a head tracker and a computer to generate appropriate binocular images given the location and pose of the head (Tcheang, Gilson & Glennerster, 2005). The Datavisor 80 (nVision Industries Inc, Gaithersburg, Maryland) head mounted display unit presented separate 1280 × 512 pixel images to each eye using CRT displays. Each eye’s image was 72° horizontally by 60° vertically with a binocular overlap of 32°, giving a total horizontal field of view of 112° (horizontal pixel size 3.4 arc min). The head mounted display was sealed, excluding light from the outside.
The head was tracked using an IS900 system (Intersense Inc, Burlington, Massachusetts) that provided a six degrees of freedom estimate of the head pose and location, polled at 60 Hz by the image generation program. Binocular images were rendered in real time using a Silicon Graphics Onyx 3200 at 60 Hz. The temporal lag between tracker movement and image display was 50 ms. The spatial accuracy of the IS900 tracker was approximately 5 mm rms for the speed of movement of the participants in our experiments (Gilson, Fitzgibbon & Glennerster, 2006). The floor space on which the players’ movement was recorded measured 3.51 m by 3.54 m. The walls were some way from the recording area so although all ball trajectories landed within the recording area the player could move outside it without fear of hitting an obstacle. The system reported the co-ordinates of the player’s cyclopean point, the centre of the ball, and two vectors to determine the orientation of the head at each refresh of the environment. This allowed calculation of the angle of elevation of gaze from player to ball (on the assumption that the players are watching the ball).
Zaal and Michaels (2003) reported the first virtual reality study of the visual cues used by an observer to decide whether to move backwards or forwards to intercept a ball coming towards them using a CAVE system rather than fully immersive Visual Reality. In the Discussion we compare the advantages and disadvantages of these two systems.
Participants viewed a virtual parkland environment backed by trees, created by pasting digital photographs of a park onto the inside of a virtual cylinder, radius 25 m, that surrounded the participant. The cylinder was sufficiently large that the curvature was not apparent. The perception was of viewing a distant planar background. The visible area was completed by the addition of a colour-matched blue sky. A 3D model of a standard black and white hexagons and pentagons soccer ball, 22 cms in diameter, was superimposed on this background, with an image size appropriate to its distance from the observer.
Participants
The participants were two experienced amateur soccer players, aged 19, with normal vision.
Heading task
The task simulated that of a player watching a ball kicked in the air towards him and heading it back in the direction from which it had come, a standard and well practised routine for a soccer player. Participants began each trial standing at an apparent distance of 19.75 m from the ball launch site. They were cued to a launch by the experimenter saying “Ready?”. The trial was then initiated and the image of the ball rose in his field of view as if it had been kicked towards him. He attempted to head the ball by moving to a position where it would collide with his forehead as it descended. Each participant completed 12 blocks of 40 trials. They were given feedback after each trial on whether they had made contact with the ball or not.
Ball trajectories
The ball trajectories were computed using the method outlined in Brancazio (1985) with values for size, drag, and mass appropriate for a FIFA regulation soccer ball. Positional data for each trajectory was calculated to match the 60 Hz refresh rate of the virtual environment, producing an apparently smooth ball flight.
Balls were launched in the vertical plane that joined the participant and the ball’s initial positions so the participant had to move either forwards or backwards to head the ball, but not sideways. The launch velocity of the ball was varied so it arrived at one of five heading positions, requiring the fielder to move 1.2 or 0.5 m forward, or 0.2, 0.9 or 1.2 m backward. Balls were launched at an initial angle of either 45° or 55° above the horizontal, giving 10 different trajectories, with durations of from 2.1 s to 2.9 s. In a block of 40 trials participants experienced each trajectory four times. The ball’s trajectory started level with the participant’s eyes.
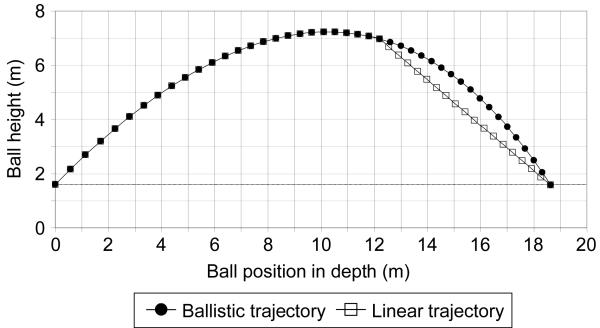
On half the trials for each trajectory the ball followed a path affected by gravity and air resistance only. We refer to these as ‘Ballistic’. In the other half the trajectory deviated from the Ballistic path in mid-flight. After the deviation point, the ball travelled with constant horizontal and vertical velocities such that it arrived at the same heading point at the same time as it would have done had it been on the Ballistic trajectory. We refer to these trajectories as ‘Linear’. They deviated from the Ballistic trajectories at 1.25 or 1.5 s after launch for the 45° launch angle and at 1.5 or 1.75 s after launch for the 55° degree launch angle. Figure 1 shows an example of a Ballistic trajectory and a Linear variant. Within each block of 40 trials there were 20 Linear and 20 Ballistic trajectories.
Figure 1.
An example of a Ballistic and a corresponding Linear trajectory. The vertical and horizontal positions of the ball are shown at 50 ms intervals. The ball was launched at 45°. The Linear trajectory deviated 1.25 s after launch. The players started 19.75 m from the launch point of the ball and had to move forward 1.2 m to head the ball.
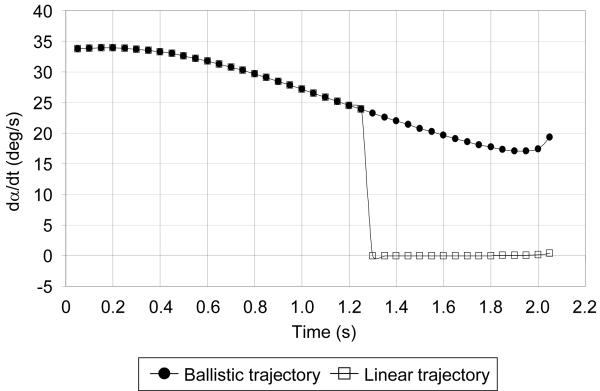
The way that α will change during a flight cannot be predicted precisely as it depends on the movement of the player as well as the trajectory of the ball. Figure 2 shows an example of how dα/dt would change during the flights in figure 1 if the player moved at constant velocity from his starting position to the heading position and arrived at the same time as the ball. This is an idealised case but similar to what typically happened. For the Ballistic flight dα/dt remains positive, decreasing steadily until just before the player heads the ball (i.e., α increases at a decreasing rate throughout the flight). For the Linear trajectory there is a step reduction in dα/dt to zero at the moment that it deviates from the Ballistic trajectory (i.e., α becomes constant.). This perhaps surprising result is a geometric consequence of the fact that the player and the ball are approaching the interception point at (different) constant velocities and the ball is also falling at the constant velocity that will cause it to hit the approaching player. Thus α is constant. (Note that although there is a step change in dα/dt when the trajectories change there is no step change in the position of the ball.)
Figure 2.
The rate of change of α for a player moving at constant velocity from his starting position to the heading position and arriving at the same time as the ball for the Ballistic and Linear trajectories shown in figure 1.
If, as OAC theory claims, the player’s interception strategy is to keep α increasing throughout the flight, the step change in dα/dt to zero on Linear flights should cause him to accelerate forward to start α increasing again. The balls on the Linear trajectory arrive at the heading point at the same time as the balls on the Ballistic trajectory so there is no need for the fielder to change his behaviour. If he were to continue moving as he did for the Ballistic flight he would head the ball successfully. Indeed, accelerating forward will require a subsequent compensatory backward acceleration so he is likely to be less successful at heading the ball.
It is important to note that Figure 1 shows the trajectories from the side, not as the observer views them, from head on. The player tracks a ball rising or falling as it approaches him, not a trajectory moving from left to right. After the switch to the linear trajectory the player sees a ball at an approximately constant angle of elevation, expanding as it approaches him. Although the linear trajectory lies below the ballistic, the experience the player gets from watching it (dα/dt ~ 0) is not the one that he gets from watching balls that will fall in front of him. These fall in his field of view, producing a negative dα/dt. Therefore the linear trajectories do not provide a persistent cue that the player would associate, from past experience, with the need to move forward.
Practice
Participants completed one block of 40 practice trials (including Ballistic and Linear trajectories) to become familiar with the virtual environment and the heading task. Both reported that the simulation felt like a normal soccer task.
Results
The participant was considered to have made contact with the ball if his cyclopean position was within 40 cm of the centre of the ball as it passed his position. This distance was chosen as it corresponded to the boundary at which the participants reported in practice that they thought they had made some head contact with the ball or thought they had missed it completely. JB was successful on 180 (75%) Ballistic trials and 158 (66%) Linear trials. RP was successful on 178 (74%) Ballistic trajectories and 138 (57%) Linear trials. Both participants were reliably less successful on Linear trials (t(478) = 2.21; p < 0.05 and t(478) = 3.90; p < 0.001) respectively.) The data shown in figures 3-5 are for successful trials only.2
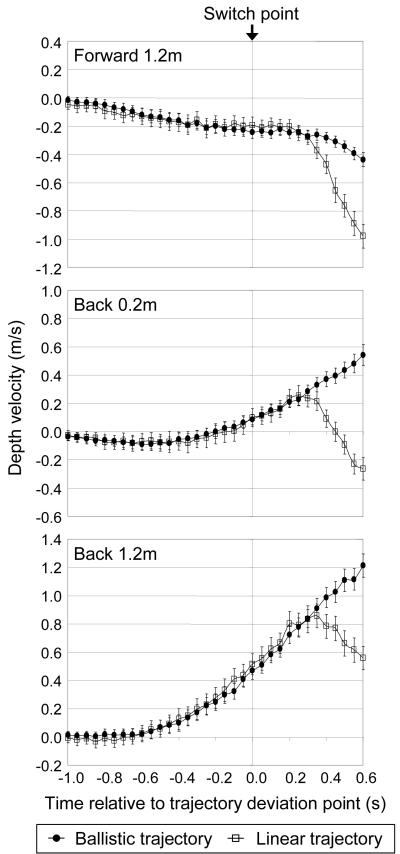
Figure 3.
The velocity of the players moving forward or backward to head balls on Ballistic and Linear trajectories. The ball trajectories diverge at time 0.0. 95% confidence intervals are shown.
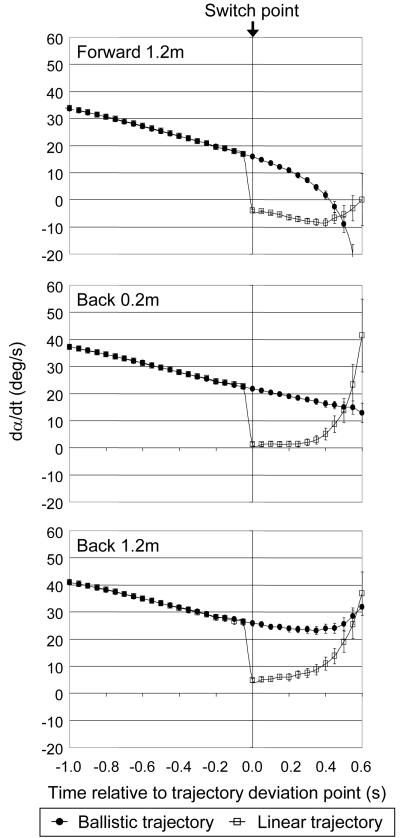
Figure 5.
The rate of change of α for players moving backward or forward to head balls on either Ballistic or Linear trajectories (with 95% confidence intervals). The trajectories diverge at time 0.
Figure 3 shows the players’ speed as they moved to head the ball. A negative velocity indicates forward movement, a positive velocity backward movement. For simplicity we have shown only three conditions. The two intermediate conditions showed similar results. The top panel shows the trials where the heading point was 1.2 m in front of the start point, the middle panel where it was 0.2 m behind and the bottom panel where it was 1.2 m behind. Since the players’ movements were similar for both launch angles and deviation times the data are pooled across these two variables. The time where the deviation from Ballistic to Linear took place is shown as time zero. In each case the players’ movements were similar for Ballistic and Linear trajectories until approximately 300 ms after the trajectory deviation. At this point, whether they were moving forward or backward, they accelerated forward. Comparisons of running speed for balls on Linear and Ballistic trajectories show that the first time at which the speeds were reliably different were: Forward 1.2 m, 350 ms, (t(286) = 3.17, p < 0.005); Back 0.2 m, 350 ms, (t(286) = 3.17, p < 0.005); Back 1.2 m, 400 ms. (t (286) = 3.61, p < 0.001).
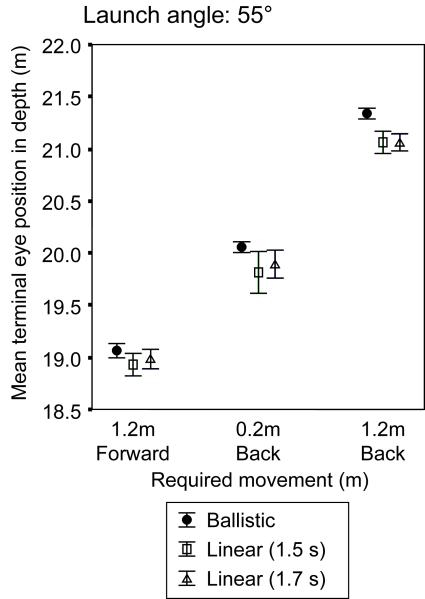
The result of the forward acceleration on Linear trials was that the players were further forward when they headed the ball. This can be seen in figure 4 which shows the average eye position in depth when the ball was headed for the three different ball landing positions on Ballistic and Linear trials for balls launched at 55°. The player started at 19.75 m and the ball was launched from 0 m. The terminal eye position is plotted separately for Linear trials where the trajectory departed from the Ballistic 1.5 s after launch and those where it departed 1.75 s after launch. It can be seen that the players were further forward when they headed the ball on Linear trials than on Ballistic trials and slightly further forward on trials where the trajectory became Linear slightly earlier. Pooled across all landing positions and both launch angles the players were an average of 14.5 cm further forward on Linear trials (t(652) = 10.8, p < 0.001). Taking each of the ten combinations of two launch angles and five landing position separately, in all except one (balls launched at 45° travelling 21.4 m) the players were significantly (p < 0.002) further forward on Linear than on Ballistic trials.
Figure 4.
The terminal eye position in depth for balls landing at three different distances (with 95% confidence intervals). The eye positions are shown separately for trials on which the ball was on a Ballistic trajectory and those where it departed from Ballistic 1.5 or 1.75 s after launch. The launch angle was 55°.
Figure 5 shows the rate of change of α for the three heading positions shown in figure 3. Initially dα/dt was positive and declining in each case (i.e., α increased at a steadily decreasing rate as they moved.) For the Ballistic trajectories this continued until just before the ball was headed. (The sudden deceleration of dα/dt just before the ball was headed when they were moving forward indicates that, on average, they headed the ball as it was dropping below their eye line. When they moved back, the slight increase in dα/dt just before contact implies that, on average, they headed the ball slightly above their eye line.) For Linear trajectories there was a step reduction in dα/dt at the time the trajectories deviated. The result of the player’s forward acceleration around 300 ms later was in each case to cause dα/dt to increase, that is, to start α increasing again. The positive acceleration of dα/dt just before the ball was headed is a reflection of the fact that they were further forward than they were on Ballistic trials (see figure 4) and so the ball was slightly higher on the head when they made contact with it.
Figure 5 shows an aspect of the players’ interception behaviour that it has not been possible to detect with real (as opposed to virtual) trajectories. The result of their actions was to increase dα/dt one reaction time after the change in ball trajectory had reduced it close to zero. The increase was towards the value it would have had, had there been no trajectory change. Thus the value was lower when moving forward (when dα/dt would have been lower on normal trajectories) than when moving back (when dα/dt would have been higher on normal trajectories). The implication is that the algorithm that controls the actions that lead to interception is not just trying to ensure that α increases at a decreasing rate but that it has a memory of the time course of dα/dt throughout the flight of the ball and tries to keep the changing value of dα/dt over time on the trajectory it started with. In other words, the aim of the control mechanism is to keep α increasing at a steadily decreasing rate, despite disturbances. In the real world a soccer player would be familiar with such disturbances to the rate of change of his angle of elevation of gaze to the ball. These might occur from being jostled by another player also trying to get in position to head the ball or taking his eye off the ball to watch an opponent and then returning his gaze to the ball.
There is a corollary to the observation that players appear to have a memory for the time course of dα/dt. Other things being equal, the vertical optic velocity of the ball might seem to be a straightforward cue to whether the player should move backward or forward. If it is high, the ball is more likely to land behind the observer; if it is low, the ball is more likely to land in front. One might expect that this cue would form part of the player’s decision about which way to move. This proposal has been made about how people make their initial decision about whether to move backward or forward (Brouwer, Lopez-Moliner, Brenner & Smeets, 2006). It might be thought that this information would continue to control behaviour throughout the flight. Our results show that it is not the absolute vertical optical velocity that matters when the flight is well under way but that value compared to what it has been throughout the flight so far. For example, figures 3 and 5 show that the players choose to move forward early in the flight when dα/dt > 25 °/s but that players moving backward continue to do so late in the flight when dα/dt < 25 °/s. It is not the absolute value of dα/dt which matters, with high values causing the player to move back and low values causing him to move forward, it is the time history of dα/dt. The way that the players respond to a particular value of dα/dt depends on how far into the flight that value occurs.
It has been suggested that any servo theory, not just OAC theory, would predict that players should accelerate forward in this experiment if the control strategy assumes that the ball is always on a parabolic trajectory. This may be true, but it would be important to show that any alternative hypothesis is experimentally distinguishable from OAC theory. There are only a few visual variables in Experiment 1 that are potentially useful in influencing a player’s running strategy (e.g. α, dα/dt and d2α/dt2) and in many cases an assumption by the player that the ball is moving on a parabolic trajectory, when described in terms of the change of visual variables, may lead to servo theories that are equivalent to OAC theory.
Experiment 2
In the second experiment we examined the players’ response to a step change in dα/dt when they had to move laterally to head the ball rather than backwards or forwards. In this experiment the change could be either positive or negative. OAC predicts that when the value of dα/dt drops the players will move to increase it (as in experiment 1), and when it increases they will move to decrease it. LOT theory predicts that the players’ lateral movement will be linked to any change in their movement in depth (see Discussion for a more detailed description of the LOT theory prediction).
Method
Participants
The participants were the two players used in experiment 1 plus two new men, aged 26 and 28, both enthusiastic amateur soccer players.
Heading task
The task was similar to that in experiment 1 with the participants beginning each trial standing at an apparent distance of 19.75 m from the ball launch site. In this experiment all balls travelled 19.75 m in depth (so no movement in depth was required from the player) but they were projected to heading points 1.00 m, 1.75 m or 2.50 m to the right of the player’s initial position. The player attempted to head the ball at right angles to his original orientation when facing the ball launch site from the start position. A black rectangle in the virtual scene indicated the target he was trying to head the ball towards. Approaching a ball flight from the side and trying to head it at right angles to its original direction of flight is a typical task for a soccer player. For example, for a forward, heading the ball from a corner kick towards goal or, for a defender, trying to head a corner kick away from goal.
Ball trajectories
Ballistic trajectories were calculated as in experiment 1. Balls on non-Ballistic trajectories followed the same spatial trajectory as balls on a Ballistic trajectory but 1.5 s after launch either had a step increase in speed (Fast trials) or a step decrease in speed (Slow trials). They took 0.45 s more or 0.32 s less to cover the remaining distance to the heading point compared to the balls on Ballistic trajectories.
A block of 36 trials was composed of four examples of nine different trajectories in random order. The nine trajectories were a Slow, a Ballistic, and a Fast trajectory to each of the three heading positions. Participant RP completed six blocks, the others seven.
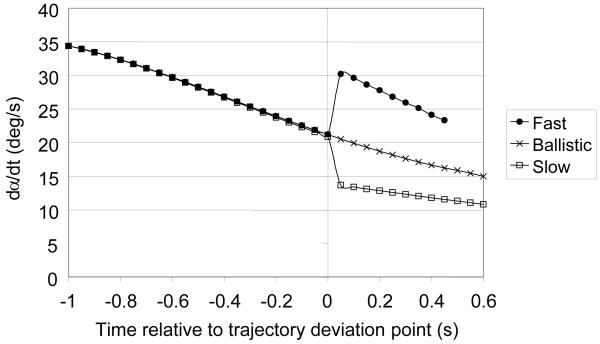
On non-Ballistic trajectories there was a step change in dα/dt (but not in the position of the ball) at the moment that the ball’s speed changed. This is illustrated in figure 6 for a ball going 2.50 m to the player’s right. As in experiment 1, an exact account of how α will change is not possible as it depends on the speed at which the player moves. The figure shows what would happen if the fielder moved at the constant speed required to reach the heading point at the same time as the ball. On Fast trajectories there is a step increase in dα/dt as the ball’s speed changes; on Slow trajectories there is a step decrease.
Figure 6.
The value of dα/dt that the player would observe if he moved at constant velocity from his starting position to the heading position and arrived at the same time as the ball for Ballistic, Fast and Slow trajectories in experiment 2. The trajectories diverge at time 0.
In this experiment no movement in depth was required. However, a sudden change in dα/dt is, according to OAC theory, a cue to the player that his speed in depth is incorrect for interception. So OAC theory predicts that the player will respond to the step change in dα/dt by an (unnecessary) movement in depth. On Slow trials where dα/dt suddenly decreases he should move forward to increase the rate of change of α. On Fast trials where dα/dt suddenly increases he should move back to reduce the rate of change of α.
Practice
Participants completed one block of 36 practice trials, four examples of each of the nine trajectory types (three Ballistic, six non-Ballistic). On completion of the experiment, all participants reported that the simulation was realistic and the task felt normal.
Results
The four participants successfully headed the ball on 99% (JB), 95% (MK), 93% (RP) and 91% (CJ) of trials. Of the 72 unsuccessful trials 62 were on Fast trajectories, 9 on Normal and 1 on Slow.
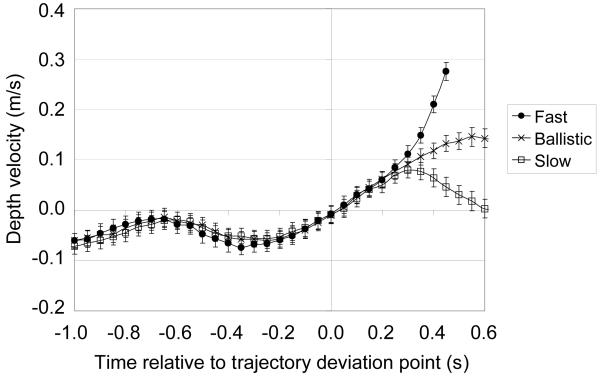
The players initially accelerated laterally and then slowed down as they approached the position where they headed the ball. About 300 ms after the ball changed velocity they either speeded up laterally (on the Fast trials) or slowed down laterally (on the Slow trials). Figure 7 shows the players’ movement in depth. Their behavior was similar at all heading positions so the data has been collapsed across the three positions. Initially the players oscillated slightly backward and forward as they ran but their average depth velocity was close to zero, as was appropriate. On Ballistic trials they moved steadily sideways until they headed the ball 2.3 s after ball launch. 1.5 s after the flight started the non-Ballistic trajectories diverged in speed. About 300 ms later the fielders moved forward on Slow trials and backward on Fast trials. t-test comparisons show that the first time after trajectory deviation at which the velocities were reliably different are: Fast vs. Ballistic = 300 ms, (t(755) = 2.3; p < 0.025); Ballistic vs. Slow = 333 ms (t(818) = 2.01; p = 0.005).
Figure 7.
The players’ velocity in depth on Fast, Ballistic and Slow trajectories (with 95% confidence intervals). Negative velocity indicates forward movement. The trajectories diverge at time 0.
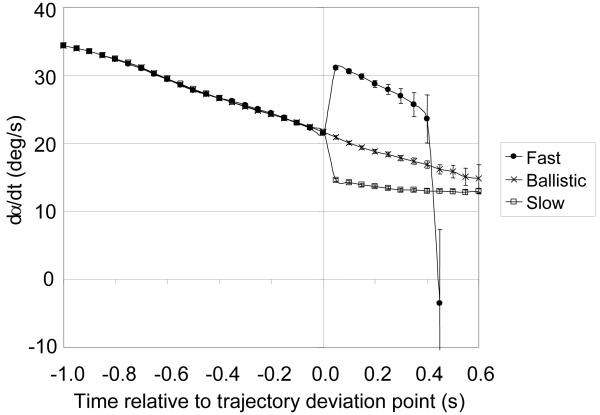
Figure 8 shows how dα/dt changed. On Ballistic trials it remained positive, declining steadily throughout the flight. 1.5 s after the start of the non-ballistic trajectories there was a step change in dα/dt, an increase on Fast trials and a decrease in Slow trials. The consequence of the players’ subsequent movement (shown in figure 7) was to reduce the rate of change of α on Fast trials and to increase the rate of change on Slow trials.
Figure 8.
The rate of change of α experienced by the players for Fast, Slow and Ballistic trials (with 95% confidence intervals). The trajectories diverge at time 0.
As in experiment 1, figure 8 suggests that there is a memory component in the control system. That is, the result of the player’s reaction to the visual disturbance is to get the trajectory of dα/dt through time back to approximately where it would have been without the disturbance. On the Fast trials the result of the disturbance was a step increase in the value of dα/dt after which it continued to decrease. According to OAC theory this should be satisfactory for the player as α was still increasing at a decreasing rate. However, the players’ response was to reduce dα/dt back towards the value it would have had without the disturbance. It usually overshot that value but this is hardly surprising given the inertia of the human body after a sudden acceleration. On Slow trials the value of dα/dt after the disturbance was still positive so, according to OAC theory, the players should have moved in a way that continued to reduce it. In fact they moved in a way that kept it roughly constant. What they appear to be doing was trying to get it back to the value it would have had, had it not been for the disturbance.
As in experiment 1, the results show that it is not the absolute vertical optical velocity which matters but that value compared to what it has been throughout the flight. In figure 8 it can be seen that on Fast trials the value of dα/dt jumps to ~ 30 °/s at the deviation point. This is less than it was at the beginning of the flight when players made no movement in depth but at the deviation point in the flight it causes them to suddenly move backward. Similarly, on Slow flights, dα/dt dropped to ~ 15 ° /s at the deviation point. This value caused them to suddenly move forward. But on Ballistic flights that was close to the value of dα/dt at the end of the flight when the players were moving slightly backward. As in the first experiment, it is not the absolute value of dα/dt that matters, with high values causing the player to move back and low values causing him to move forward, it is the time history of dα/dt. Again, the way that the players responded to a particular value of dα/dt depended on how far into the flight that value occured.
Discussion
Both experiments provide direct evidence that soccer players intercept balls approaching them in the air by moving so that their angle of elevation of gaze increases at a steadily decreasing rate throughout the flight. In experiment 1, approximately one reaction time after a step reduction in dα/dt to a value close to zero (i.e., α became constant) the participants accelerated forward, starting α increasing again. In experiment 2 the result of the players’ movement one reaction time after a step change in dα/dt was again to nullify that change. When the disturbance had reduced dα/dt, they moved forward, increasing it; when the disturbance had increased dα/dt they moved back and reduced it. This behavior is consistent with a modified version of the OAC theory of interception in which the interception algorithm includes a memory of the pattern of change in dα/dt as the ball is tracked and an expectation that the change will be smooth. If this expectation is violated by a step change in dα/dt, a backward or forward acceleration is initiated to try and return dα/dt to the value it would have had without the disturbance.3
Some theories of how people intercept balls on ballistic trajectories assume that the strategy should be seen as servo mechanism (e.g., Marken, 2001; McBeath et al., 1995; McLeod et al., 2006). The observer watches the ball as he runs and continually uses the visual and/or proprioceptive information gained from tracking it to adjust the speed and direction in which he runs. He doesn’t know where to go, only how to get there. An alternative view is that skilled ball-game players watch the early part of the ball’s flight, recognise (or compute) a trajectory and go to the place where they believe the ball will fall (Adair, 1995). Although the evidence for this has been largely anecdotal rather than experimental, based on people observing baseball players (e.g., Chodosh et al.,1995), it has not been easy to distinguish these alternatives with normal ball trajectories. The fielder gets to the right place and it is difficult to tell whether he knew from the outset where to go or whether he continually updated his velocity and direction as he ran.
It is clear that the participants in these experiments were using a servo strategy. One reaction time after a disturbance to the information provided by the ball flight they adjusted their running pattern in a way that nullified the disturbance. The players were watching the ball, taking in visual information continuously and reacting to it in the tightest possible servo loop – a lag of one reaction time between visual disturbance and responsive action. Their behavior is not consistent with the claim that a decision about where the ball will land is made from initial observation of the ball’s trajectory and the player runs there and waits for it. In experiment 1 the participants had a small number of heading points to remember and the ball reached them at the same time whether on a Ballistic or Linear trajectory. Once the participants had decided which trajectory it was they could have moved to the correct place. Continuously watching the ball and reacting to its position, as servo theories predict, reduced their chance of successfully heading the ball on the perturbed trials, but that is nevertheless what they did.
LOT theory
An alternative to the OAC theory of how people intercept objects on ballistic trajectories is Linear Optic Trajectory (LOT) theory (e.g., McBeath et al., 1995; Shaffer, McBeath, Roy, & Krauchunas, 2003). The two theories agree on the basic principle that the fielder views the ball as he runs and makes continuously updated decisions of the direction and speed at which to run based on information he gets from watching the ball. The fielder does not know where to go to catch the ball but knows a strategy that, continuously applied as he runs, will get him to the right place at the right time. The two theories disagree on the nature of the information that underlies the decision about which speed and direction to run. According to OAC theory the fielder runs so that α increases at a steadily decreasing rate. According to LOT theory the fielder runs so that the vertical angle α remains in constant proportion to the lateral angle β between fielder and ball (see Shaffer et al., 2003 for a description of how β is derived.) If LOT theory is correct, a plot of α against β will be linear, demonstrating the linear optic trajectory after which the theory is named.
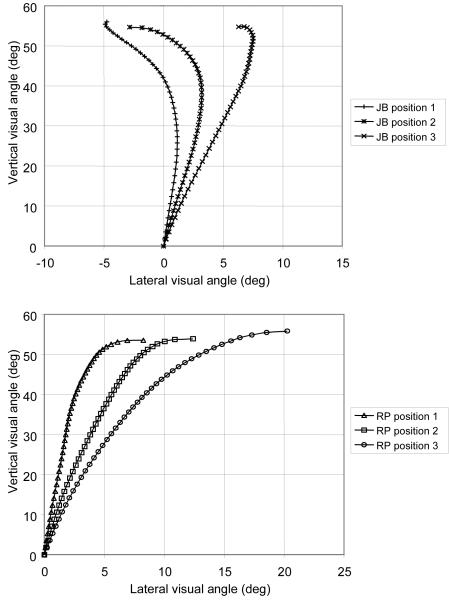
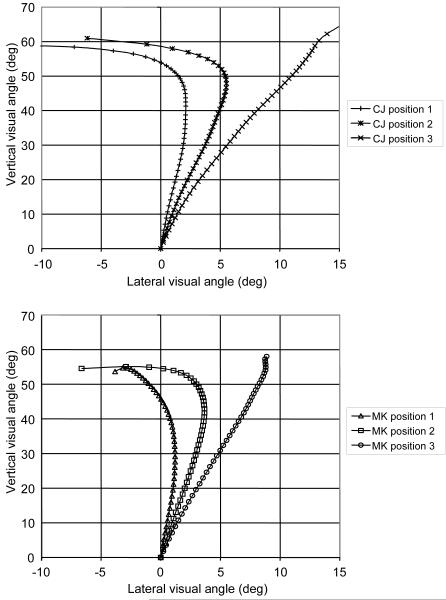
Figures 9 and 10 show plots of α against β for the four players as they moved to head the ball in each of the three positions in experiment 2. The plots show the values averaged over all successful interceptions. In each case both α and β increased initially as the ball rose in the air and moved to the side of the player. Once they started to move, the players followed different interception strategies. RP allowed both α and β to increase as he ran. That is he approached the ball from the side. The other three players used a different strategy. After the initial increase in β, they moved fast enough to positions 1 and 2 to get slightly ahead of the ball, shown by the negative value of β. As the distance increased they failed to get ahead of the ball but JB and MK kept the lateral angle more or less constant, that is, they kept roughly in line with the ball, while CJ allowed it to increase at a steady rate.
Figure 9.
The optic trajectories (as defined by LOT theory) experienced by JB (upper) and RP (lower) as they ran to head balls on Ballistic trajectories at positions 1-3. The trajectories are shown at 50 ms intervals.
Figure 10.
The optic trajectories (as defined by LOT theory) experienced by CJ (upper) and MK (lower) as they ran to head balls on Ballistic trajectories at positions 1-3. The trajectories are shown at 50 ms intervals.
In the majority of plots there is no sign of linearity once the player starts to run.4 So there is no support for the claim of LOT theory that they are trying to achieve interception by maintaining a linear optic trajectory. The curvature shown by these optic trajectory plots is similar to that which McLeod et al. (2002) showed was in the original data presented by McBeath et al (1995) to support the claim that the optic trajectories of people running to catch the ball were linear. RP does not show a linear plot to any of the positions. JB, CJ and MK show linear plots to one of the three positions, position 3 but not to the others. It appears that there are many strategies for control of the lateral angle (as claimed by Generalised OAC theory, McLeod et al., 2006) and not just one (as claimed by LOT theory). The linear plot of lateral versus vertical visual angle predicted by LOT can be found, but only under certain circumstances by certain players. It is not the single general solution used to achieve interception.
In these experiments we have adopted the approach common in psychophysical studies of using a small number of participants but examining their behaviour over a large number of trials. The fact that the four players used different lateral strategies demonstrates a possible problem with this approach. There may be a range of strategies used by different people and a small number of participants may fail to reveal them all. In a study of ball catching using a larger number of participants, McLeod et al (2006) found that although all participants used the OAC strategy to control movement in depth, they used different strategies for lateral control, just as in this experiment. The fact that all participants in these studies appear to use the same strategy in depth but use a range of lateral interception strategies is one of the reasons why the Generalised OAC theory, in which depth and lateral interception strategies are independent, seems preferable to LOT theory in which there is only one way in which depth and lateral interception strategies can be linked.
α or tanα?
What is the correct description of the players’ strategy in this experiment? We have described them as trying to ensure that the angle of elevation of gaze increases at a steadily decreasing rate. Chapman originally formulated OAC theory as fielders trying to keep the tangent of the angle of elevation of gaze increasing at a constant rate. Are players trying to control the angle of elevation of gaze or its tangent as they move? Although several studies of catching have reported that tanα increases at a constant rate, it will also be the case with such data that α increased at a steadily decreasing rate.
We believe that to describe the player’s strategy in terms of the rate of change of α (rather than tanα) is a natural choice as the rate of change of α is the input that comes from tracking the ball. McLeod and Maass (2003) showed that an interception strategy involving the rate of change of α can be discovered by an evolutionary connectionist network that tracks a ball thrown towards it, is given the goal of intercepting it, given feedback about whether or not it has been successful, and searches for a network structure that produces successful interception. They showed that such networks successfully intercept balls by discovering a simple strategy that ensures that their angle of elevation of gaze to the ball increases at steadily decreasing rate.
dα/dt or d2α/dt2?
We have described the player’s strategy as trying to keep dα/dt positive but decreasing. This could be described in terms of a strategy involving d2α/dt2. For example, it would be possible to keep d2 α/dt2 at or close to a particular negative value, but this does not amount to quite the same thing. It does not guarantee that dα/dt2 remains within a target range, as we have advocated here.
How real is virtual reality?
No matter how accurate the visual representation of a virtual reality simulation, the participant knows he is in a simulation. In this experiment the participants knew that they were not in a park but in an enclosed space. When they ‘headed’ the ball, they knew they were not making contact with a real football. Did this knowledge affect their behaviour? As Zaal and Michaels (2003) suggest, unless there is evidence that the participants’ behaviour on ‘normal’ trials in a virtual reality simulation matches their behaviour in the outside world it is unwise to extrapolate to their real world strategy from their behaviour on trials where the visual information is manipulated.
This simulation appeared to satisfy the ‘normal trials’ test. On Ballistic trials the participants used the same interception strategy that is used by people catching real balls – they moved so that the angle of gaze to the ball increased at a steadily decreasing rate. So it is reasonable to interpret their behaviour on trials where the visual information was manipulated as evidence of their real world interception strategy.
A comparison with Zaal and Michaels (2003)
Zaal and Michaels (2003) reported the first virtual reality study of the visual cues used by an observer to decide whether to move backwards or forwards to intercept a ball coming towards them. They used a CAVE system in which the observer is inside a cube and views images projected onto the walls through shutter glasses which allow different images to be presented to the two eyes.
The immersive head mounted system which we used has some advantages over the CAVE system used by Zaal and Michaels: (i) Participants in the CAVE had a limited field of view because of the shutter glasses. Ours had 112° horizontal field of view at all times. (ii) In the CAVE the resolution drops off as the observer approaches the wall because each pixel on the screen subtends a larger angle at the eye, with a perceived drop in quality. In our simulation the resolution remained constant at 3.4 pixels per degree irrespective of the position of the player. (iii) There was no ceiling to Zaal and Michaels’ CAVE, limiting the range of ball trajectories that could be used. Also, the vertical field of view was determined by the observer’s distance from the front wall. Our virtual world surrounded the observer, giving a constant vertical field of view. (iv) There were longer lags between movement of the observer and appropriate movement of the visual world in Zaal and Michaels’ simulation, 80 - 120 ms vs 50 ms in ours. Short lags between action and the resulting visual change are a crucial factor in making the simulation feel realistic to a moving observer (see Foulkes & Miall, 2000). A disadvantage of the head-mounted system is the weight of the headset worn by the observer might inhibit sudden movements. Both Zaal and Michaels and our simulations took place in a restricted space which limits the range of trajectories that can be investigated because of the limited distance that the participants can move.
Footnotes
For effective interception in a full 2-D plane where the fielder has to run sideways as well as backward or forward to catch the ball, the OAC strategy in depth must be combined with one that ensures the fielder runs sideways at an appropriate speed (see the Generalised OAC theory of interception, McLeod et al., 2006 and Linear Optic Trajectory (LOT) theory, McBeath, Shaffer & Kaiser, 1995.)
Although the strategy used on trials in which the players are unsuccessful is interesting, it is unclear what the players are doing. They may be trying to follow their normal strategy but failing, they may start with their normal strategy but give up when they think they have no chance of reaching the ball, they may be trying a different strategy. Restricting the analysis to successful trials is likely to give a clearer picture of the normal strategy.
Rozendaal and van Soest (2003) demonstrated mathematically that there are limitations to OAC as a universal interception strategy as it does not generate appropriate behaviour for interception of objects on certain trajectories such as ones that start a long way below the eye height of the observer or if the ball is hit away from the observer. However, these considerations do not apply to football where they either would never occur or they would occur in situations where the observer would not try to intercept the ball.
The plots may appear linear until near the end. A straight edge placed against the plots makes the curvature apparent.
References
- Adair RK. Play ball! Science. 1995;268:1681–1682. doi: 10.1126/science.7792584. [DOI] [PubMed] [Google Scholar]
- Brancazio P. Looking into Chapman’s homer: The physics of judging a fly ball. American Journal of Physics. 1985;53:849–855. [Google Scholar]
- Brouwer A-M, Lopez-Moliner J, Brenner E, Smeets J. Determining whether a ball will land behind or in front of you: Not just a combination of expansion and angular velocity. Vision Research. 2006;46:382–391. doi: 10.1016/j.visres.2005.09.002. [DOI] [PubMed] [Google Scholar]
- Chapman S. Catching a baseball. American Journal of Physics. 1968;36:868–870. [Google Scholar]
- Chodosh LA, Lifson LE, Tabin C. On catching fly balls (skillfully) Science. 1995;268:1681. [Google Scholar]
- Dienes Z, McLeod P. How to catch a cricket ball. Perception. 1993;22:1427–1439. doi: 10.1068/p221427. [DOI] [PubMed] [Google Scholar]
- Foulkes A, Miall R. Adaptation to visual feedback delays in a human manual tracking task. Experimental Brain Research. 2000;131:101–110. doi: 10.1007/s002219900286. [DOI] [PubMed] [Google Scholar]
- Gilson S, Fitzgibbon W, Glennerster A. Quantitative analysis of accuracy of an inertia/acoustic 6DOF tracking system in motion. Journal of Neuroscience Methods. 2006;154:175–182. doi: 10.1016/j.jneumeth.2005.12.013. [DOI] [PMC free article] [PubMed] [Google Scholar]
- Marken RS. Controlled variables: Psychology as the center fielder views it. American Journal of Psychology. 2001;114:259–282. [PubMed] [Google Scholar]
- McBeath MK, Shaffer DM, Kaiser MK. How baseball fielders determine where to run to catch fly balls. Science. 1995;268:569–573. doi: 10.1126/science.7725104. [DOI] [PubMed] [Google Scholar]
- McLeod P, Dienes Z. Do fielders know where to go to catch the ball or only how to get there? Journal of Experimental Psychology: Human Perception and Performance. 1996;22:531–543. [Google Scholar]
- McLeod P, Reed N, Dienes Z. Towards a unified fielder theory: What we do not yet know about how fielders run to catch the ball. Journal of Experimental Psychology: Human Perception and Performance. 2001;27:1347–1355. doi: 10.1037//0096-1523.27.6.1347. [DOI] [PubMed] [Google Scholar]
- McLeod P, Reed N, Dienes Z. The optic trajectory is not a lot of use if you want to catch the ball. Journal of Experimental Psychology: Human Perception and Performance. 2002;28:1499–1501. doi: 10.1037//0096-1523.28.6.1499. [DOI] [PubMed] [Google Scholar]
- McLeod P, Maass B. Evolutionary connnectionism. In: Quinlan P, editor. Connectionism and developmental psychology. Psychology Press; Hove: 2003. [Google Scholar]
- McLeod P, Reed N, Dienes Z. How fielders arrive in time to catch the ball. Nature. 2003;426:244–245. doi: 10.1038/426244a. [DOI] [PubMed] [Google Scholar]
- McLeod P, Reed N, Dienes Z. The Generalised Optic Acceleration Cancellation Theory of Catching. Journal of Experimental Psychology: Human Perception and Performance. 2006;132:139–148. doi: 10.1037/0096-1523.32.1.139. [DOI] [PubMed] [Google Scholar]
- Michaels CF, Oudejans RD. The optics and actions of catching fly balls: Zeroing out optic acceleration. Ecological Psychology. 1992;4:199–222. [Google Scholar]
- Mori R, Miyazaki F. GAG (gaining angle of gaze) strategy for ball tracking and catching task; Proceedings of IEEE/RSJ International Conference on Intelligent Robots and Systems; 2002.pp. 281–286. [Google Scholar]
- Oudejans R, Michaels C, Bakker F, Davids K. Shedding some light on catching in the dark: Perceptual mechanisms for catching fly balls. Journal of Experimental Psychology: Human Perception and Performance. 1999;25:531–542. doi: 10.1037//0096-1523.25.2.531. [DOI] [PubMed] [Google Scholar]
- Rozendaal LA, van Soest AJ. Optical acceleration cancellation: a viable interception strategy? Biological Cybernetics. 2003;89:415–425. doi: 10.1007/s00422-002-0393-3. [DOI] [PubMed] [Google Scholar]
- Shaffer DM, McBeath MK, Roy WL, Krauchunas SM. A linear optical trajectory informs the fielder where to run to the side to catch fly balls. Journal of Experimental Psychology: Human Perception and Performance. 2003;29:1244–1250. doi: 10.1037/0096-1523.29.6.1244. [DOI] [PubMed] [Google Scholar]
- Tcheang L, Gilson S, Glennerster A. Systematic distortions of perceptual stability investigated using immersive Virtual Reality. Vision Research. 2005;45:2177–2189. doi: 10.1016/j.visres.2005.02.006. [DOI] [PMC free article] [PubMed] [Google Scholar]
- Zaal F, Michaels C. The information for catching balls: judging and intercepting virtual balls in a CAVE. Journal of Experimental Psychology: Human Perception and Performance. 2003;29:537–555. doi: 10.1037/0096-1523.29.3.537. [DOI] [PubMed] [Google Scholar]


