Abstract
A treatability study of industrial wastewater containing chlorinated nitroaromatic compounds (CNACs) by a catalytic ozonation process (COP) with a modified Mn/Co ceramic catalyst and an aerobic sequencing batch reactor (SBR) was investigated. A preliminary attempt to treat the diluted wastewater with a single SBR resulted in ineffective removal of the color, ammonia, total organic carbon (TOC) and chemical oxygen demand (COD). Next, COP was applied as a pretreatment in order to obtain a bio-compatible wastewater for SBR treatment in a second step. The effectiveness of the COP pretreatment was assessed by evaluating wastewater biodegradability enhancement (the ratio of biology oxygen demand after 5 d (BOD5) to COD), as well as monitoring the evolution of TOC, carbon oxidation state (COS), average oxidation state (AOS), color, and major pollutant concentrations with reaction time. In the COP, the catalyst preserved its catalytic properties even after 70 reuse cycles, exhibiting good durability and stability. The performance of SBR to treat COP effluent was also examined. At an organic loading rate of 2.0 kg COD/(m3·d), with hydraulic retention time (HRT)=10 h and temperature (30±2) °C, the average removal efficiencies of NH3-N, COD, BOD5, TOC, and color in a coupled COP/SBR process were about 80%, 95.8%, 93.8%, 97.6% and 99.3%, respectively, with average effluent concentrations of 10 mg/L, 128 mg/L, 27.5 mg/L, 25.0 mg/L, and 20 multiples, respectively, which were all consistent with the national standards for secondary discharge of industrial wastewater into a public sewerage system (GB 8978-1996). The results indicated that the coupling of COP with a biological process was proved to be a technically and economically effective method for treating industrial wastewater containing recalcitrant CNACs.
Keywords: Industrial wastewater, Catalytic ozonation, Sequencing batch reactor, Chlorinated nitroaromatic compounds
1. Introduction
Chlorinated nitroaromatic compounds (CNACs) such as chloronitrobenzenes (ClNBs) are massively produced and widely used as intermediates for the chemical syntheses of drugs, herbicides, pesticides, dyes, lumber preservatives, antioxidants, gasoline additives, corrosion inhibitors, and other industrial chemicals. The natural formation of CNACs is rare; most are industrially produced and as such have been introduced into the environment over a relatively short period. In the 1980s, several developed countries decreased or ceased the production of ClNBs and now import ClNBs from China and other Asian countries. The total production of ClNBs in China rapidly increased from ca. 465 000 t in 2005 to ca. 625 000 t in 2009, accounting for over 70% of the total annual global production, with China now being the largest ClNBs producer (Liang, 2007; Liu, 2009).
During the synthesis of CNACs, side-products are very often formed, which carry more than the desired number of nitro- or chloro-groups. These higher chlorinated or nitrated compounds usually end up in the wastewater of production plants; hence, discharge of the wastewater is a main source of environmental CNACs. It has been reported that CNACs possess a diversity of toxicity for humans and animals, including hematotoxicity, which can result in methemoglobinemia and/or anemia, immunotoxicity, splenotoxicity, genotoxicity, hepatoxicity, nephrotoxicity and carcinogenicity (Nair et al., 1986a; 1986b; Volskay and Grady, 1990; Travlos et al., 1996; Li et al., 1998; 1999). Therefore, the pollution of soil and groundwater and perturbations in the ecosystem as well as the serious health risks posed by CNACs have given rise to growing concern in China.
Among alternative treatment processes to eliminate CNACs from water, biological process-based technologies are presumably more cost-effective than physicochemical processes. However, microbial degradation of CNACs is difficult, as CNACs are more resistant to microbial attack than non-CNACs due to the electron-withdrawing properties of the chloro- and nitro-groups on the aromatic ring (Siuda and DeBernardis, 1973).
Recently, much work has been done on separating the source of the refractory or toxic effluent and treating it by advanced oxidation processes (AOPs) (Beltrán et al., 1999; Martínez et al., 2003; Lei et al., 2007; Melero et al., 2009). Ozonation is one of the most promising oxidative techniques for the abatement of refractory and/or toxic organic pollutants in water and wastewater (Selçuk et al., 2006; Wert et al., 2007; Coca et al., 2007; Lan et al., 2008; Lucas et al., 2009). In aqueous solution, ozone reacts with organic compounds through two pathways: direct reaction of ozone molecule and radical type reaction that involves hydroxyl radical (·OH) from the decomposition of ozone (Hoigné and Bader, 1976). ·OH (E 0=+2.80 V) is non-selective and reacts very fast with most of the species, while direct reaction involving ozone molecule (E 0=+2.07 V) is very selective and unable to effectively degrade some refractory pollutants (Rice, 1997).
Accordingly, the high ozone dosages frequently required due to the complexity of the effluent make ozonation process economically unfavorable. In order to improve the performance of ozonation in the abatement of refractory organic pollutants, homogeneous and heterogeneous catalysts have been used by several researchers for the treatment of industrial effluents (Lin and Wang, 2003; Faria et al., 2009; Zeng et al., 2009; Sreethawong and Chavadej, 2008; Carbajo et al., 2007). This is catalytic ozonation process (COP), aiming to enhance the removal of more refractory compounds through the transformation of ozone into more active species and/or through adsorption and reaction of the pollutants on the surface of the catalyst (Kasprzyk-Hordern et al., 2003).
Due to the complexity of industrial wastewater containing CNACs, to the best of our knowledge, the literature regarding this type of wastewater treatment has been scarce. Consequently, the objective of the present study was to investigate the effectiveness of COP-sequencing batch reactor (SBR) coupled process for the treatment of the recalcitrant industrial wastewater originating from a fine chemical-producing factory and to make the effluent consistent with the national discharge limits.
2. Materials and methods
2.1. Materials
All chemicals were purchased from Sinopharm Chemical Reagent Co. Ltd. (Shanghai, China) with high purity and were used as received. The chemicals used in this study for chemical analysis included cobalt acetate tetrahydrate, manganese acetate tetrahydrate, sulfuric acid, sodium hydroxide, potassium iodide, 2-chloroaniline (2-ClA), 4-nitrophenol (4-NP), and 2- and 4-chloronitrobenzene (2-ClNB and 4-ClNB). Methyl tertiary butyl ether (MTBE) used for extraction was of high performance liquid chromatography (HPLC) grade and was purchased from Merck Schuchardt OHG, Germany. All other reagents for chemical oxygen demand (COD), total organic carbon (TOC), and biology oxygen demand after 5 d (BOD5) were of analytical grade or higher. All glassware was immersed in chromic acid mixture and then washed with tap water and distilled water prior to use.
The industrial wastewater was obtained from an equalization basin of a fine chemical-producing factory (Zhejiang, China), which manufactures a variety of organic chemicals such as nitrophenols, chloronitrobenzenes, chloroanilines, etc. The wastewater had a dark color and a strong pungent odor. The physicochemical characteristics of the raw wastewater are presented in Table 1.
Table 1.
Physicochemical characteristics of raw wastewater
| Items | Range |
| COD (mg/L) | 2 840–3 120 |
| BOD5 (mg/L) | 378–442 |
| TOC (mg/L) | 1 045.0–1 216.4 |
| pH | 12.7–12.9 |
| SS (g/L) | 19.7–21.3 |
| IC (mg/L) | 4.9–22.6 |
| NH3-N (mg/L) | 18.9–30.7 |
| Cl− (mg/L) | 1 210.0–1 290.1 |
| NO3− (mg/L) | 554.1–578.2 |
| Color (multiple) | 3 000 |
| Absorbance (λmax=400 nm) | 3.1543 (five-fold dilution) |
COD: chemical oxygen demand; BOD5: biology oxygen demand after 5 d; TOC: total organic carbon; SS: suspended solid; IC: ion chromatography
The heterogeneous catalyst applied in the COP was prepared by the impregnation method. Porous catalyst support, mainly made of type CD01 diatomite (Shengzhou Huali Diatomite products Co. Ltd., Zhejiang, China), was purchased from Suzhou Zhonghui Ceramic Co. Ltd. (Jiangsu, China). The monolithic support was cylindrical with a diameter of 57 mm and a length of 55 mm; the pore density of the ceramic rings was 400 pores per square inch with a wall thickness of 0.4 mm. The preparation procedure was as follows: washed ceramic supports were immersed in a mixed aqueous solution containing cobalt acetate tetrahydrate and manganese acetate tetrahydrate (molar ratio 3:1, loading percentages of Mn and Co were 3% and 9%, respectively) with constant shaking for 24 h to allow for adequate impregnation and adsorption. Then these were dried for 12 h at 25 °C and 12 h at 85 °C and calcined for 4 h at 700 °C. The above process was repeated three times to steadily modify catalyst loading.
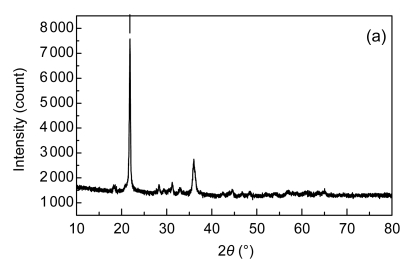
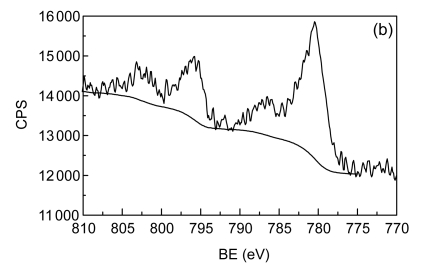
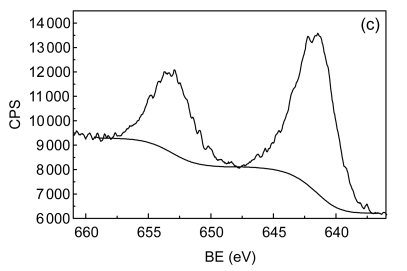
The catalyst was then characterized by nitrogen adsorption (Micromeritics TriStar II), X-ray diffraction (XRD) (Panalytical X’Pert PRO), and X-ray photoelectron spectroscopy (XPS) (Thermo ESCALAB250). Fig. 1 depicts XRD pattern and XPS Mn 2p and Co 2p spectra of the fresh catalyst used in this study. By N2 adsorption, the surface area of the Mn/Co modified ceramics was 2.77 m2/g. The phases identified by XRD are composed of SiO2 and, to a lesser extent, Co3O4, Mn3O4, and CoMn2O4, and the existence of Co3O4 and Mn3O4 phases is further corroborated by XPS analysis. With the latter technique, a small quantity of MnO2 (binding energy (BE), 642.4 eV) and CoO (BE, 796.4 eV) were also observed. Thus, the supported metals were present on catalyst surface as forms of well-dispersed divalent, trivalent, and tetravalent oxides.
Fig. 1.
X-ray diffraction (XRD) pattern (a), X-ray photoelectron spectroscopy (XPS) Co 2p (b) and Mn 2p (c) spectra of the fresh catalyst
CPS: counts per second; BE: binding energy
2.2. Catalytic ozonation process
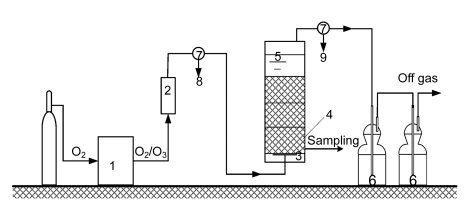
An airtight plexiglass bubble column, 80 cm high with an inner diameter of 6.0 cm and an effective volume of almost 2.0 L, was filled with 12 blocks of porous catalyst rings, acting as packed bed reactor, and the fill factor was 0.7270±0.0039. The ozonation experiment was operated in a semi-batch mode. The raw wastewater was pumped into the reactor and the ozone-containing gas was allowed to flow upward continuously. Ozone was generated from pure oxygen using a CHYF-3A model ozone generator (Rongxin Elec. Co. Ltd., China) with a maximum capacity of 50 mg O3/min. The O3/O2 mixture was fed into the reactor through a 20-μm titanium diffuser at the bottom of the reactor. Ozone concentration was regulated by altering O2 flow rate, and the excessive ozone gas was destroyed as it flowed through KI absorption bottles (Fig. 2).
Fig. 2.
Scheme of the experimental set-up
1: ozone generator; 2: rotameter; 3: porous titanium plate; 4: catalysts layer; 5: bubble column reactor; 6: KI absorption; 7: three-way valve; 8: input ozone gas detection; 9: off gas detection
The bubble column was pre-ozonated for 4 min to satisfy any ozone demand in the column before experimental operation and then washed several times with twice-distilled water to exclude possible experimental disturbance. During the ozonation experiment, the ozone concentration and its flow rate at the inlet were pre-set at 43.26 mg/L and 80 L/h, respectively. The raw wastewater pH was unadjusted as received. The porous catalyst rings were fed into the reactor by removing the base. After a given time period, the ozonated effluent was sampled for the analyses of pH, color, ammonia, oxidation reduction potential (ORP), TOC, COD, anion ions, and major pollutants. The ozonation reaction was terminated with sodium thiosulfate, except for the BOD5 tests.
2.3. Biological process
Diluted wastewater, or pretreated with COP, was subjected to the biological treatment. Two identical plexiglass SBRs (50 cm high, 10 cm i.d.) were used. The two parallel SBRs (SBR1 and SBR2) were run under nearly identical operating conditions, and the only difference was the feed composition: SBR1 and SBR2 were fed with diluted raw wastewater and the effluent of the COP, respectively. Seed sludge was taken from the activated sludge aeration tank for treating an industrial wastewater containing CNACs. The collected activated sludge was acclimated for both diluted wastewater conditions and COP-treated effluent. Air was fed continuously to ensure dissolved oxygen (DO) ≥3.0 mg O2/L. The pH was kept in the range of 7.0–8.0 by the addition of buffer solutions as needed. Appropriate amounts of phosphorus (KH2PO4) and nitrogen [(NH4)2SO4] were added to the wastewater to maintain a COD:N:P ratio of 100:5:1. Additionally, nutrient solutions were also added to the reactors (CaCl2, 18.4 mg/L; MgSO4·7H2O, 20 mg/L; FeSO4·7H2O, 16 mg/L; and yeast powder, 4.8 mg/L). Operating parameters of the SBR1 and SBR2 were the following: organic load rate, 2.0 kg COD/(m3·d); cycle length, 12 h (unaerated feed phase, 30 min; aerated phase, 600 min; settling, 75 min; sludge and effluent withdrawal, 15 min). The volume of the completely filled reactors was 3.0 L and the daily influent rate was 4.0 L/d; thus, the volumetric exchange ratio (volume fed per cycle/maximum reactor volume) was 0.67. The sludge age and food/microorganism (F/M) ratio are about 20 d and 0.15 kg COD/(kg mixed liquor volatile suspended solid (MLVSS)·d), respectively. The sludge concentration was kept constant by controlling the ratio of sludge volume after 30 min settlement (SV30) of bioreactors, and to be concretely described, the excessive sludge above SV30 line was discharged when exchanging water of the bioreactors. Temperature was maintained at (30±2) °C through an automatic temperature-control system. After a roughly seven-week acclimation period, a considerable amount of sludge was produced. The COD, TOC, ammonia, BOD5, color, MLVSS, and mixed liquor suspended solids (MLSS) were measured at this point to characterize the performance of the reactors.
2.4. Analytical methods
In order to detect major pollutants in the raw wastewater, aqueous solutions were extracted with MTBE and the extracts were concentrated by a rotary evaporator (R-210/215, Buchi, Switzerland) to approximately 500 μl. The concentrated extract samples were qualitatively analyzed by means of an Agilent HP6890N/5975B gas chromatography-mass spectrometry (GC-MS) system as described elsewhere (Li et al., 2009). Also quantification of 2-ClNB, 4-ClNB, 4-NP, and 2-ClA was accomplished with the same Waters HPLC system and analytic method as the work of Li et al. (2009).
UV-Vis-absorption spectra were recorded using a Shimadzu UV-2401PC spectrophotometer in 200–600 nm range. The pH and ORP of aqueous solutions were measured using a Delta 320 pH meter (Shanghai Mettler Toledo Instruments Ltd., China) with a model 501 ORP composite electrode (Shanghai Precision & Scientific Instrument Co. Ltd., China). The COD concentration was measured by potassium dichromate method. TOC and total inorganic carbon contents were determined with a Shimadzu TOC-VCPN analyzer. The analysis of anions during wastewater ozonation was accomplished employing a Dionex Series 1000 ion chromatography (IC) unit with a conductivity detector and a Dionex AG11-HC column. The eluent was a KOH solution (gradient elution, 1–35 mmol/L over 35 min) at a flow rate of 1.0 ml/min. MLSS, MLVSS, ammonia, and color were determined with the standard analytical methods of water and wastewater (Wei, 2002). Prior to BOD5 measurement, seed sludge was acclimated to the samples for one week. BOD5 was measured using the direct manometric method with an HACH BODTrak™ meter.
3. Results and discussion
3.1. Wastewater characterization
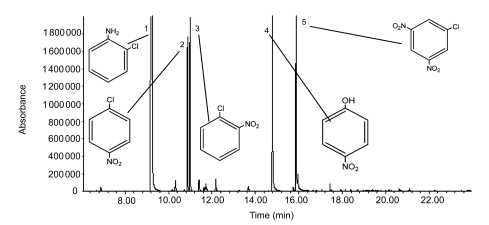
The physicochemical characteristics showed that the wastewater contained a high load of organic pollutants, represented by the COD, TOC, and BOD5 values, suspended solids (SS), nitrate and chlorine ion concentrations (Table 1). The BOD5/COD ratio ranged from 0.133 to 0.142 with an average of 0.138, confirming that this type of wastewater is not readily biodegradable. In addition, GC-MS and HPLC analyses confirmed that the raw wastewater samples contained some refractory CNACs. Fig. 3 shows the GC-MS chromatogram of raw wastewater. As can be seen here, the major organic components of the wastewater were likely 2-ClA (retention time t R=9.33 min), 4-ClNB (t R=10.868 min), 2-ClNB (t R=10.989 min), 4-NP (t R=14.788 min) and 2-chloro-4,6-dinitrophenol (2-Cl-4,6-DNP) (t R=16.233 min). Identification of the peak at 16.233 min as genuine 2-Cl-4,6-DNP is tentative due to low match quality when compared with the spectrum in the NIST05 database. In combination with HPLC analyses of authentic samples, the retention time of 2-ClA, 4-ClNB, 2-ClNB, and 4-NP was 3.670, 4.716, 7.051, and 9.150 min, respectively, which are in accordance with those of the components found in the raw wastewater. On the basis of the above results, quantification of 2-ClA, 4-ClNB, 2-ClNB, and 4-NP was realized by HPLC analysis. The wastewater concentrations of 2-ClA, 4-ClNB, 2-ClNB, and 4-NP were in the ranges of 409.1–430.8, 15.9–17.7, 24.1–26.5, and 76.4–78.0 mg/L, respectively (N=5).
Fig. 3.
GC-MS analysis of organic contaminants in industrial wastewater
Peak identities are as follows: 1: 2-ClA, 2: 4-ClNB, 3: 2-ClNB, 4: 4-NP, 5: 2-Cl-4,6-DNP (speculated)
The wastewater also had high color 3 000 (multiples), pH (12.7–12.9), and SS (19.7–21.3 g/L), while Cl−, NO3 −, and NH3-N were determined to be in the ranges of 1 210.0–1 290.1, 554.1–578.2, and 18.9–30.7 mg/L, respectively. Obviously, NH3-N was not the main concern in this process due to its low content in the wastewater. To meet the national discharge standards (GB 8978-1996), the organic contaminants and color of the wastewater needed to be greatly reduced. Through discreet analysis of raw wastewater, two sets of alternative treatments were proposed to accomplish this goal: (1) raw wastewater was first diluted roughly three-fold and then was introduced into SBR1; and (2) the wastewater was first pretreated by catalytic ozonation for a given period of time, and the pretreated effluent was subjected to SBR2. The performances of these two systems for reducing COD, TOC, NH3-N, color, and major organic pollutants were then evaluated.
3.2. Direct biological treatment of diluted wastewater in SBR1
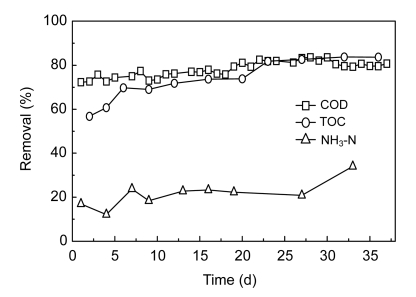
Because the wastewater was in strongly alkaline pH range, it was neutralized with sulfuric acid prior to feeding into the SBR1. The SBR1 operated for 84 d in total, including 48 d of acclimatization and 36 d of normal operation. The sludge concentration (MLVSS) varied from 4.9 to 5.6 g/L, with good settling properties, and the SBR1 ran without sludge bulking. The removal performances of COD, TOC, NH3-N, color, and major pollutants were examined. Time courses of COD, TOC, and NH3-N removal efficiencies are shown in Fig. 4. As is seen here, good COD and TOC removal efficiencies were achieved, while the removal performance for NH3-N was poor. When SBR1 was operated with influent COD concentrations of 960.0–1 184.0 mg/L and TOC concentrations of 308.0–440.8 mg/L, the COD and TOC in the effluent were 226.3–327.0 and 57.1–151.71 mg/L, respectively, corresponding to removal efficiencies in the ranges of 72.3%–83.6% and 56.8%–83.7%, respectively. The BOD5/COD ratio in the effluent was 0.11–0.16, and COD in the effluent was mainly composed of difficultly biodegradable organic matter. However, NH3-N effluent concentrations in the SBR1 reactor varied from 40.2 to 59.9 mg/L, corresponding to removal efficiencies of 12.1% to 34.0%, which indicated that nitrification performed poorly in the SBR1.
Fig. 4.
COD, TOC and NH3-N removal profiles against the operating time in SBR1
Experimental conditions: organic load rate 2.0 kg COD/(m3·d), hydraulic retention time (HRT)=10 h, T=(30±2) °C
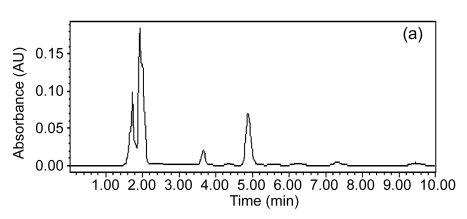
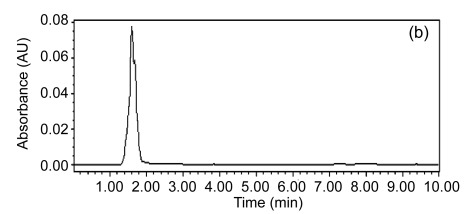
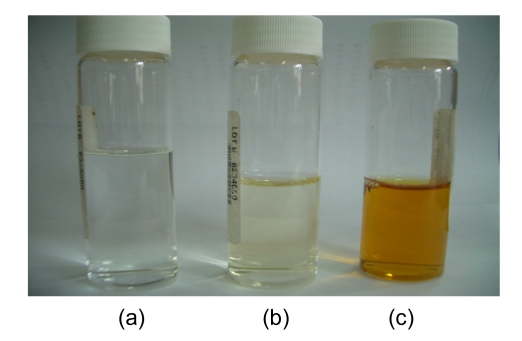
Fig. 5 presents major pollutant removals in the SBR1. It was determined that the concentrations of 2-ClA, 4-ClNB, 2-ClNB, and 4-NP in the influent were (127.19±1.32), (6.96±0.35), (5.30±0.14), and (29.85±0.32) mg/L, respectively, whereas in the effluent these major pollutants had been eliminated and transformed into other intermediates, suggesting that the characteristic of the influent was thus analogous to that of the industrial wastewater treatment plant, in that the seed sludge could rapidly adapt itself to conditions in SBR1. In other words, it was possible that highly efficient CNAC-degrading bacteria from the seed sludge played an important role in the course of degrading these CNACs. For color removal, the residual color in the effluent of SBR1 was at 300 multiples (Fig. 6c), evidencing that a single aerobic biological treatment was ineffective for decolorizing the wastewater. In summary, directly acclimated activated sludge treatment of the diluted industrial wastewater was impossible to meet the discharge standards of GB 8978-1996, which may have something with low biodegradability of the wastewater.
Fig. 5.
Typical HPLC chromatograms of the influent (a) and the effluent (b) in SBR1
Fig. 6.
Color comparison of deionized water (a), SBR2 effluent (b), and SBR1 effluent (c)
Based on the above results, we assumed that treatment of undiluted wastewater by a single SBR process could not still meet the acceptable discharge standards, and this deduction is on the following grounds: (1) the wastewater has a low BOD5/COD ratio (0.133–0.142), suggesting that it is difficult to be degraded by microorganisms; (2) some toxic components present in the wastewater, e.g., chloronitrobenzenes, have significant inhibitory effects on aerobic sludge activity. Ben et al. (2008) found that trace amounts of 4-ClNB (0.5 mg/L) could decrease the COD degradation rate constant and triphenyltetrazolium chloride (TTC)-dehydrogenase activity by about 50% and 23%, respectively, while the wastewater in our study had much higher concentrations of 4-ClNB and 2-ClNB, at 15.9–17.7 and 24.1–26.5 mg/L, respectively; and (c) the primary removal mechanism for color is the adsorption of chromophoric pollutants onto sludge and subsequent biodegradation, but high concentrations of chromophoric pollutants, e.g., 2-ClA (409.1–430.8 mg/L) and 4-NP (76.4–78.0 mg/L) have slow biodegradation rates in a single aerobic SBR (Tomei et al., 2004; Boon et al., 2000).
Due to the inability of the activated sludge treatment process to removal color and COD, many researchers have attempted to explore the integration of two or more technologies to obtain the required degree of treatment. For the treatment of the wastewater containing toxic or non-degradable pollutants, one of attractive methods is an AOP followed by a biological process (Farré et al., 2006; Ballesteros Martín et al., 2009; Christensen et al., 2009).
3.3. Coupling of COP with biological treatment
COP was employed in order to enhance wastewater biodegradability, thus escaping entire mineralization, as a pretreatment step for an ensuing biological treatment. For this purpose, preliminary experiments were first performed to discover suitable operating conditions for maximizing the biocompatibility of the industrial wastewater with a second SBR stage.
3.3.1. Catalytic ozonation of industrial wastewater containing CNACs
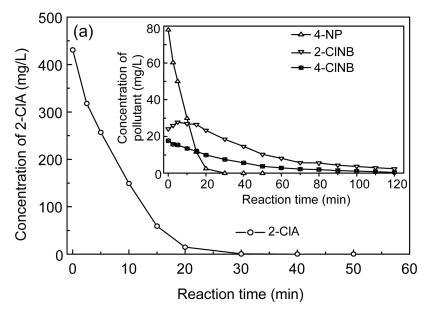
One of the important variables affecting the design and operation of an oxidation process is the oxidant dosage, which is the dosage required to attain the desired goals of the treatment. For COP, the applied specific ozone dose (expressed as mg applied ozone per mg of initial COD) varies with treatment time and affects the degradation rate and efficiency of COP. Accordingly, the first phase of this experiment was to investigate the removal of the major pollutants, COD, TOC, and color, and the enhancement of biodegradability by catalytic ozonation as a function of reaction time at an initial pH of 12.7 and an ozone concentration and flow rate at the inlet of 43.26 mg/L and 80 L/h, respectively. Fig. 7 depicts the evolution of major pollutant concentrations, Cl−, NO3 −, and NH3-N versus the reaction time under the specified conditions in the COP. Referring to Fig. 7a, it can be observed that an increase of reaction time led to an increase of CNAC conversion. Thus, 4-NP and 2-ClA had completely disappeared at 30 and 40 min, respectively, and their removal rates were well fit by zero-order kinetics (R 2>0.96). In the case of 2-ClNB and 4-ClNB ozonation, their degradations followed first-order reaction kinetics (R 2>0.98), at ozonation rates much lower than those of 4-NP and 2-ClA in the same system. There were still residual 2-ClNB and 4-ClNB in the solution, at concentrations of 2.37 and 0.45 mg/L, respectively, even after 120 min of reaction time. The removal rates of major pollutants were in the order of 2-ClA>4-NP>>4-ClNB>2-ClNB, with respective reaction rate constants of 20.22 mg/(L·min), 3.73 mg/(L·min), 0.0287 min−1, and 0.0215 min−1, which can be understood by the different reaction mechanisms; that is, the majority of 4-ClNB and 2-ClNB removal is due to hydroxyl radical oxidation whereas 4-NP and 2-ClA are very reactive towards both ozone and hydroxyl radicals (Beltrán et al., 1998; Li et al., 2009).
Fig. 7.
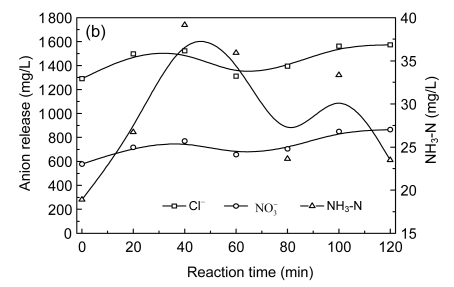
Time-evolution profiles of major pollutants (a), Cl−, NO3 − and NH3-N (b) in catalytic ozonation
Experimental conditions: initial pH 12.9, temperature 25 °C, and 55.76 mg/min of applied ozone dose
Interestingly, it can also be seen in Fig. 7a that the concentration of 2-ClNB first increased from an initial 24.13 to 27.79 mg/L at 5 min, then later decreased, perhaps resulting from 2-ClA oxidation and 2-ClNB formation. The work of Sarasa et al. (2002) arrived at similar conclusions; they found that the main byproduct formed after ozonation of p-chloroaniline was 4,4′-dichloroazobenzene, and also detected an isomer of 4,4′-dichloroazobenzene, 4-chloro-2-pyridine-carboxylic acid, and 4-ClNB.
Cleavage of nitro- and chloro-groups from the aromatic ring and their conversions to nitrate and chloride ions took place during the degradation of CNACs (Fig. 7a). Nitrite ion was seen in the reaction medium only at the initial stage of the treatment in extremely small quantities and was subsequently oxidized to nitrate ion. During the reaction process, the evolution curves of Cl− and NO3 − versus time were both “increase-decrease-increase,” which corresponded to three different phases (namely, Phase I: 0−40 min; Phase II: 40−60 min; and Phase III: 60−120 min) and different reaction mechanisms involved. In Phase I, major pollutants were converted into primary intermediates that still contained nitro- and/or chloride-groups, of which part were released in forms of Cl− and NO3 −, the concentrations of Cl− and NO3 − increased from 1 210.0 to 1 522.95 mg/L and from 554.1 to 770.0 mg/L at 40 min, respectively. In Phase II, the slight decrease in Cl− concentration following Phase I may have been due to the further oxidation of Cl− to OCl− and Cl2 species (Hoigné et al., 1985). Further formation of Cl− and NO3 − in Phase III can be explained by the cleavage of nitro- and chloro-groups from nitrated and/or chlorinated aliphatic intermediates formed during ozonation. After 120 min of reaction, the catalytic ozonation led to 283.6−363.7 mg/L of chloro-group and 285.2−309.3 mg/L of nitro-group conversion.
As for the variation of NH3-N concentration, it first increased, passing a maximum (39.15 mg/L) at about 40 min, and then decreased to 23.5 mg/L at the end of the reaction, which is in good agreement with the decomposition tendencies of 4-NP and 2-ClA. It is supposed that the increase of in NH3-N concentration may have come from the oxidation of 2-ClA and nitro-substituted compounds (Winarno and Getoff, 2002; Tanaka et al., 1997; Minero et al., 1994). Winarno and Getoff (2002) observed that ammonia was formed as one of the final degradation products resulting from ozonation of 2-ClA and its concentration was maximized when 2-ClA was completely removed; the same trend was observed with the chloride ion. Likewise, it is possible that ammonia was produced by nitro-substituted compounds in oxidative conditions, although here nitrate is a major product and ammonia is a minor one. Tanaka et al. (1997) reported that 4-NP, 3-NP, 2-NP, 2,4-dinitrophenol (2,4-DNP), and 2,4,6-trinitrophenol (2,4,6-TNP) formed nitrate and ammonia in their photocatalytic degradations, and the ratio of ammonia to nitrate varied from 0.20 to 2.07; and Minero et al. (1994) reported 0.15 for nitrobenzene. After 40 min, ammonia was slowly oxidized into nitrate by molecular ozone or hydroxyl radicals, especially at pH<9.3, although the quantity of nitrate formed was rather small (Haag et al., 1984; Hoigné and Bader, 1978).
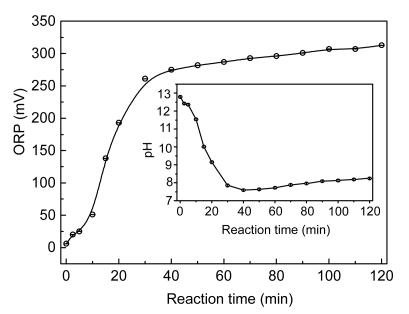
Fig. 8 shows the evolution of pH and ORP during the experiments. A sharp decrease in the pH was observed in the experiments with an initial pH of 12.9 and the final pH at 40 min was 7.6. The decline in pH is attributed to the formation of small-molecule dicarboxylic acids and organic acids, as well as carbon dioxide and carbonic acid from total mineralization. Correspondingly, there was a sharp increase in ORP up to 40 min, during which the pH of the solution underwent violent change. After 40 min, the pH and ORP stabilized.
Fig. 8.
Evolution of pH and ORP during catalytic ozonation of industrial CNACs-containing wastewater
Experimental conditions: initial pH 12.9, temperature 25 °C, and 55.76 mg/min of applied ozone dose
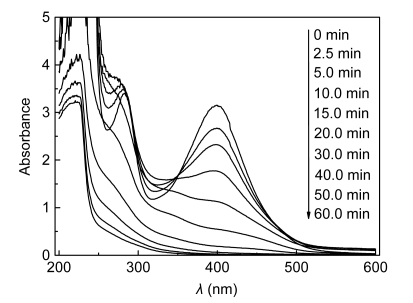
The UV-Vis spectra of the raw and ozone-treated wastewater at five-fold dilutions are shown in Fig. 9. The two main peaks at around 400 and 282 nm correspond to components of the wastewater. It is obvious that the intensity of the peaks decreased as the ozone treatment time was increased. After 40 min of treatment, the peak around 400 nm decreased by 98.0% (the initial absorbance value of 3.1543 decreased to 0.0617), and the peak at 282 nm decreased by about 80.0% (the initial absorbance value of 3.420 reduced to 0.680), which is due to fragmentation of parent pollutants to smaller-molecular-weight organic intermediates that absorb less UV-Vis light irradiation. Simultaneously, the color of the KI absorption bottles remained primrose, which suggested ozone concentration in the outlet was rather low. These results indicate that there were a significant color reduction of the raw wastewater and a high rate of ozone consumption during the first 40 min, which was clearly caused by the fast reaction of the pollutants with hydroxyl radicals and ozone molecules.
Fig. 9.
UV-Vis spectra of the raw wastewater and treated water with 5 times of dilutions as a function of time
Experimental conditions: initial pH 12.9, temperature 25 °C, and 55.76 mg/min of applied ozone dose
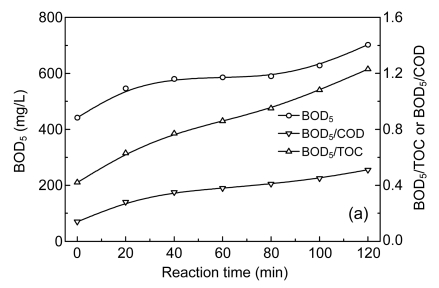
A biodegradability experiment was accomplished on treated wastewater to assess the function of an oxidation process on the biodegradability of treated wastewater. The ratios of BOD5 to both TOC and COD were selected as biodegradability indexes. BOD5 increase of a sample due to the pretreatment would mean an increase in biodegradability. Hence, an increase in BOD5/COD or BOD5/TOC ratio after pretreatment would indicate enhanced biodegradability. In this study, the wastewater containing CNACs was ozonated to examine this effect. The results are shown in Fig. 10a; the increase in biodegradability was obvious with ozone oxidation. After 120 min, BOD5, BOD5/COD, and BOD5/TOC were increased to 702 mg O2/L, 0.51, and 1.23, respectively. These results indicate that the wastewater biodegradability increased with increase of ozonation time.
Fig. 10.
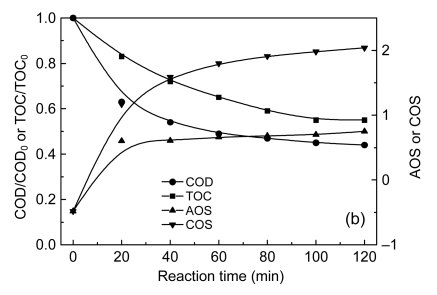
Evolution of biodegradability (a), total organic carbon (TOC), chemical oxygen demand (COD), average oxidation (AOS), and carbon oxidation state (COS) (b) as a function of ozonation time
Experimental conditions: initial pH 12.9, temperature 25 °C, and 55.76 mg/min of applied ozone dose
During the oxidation processes, it is important to correlate the biodegradability improvement to the oxidation states of chemical substances of treated solution. Two indexes integrating TOC and COD were also numerated for better monitoring of organic matter oxidation: average oxidation state (AOS) and carbon oxidation state (COS).
AOS can be calculated by means of Eq. (1) (Amat et al., 2007), which is a good index of changes in the relative composition of dissolved organic matter (APHA/AWWA/WEF, 1998). Fig. 10b indicates that AOS increased continuously during COP, suggesting that more oxidized intermediates were generated in the course of the process. This change in the composition of the organic matter also involved variations in biodegradability, as confirmed by the results shown in Fig. 10a.
The existence of a strong oxidation of organic matter was verified by the COS. This index was calculated by means of Eq. (2) (Sarria et al., 2002). In this case, TOC is mensurated at the start of the reaction (produced carbon dioxide is also considered, with an oxidation state of +4 for the carbon atom). As observed from Fig. 10b, at the start of the reaction a value of −0.48 was calculated for the COS, demonstrating the presence of rather reduced organic compounds, and by the end of the oxidation the COS was +2.04, a value associated with strong mineralization and the generation of highly oxidized intermediates.
| AOS=4−1.5COD/TOC, | (1) |
| COS=4−1.5COD/TOC0. | (2) |
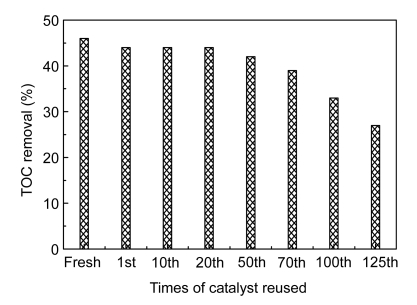
An important characteristic of a catalyst, from practical point of view, is its deactivation or potential reuse. To evaluate the capability of the catalyst used in catalytic ozonation for reuse, a series of consecutive catalytic ozonation runs were carried out reusing the catalyst up to 125 times (1 h per time) under identical conditions, except that the catalyst was reused from the previous experiment without any modifications. The TOC removal efficiency was determined after each experiment and results are plotted in Fig. 11. As indicated, the catalyst preserved its catalytic properties after 70 reuses. This can be explained by the predominance of catalytic reactions over adsorption-oxidation reactions in the catalytic ozonation. From another perspective, the good durability of the catalyst also reflects that the preparation of porous catalysts was effective. Hence, ozonation in presence of porous catalysts is a stable method for treating industrial wastewater containing CNACs.
Fig. 11.
Effect of catalyst reuse times on TOC removal in catalytic ozonation process
Experimental conditions: initial pH 12.9, temperature 25 °C, and 55.76 mg/min of applied ozone dose
3.3.2. Performance of the integrated processes
Even though AOPs have been shown to be highly efficient, their operation is still quite expensive (USD 13.7–27.3 m−3) especially for the treatment of highly polluted wastewater (Comninellis et al., 2008). A viable option is the partial oxidation of recalcitrant pollutants in AOPs to be completed by treatment in a subsequent biological process. This exploits the advantages of both processes, shortening the time required to attain high effluent quality at the lowest cost. In this study, the effluent obtained after 60 min in catalytic ozonation was used for biodegradation tests. The reaction time of 60 min, i.e., 1.15 mg O3/mg COD-applied specific ozone dose in catalytic ozonation, was selected because at this point, the color and the concentrations of toxic CNACs were greatly reduced and at the same time the BOD5/COD ratio had reached 0.39, making it suitable for treatment in a biological process (Sarria et al., 2002).
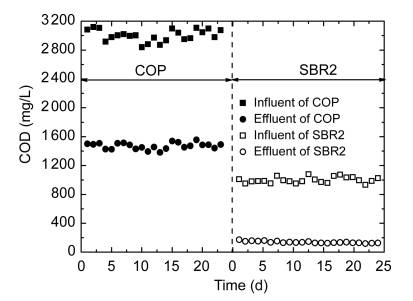
With influent NH3-N concentrations of 50.4–61.0 mg/L, the removal efficiency of ammonia was about 80%, which indicated that SBR2 had the better performance for nitrification. The reason for this good performance was that most of toxic pollutants had been removed in the chemical oxidation stage, and autotrophic bacteria could easily grow in the aerobic stage, resulting in improved ammonia removal. After 30 cycles, COD and TOC removal performances gradually stabilized. The time evolutions of COD concentration during the coupled catalytic ozonation and SBR2 biodegradation process are shown in Fig. 12. As observed, the removal efficiency of COD at SBR2 stage approached 90% while that of TOC was over 90% (data not shown), and the effluent concentrations of COD and TOC were reduced to below 130 and 25 mg/L, respectively. Thus, 44% of TOC and 51% of COD reduction (Fig. 12) was achieved in COP stage when the wastewater was treated with catalytic ozonation for 60 min, while 97.6% of TOC and 95.8% of COD were removed when employing the coupled catalytic ozonation and biological system. Also the BOD5 and color in the industrial wastewater were reduced to 27.5 mg/L and 20 multiples (Fig. 6b), respectively. Furthermore, the concentrations of major pollutants in the effluent of the coupled process were well below the detection limit (0.035 mg/L) of HPLC analysis, indicating they had been completely removed. Based on the above results, the effluent quality satisfied the national standard (GB 8978-1996) for secondary discharge of industrial wastewater into public sewerage system.
Fig. 12.
COD concentration variations in COP and subsequent SBR2 during steady-running 23 cycles
Experimental conditions: 1.15 mg O3/mg COD-applied specific ozone dose at COP stage, while at SBR2 stage, organic load rate 2.0 kg COD/(m3·d); hydraulic retention time (HRT)=10 h, T=(30±2) °C
4. Conclusion
Single biological and a coupled COP/biological treatment methods were evaluated for the treatment of industrial wastewater containing toxic and refractory CNACs. We include the following:
In a single biological treatment, major pollutants could be completely removed. However, due to its poor performance in color, ammonia, TOC, and COD removal, the treated effluent still did not satisfy the specific discharge standard.
COP with Mn/Co modified ceramic catalysts could be successfully applied as a pretreatment process to biocompatibilize the wastewater. With prolonged reaction time, the wastewater became decolorized and more biodegradable, as well as reaching a higher oxidation state. Moreover, the catalyst preserved its catalytic properties after 70 times of reuse, displaying good durability and stability.
A coupled treatment system consisting of catalytic ozonation with 1.15 mg O3/mg COD-applied specific ozone dose and subsequent SBR treatment was operated for more than 30 d. The results show that the average removal efficiencies of NH3-N, COD, BOD5, TOC, and color were about 80%, 95.8%, 93.8%, 97.6%, and 99.3%, respectively, with average effluent concentrations of 10 mg/L, 128 mg/L, 27.5 mg/L, 25.0 mg/L, and 20 multiples, complying with the national secondary discharge standard (GB 8978-1996) for discharge of industrial wastewater into a public sewerage system. Therefore, the coupled catalytic ozonation and biological process is a promising and economically viable technology for the treatment of industrial recalcitrant wastewater containing CNACs.
5. Acknowledgement
We thank the 985-Institute of Agrobiology and Environmental Sciences of Zhejiang University for providing the use of their experimental equipment.
Footnotes
Project supported by the National Natural Science Foundation of China (No. 50378082) and the Key Project of Science and Technology Plan of Zhejiang Province (No. 2004C23021), China
References
- 1.Amat AM, Arques A, Galindo F, Miranda MA, Santos-Juanes L, Vercher RF, Vicente R. Acridine yellow as solar photocatalyst for enhancing biodegradability and eliminating ferulic acid as model pollutant. Appl Catal B-Environ. 2007;73(3-4):220–226. doi: 10.1016/j.apcatb.2006.12.003. [DOI] [Google Scholar]
- 2.APHA/AWWA/WEF. Standard Methods for the Examination of Water and Wastewater. 20th Ed. Washington DC, USA: American Public Health Association/American Water Works Association/Water Environment Federation; 1998. [Google Scholar]
- 3.Ballesteros Martín MM, Sánchez Pérez JA, Casas López JL, Oller I, Malato Rodríguez S. Degradation of a four-pesticide mixture by combined photo-Fenton and biological oxidation. Water Res. 2009;43(3):653–660. doi: 10.1016/j.watres.2008.11.020. [DOI] [PubMed] [Google Scholar]
- 4.Beltrán FJ, Encinar JM, Alonso MA. Nitroaromatic hydrocarbon ozonation in water. 1. Single ozonation. Ind Eng Chem Res. 1998;37(1):25–31. doi: 10.1021/ie9704253. [DOI] [Google Scholar]
- 5.Beltrán FJ, García-Araya JF, Frades J, Álvarez P, Gimeno O. Effects of single and combined ozonation with hydrogen peroxide or UV radiation on the chemical degradation and biodegradability of debittering table olive industrial wastewaters. Water Res. 1999;33(3):723–732. doi: 10.1016/S0043-1354(98)00239-5. [DOI] [Google Scholar]
- 6.Ben Y, Chen Z, Xu Z, Shen J. Effect of p-chloronitrobenzen on aerobic sludge activity and pollutants biodegradation kinetics. China Water Wastewater. 2008;24(21):102–105. (in Chinese) [Google Scholar]
- 7.Boon N, Goris J, Vos PD, Verstraete W, Top EM. Bioaugmentation of activated sludge by an indigenous 3-chloroaniline-degrading Comamonas testosteroni strain, I2gfp. Appl Environ Microbiol. 2000;66(7):2906–2913. doi: 10.1128/AEM.66.7.2906-2913.2000. [DOI] [PMC free article] [PubMed] [Google Scholar]
- 8.Carbajo M, Beltrán FJ, Gimeno O, Acedo B, Rivas FJ. Ozonation of phenolic wastewaters in the presence of a perovskite type catalyst. Appl Catal B-Environ. 2007;74(3-4):203–210. doi: 10.1016/j.apcatb.2007.02.007. [DOI] [Google Scholar]
- 9.Christensen A, Gurol MD, Garoma T. Treatment of persistent organic compounds by integrated advanced oxidation processes and sequential batch reactor. Water Res. 2009;43(16):3910–3921. doi: 10.1016/j.watres.2009.04.009. [DOI] [PubMed] [Google Scholar]
- 10.Coca M, Peña M, González G. Kinetic study of ozonation of molasses fermentation wastewater. J Hazard Mater. 2007;149(2):364–370. doi: 10.1016/j.jhazmat.2007.04.006. [DOI] [PubMed] [Google Scholar]
- 11.Comninellis C, Kapalka A, Malato S, Parsons SA, Poulios I, Mantzavinos D. Advanced oxidation processes for water treatment: advances and trends for R & D. J Chem Technol Biotechnol. 2008;83(6):769–776. doi: 10.1002/jctb.1873. [DOI] [Google Scholar]
- 12.Faria PCC, Órfão JJM, Pereira MFR. Activated carbon and ceria catalysts applied to the catalytic ozonation of dyes and textile effluents. Appl Catal B-Environ. 2009;88(3-4):341–350. doi: 10.1016/j.apcatb.2008.11.002. [DOI] [Google Scholar]
- 13.Farré MJ, Doménech X, Peral J. Assessment of photo-Fenton and biological treatment coupling for diuron and linuron removal from water. Water Res. 2006;40(13):2533–2540. doi: 10.1016/j.watres.2006.04.034. [DOI] [PubMed] [Google Scholar]
- 14.Haag WR, Hoigné J, Bader H. Improved ammonia oxidation by ozone in the presence of bromide ion during water treatment. Water Res. 1984;18(9):1125–1128. doi: 10.1016/0043-1354(84)90227-6. [DOI] [Google Scholar]
- 15.Hoigné J, Bader H. The role of hydroxyl radical reaction in ozonation process in aqueous solution. Water Res. 1976;10(5):377–386. doi: 10.1016/0043-1354(76)90055-5. [DOI] [Google Scholar]
- 16.Hoigné J, Bader H. Ozonation of water: kinetics of oxidation of ammonia by ozone and hydroxyl radicals. Environ Sci Technol. 1978;12(1):79–84. doi: 10.1021/es60137a005. [DOI] [Google Scholar]
- 17.Hoigné J, Bader H, Haag WR, Staehelin J. Rate constants of reactions of ozone with organic and inorganic compounds in water-III. Water Res. 1985;19(8):993–1004. doi: 10.1016/0043-1354(85)90368-9. [DOI] [Google Scholar]
- 18.Kasprzyk-Hordern B, Ziólek M, Nawrocki J. Catalytic ozonation and methods of enhancing molecular ozone reactions in water treatment. Appl Catal B-Environ. 2003;46(4):639–669. doi: 10.1016/S0926-3373(03)00326-6. [DOI] [Google Scholar]
- 19.Lan BY, Nigmatullin R, Puma GL. Ozonation kinetics of cork-processing water in a bubble column reactor. Water Res. 2008;42(10-11):2473–2482. doi: 10.1016/j.watres.2008.01.030. [DOI] [PubMed] [Google Scholar]
- 20.Lei L, Gu L, Zhang X, Su Y. Catalytic oxidation of highly concentrated real industrial wastewater by integrated ozone and activated carbon. Appl Catal A-Gen. 2007;327(2):287–294. doi: 10.1016/j.apcata.2007.05.027. [DOI] [Google Scholar]
- 21.Li B, Xu X, Zhu L. Ozonation of chloronitrobenzenes in aqueous solution: kinetics and mechanism. J Chem Technol Biotechnol. 2009;84(2):167–175. doi: 10.1002/jctb.2015. [DOI] [Google Scholar]
- 22.Li Q, Minami M, Inagaki H. Acute and subchronic immunotoxicity of p-chloronitrobenzene in mice. I. Effect of natural killer, cytotoxic T-lymphocyte activities and mitogen-stimulated lymphocyte proliferation. Toxicology. 1998;127(1-3):223–232. doi: 10.1016/S0300-483X(98)00027-4. [DOI] [PubMed] [Google Scholar]
- 23.Li Q, Minami M, Hanaoka T, Yamamura Y. Acute immunotoxicity of p-chloronitrobenzene in mice: II. Effect of p-chloronitrobenzene on the immunophenotype of murine splenocytes determined by flow cytometry. Toxicology. 1999;137(1):35–45. doi: 10.1016/S0300-483X(99)00065-7. [DOI] [PubMed] [Google Scholar]
- 24.Liang C. Production situation and market analysis of nitrochlorobenzene. Techno-Economics in Petrochemicals. 2007;23(2):23–26. (in Chinese) [Google Scholar]
- 25.Lin SH, Wang CH. Ozonation of phenolic wastewater in a gas-induced reactor with a fixed granular activated carbon bed. Ind Eng Chem Res. 2003;42(8):1648–1653. doi: 10.1021/ie020545x. [DOI] [Google Scholar]
- 26.Liu Y. Citing Electronic Source of Information, China. 2009. Available from http://www.ccin.com.cn/front/home/templet/default/ShowArticle.jsp?id=75662. [accessed on Sept. 12, 2009]
- 27.Lucas MS, Peres JA, Lan BY, Puma GL. Ozonation kinetics of winery wastewater in a pilot-scale bubble column reactor. Water Res. 2009;43(6):1523–1532. doi: 10.1016/j.watres.2008.12.036. [DOI] [PubMed] [Google Scholar]
- 28.Martínez NSS, Fernández JF, Segura XF, Ferrer AS. Pre-oxidation of an extremely polluted industrial wastewater by the Fenton’s regent. J Hazard Mater. 2003;101(3):315–322. doi: 10.1016/S0304-3894(03)00207-3. [DOI] [PubMed] [Google Scholar]
- 29.Melero JA, Martínez F, Botas JA, Molina R, Pariente MI. Heterogeneous catalytic wet peroxide oxidation systems for the treatment of an industrial pharmaceutical wastewater. Water Res. 2009;43(16):4010–4018. doi: 10.1016/j.watres.2009.04.012. [DOI] [PubMed] [Google Scholar]
- 30.Minero C, Pelizzetti E, Piccinini P, Vincenti M. Photocatalyzed transformation of nitrobenzene on TiO2 and ZnO. Chemosphere. 1994;28(6):1229–1244. doi: 10.1016/0045-6535(94)90340-9. [DOI] [Google Scholar]
- 31.Nair RS, Johannsen FR, Levinskas GJ, Terrill JB. Subchronic inhalation toxicity of p-nitroaniline and p-nitrochlorobenzene in rats. Fund Appl Toxicol. 1986;6(4):618–627. doi: 10.1016/0272-0590(86)90174-0. [DOI] [PubMed] [Google Scholar]
- 32.Nair RS, Johannsen FR, Levinskas GJ, Terrill JB. Assessment of toxicity of o-nitrochlorobenzene in rats following a 4-week inhalation exposure. Fund Appl Toxicol. 1986;7(4):609–614. doi: 10.1016/0272-0590(86)90110-7. [DOI] [PubMed] [Google Scholar]
- 33.Rice RG. Application of ozone for industrial wastewater treatment-a review. Ozone-Sci Eng. 1997;18(6):477–515. [Google Scholar]
- 34.Sarasa J, Cortés S, Ormad P, Gracia R, Ovelleiro JL. Study of the aromatic by-products formed from ozonation of anilines in aqueous solution. Water Res. 2002;36(12):3035–3044. doi: 10.1016/S0043-1354(02)00003-9. [DOI] [PubMed] [Google Scholar]
- 35.Sarria V, Parra S, Adler N, Peringer P, Benitez N, Pulgarin C. Recent developments in the coupling of photoassisted and aerobic biological processes for the treatment of biorecalcitrant compounds. Catal Today. 2002;76(2-4):301–315. doi: 10.1016/S0920-5861(02)00228-6. [DOI] [Google Scholar]
- 36.Selçuk H, Eremektar G, Meriç S. The effect of pre-ozone oxidation on acute toxicity and inert soluble COD fractions of a textile finishing industry wastewater. J Hazard Mater. 2006;137(1):254–260. doi: 10.1016/j.jhazmat.2006.01.055. [DOI] [PubMed] [Google Scholar]
- 37.Siuda JF, DeBernardis JF. Naturally occurring halogenated organic compounds. Lloydia. 1973;36(2):107–143. [PubMed] [Google Scholar]
- 38.Sreethawong T, Chavadej S. Color removal of distillery wastewater by ozonation in the absence and presence of immobilized iron oxide catalyst. J Hazard Mater. 2008;155(3):486–493. doi: 10.1016/j.jhazmat.2007.11.091. [DOI] [PubMed] [Google Scholar]
- 39.Tanaka K, Luesaiwong W, Hisanaga T. Photocatalytic degradation of mono-, di- and trinitrophenol in aqueous TiO2 suspension. J Mol Catal A-Chem. 1997;122(1):67–74. doi: 10.1016/S1381-1169(96)00509-2. [DOI] [Google Scholar]
- 40.Tomei MC, Annesini MC, Bussoletti S. 4-nitrophenol biodegradation in a sequencing batch reactor: kinetic study and effect of filling time. Water Res. 2004;38(2):375–384. doi: 10.1016/j.watres.2003.09.023. [DOI] [PubMed] [Google Scholar]
- 41.Travlos GS, Mahler J, Ragan HA, Chou BJ, Bucher JR. Thirteen-week inhalation toxicity of 2- and 4-chloronitrobenzene in F344/N rats and B6C3F1 mice. Fund Appl Toxicol. 1996;30(1):75–92. doi: 10.1006/faat.1996.0045. [DOI] [PubMed] [Google Scholar]
- 42.Volskay VTJr, Grady CPLJr. Respiration inhibition kinetic analysis. Water Res. 1990;24(7):863–874. doi: 10.1016/0043-1354(90)90136-T. [DOI] [Google Scholar]
- 43.Wei F, editor. Analysis of Water and Wastewater. Beijing, China: Chinese Environmental Science Press; 2002. [Google Scholar]
- 44.Wert EC, Rosario-Ortiz FL, Drury DD, Snyder SA. Formation of oxidation byproducts from ozonation of wastewater. Water Res. 2007;41(7):1481–1490. doi: 10.1016/j.watres.2007.01.020. [DOI] [PubMed] [Google Scholar]
- 45.Winarno EK, Getoff N. Comparative studies on the degradation of aqueous 2-chloroaninline by O3 as well as by UV-light and γ-rays in the presence of ozone. Radiat Phys Chem. 2002;65(4-5):387–395. doi: 10.1016/S0969-806X(02)00339-0. [DOI] [Google Scholar]
- 46.Zeng YF, Liu ZL, Qin ZZ. Decolorization of molasses fermentation wastewater by SnO2-catalyzed ozonation. J Hazard Mater. 2009;162(2-3):682–687. doi: 10.1016/j.jhazmat.2008.05.094. [DOI] [PubMed] [Google Scholar]


