

Abstract
We demonstrate a purely electrical method for single-molecule detection of specific DNA sequences, achieved by hybridizing double-stranded DNA (dsDNA) with peptide nucleic acid (PNA) probes and electrophoretically threading the DNA through sub-5 nm silicon nitride pores. Bis-PNAs were used as the tagging probes, in order to achieve high affinity and sequence-specificity. Sequence detection is performed by reading the ion current traces of individual translocating DNA molecules, which display a characteristic secondary blockade level, absent in untagged molecules. The potential for barcoding DNA is demonstrated through nanopore analysis of once-tagged and twice-tagged DNA at different locations on the same genomic fragment. Our high-throughput, long-read length method can be used to identify key sequences embedded in individual DNA molecules, without the need for amplification or fluorescent/radio labeling. This opens up a wide range of possibilities in human genomics, as well as in pathogen detection for fighting infectious diseases.
Keywords: PNA, invasion, sequence detection, nanopore, DNA
Numerous techniques in life sciences, biotechnology, medicine, and forensics are based on nucleic acid hybridization. The invention of nucleic acid analogs with improved hybridization affinity, hybridization rate, and/or mismatch discrimination as compared to natural nucleic acids, has significantly extended the diagnostic utilities of these applications. Peptide nucleic acids (PNAs), a prominent class of artificial nucleic acid analogs, are neutral, oligomers with peptide-like backbone onto which nucleobases are grafted in a designed sequence. Moreover, bis-PNA molecules, consisting of two PNA oligomers connected by a flexible linker, spontaneously invade double-stranded DNA (dsDNA) molecules, binding to one of the two dsDNA strands with high affinity and sequence-specificity, owing to the simultaneous formation of Watson-Crick and Hoogsteen base-pairs1-3. This high affinity and sequence-specificity makes bis-PNA, and other synthetic variants (e.g., pseudocomplementary PNA2, 4 and γ-PNA5, 6) extremely promising sequence-tagging candidates for analysis of individual dsDNA fragments. Single-molecule mapping methods, which detect and localize PNA/DNA hybridization on minute quantities of dsDNA can lead to cheaper and faster pathogen and mutation diagnostics platforms. Low-cost and high speed platforms are essential for effective response to emerging threats of infection and will ultimately result in more accurate treatment, as well as an overall decrease in morbidity and mortality. While a microfluidic approach for DNA-mapping, based on fluorescent detection of tagged PNAs has already been developed7, these assays require sophisticated and expensive instrumentation, and mapping is usually diffraction-limited in resolution.
Using nanopores as single-molecule sensors8, 9, in this paper we demonstrate the first purely electrical detection of individual PNA-tagged dsDNA molecules. Our nanopore-based detection method proceeds with high-throughput (>1 molecule/second at sub-nM DNA concentrations), enabling identification of specific dsDNA sequences using bis-PNA probes. While synthetic pores have been recently used for analyzing individual dsDNA molecules10-12, as well as for the detecting small-molecule binding to DNA13, here we achieve specific DNA sequence identification by detecting a PNA-tagged genomic fragment as it threads through the pore.
Our detector is a solitary nanopore fabricated in a free-standing silicon nitride (SiN) membrane using a focused electron beam14 (see Figure 1a). Pore sizes in the diameter range 4-5 nm are attractive, because they guarantee unfolded DNA entry and slower DNA transport than larger pores12. The chip is assembled between two miniature fluid chambers (‘cis’ and ‘trans’), and hydrated using a buffered 1M KCl solution using protocols which have been previously described12, 15. When a positive bias is applied across the SiN membrane using a pair of Ag/AgCl electrodes, negatively-charged DNA molecules are captured and linearly threaded through the nanopore from the cis to trans chambers. During the threading process, the ion current is transiently reduced to a value which reflects, to a first approximation, the displacement of electrolytes from the nanopore by the DNA segment in the pore12.
Figure 1.

Solid-state nanopore detection of PNA-tagged DNA. (a) Schematic illustration (not to scale). Our 5 mm Si chip contains a 30-nm-thick free standing silicon nitride membrane, in which a 4.5 nm pore has been drilled using a TEM. The illustration depicts a dsDNA molecule with two bis-PNA probes threaded through a nanopore, under a voltage bias. Inset: a high-resolution TEM image of a 4 nm pore. (b) Schematics of two 3,500 bp dsDNA fragments used in this study: F1 (control) has no binding sites for the bis-PNAs, F2 contains two binding sites separated by 855 bp. (c) Sequences of target sites and bis-PNA probes. (d) Gel-shift analysis of the DNA-PNA complexes, as indicated (M is a dsDNA marker).
To show that nanopores can discriminate among PNA-bound and PNA-free DNA samples, we have prepared two DNA fragments (PCR-amplified from the λ-phage genome) of nearly equal lengths (3,500 bp, see Figure 1b). The λ-phage region was chosen such that the first fragment (F1) does not include target sequences for either of the two bis-PNA probes (P1 and P2). The second sample (F2) contains two different binding sites for our bis-PNA probes (see sequences in Figure 1c), spaced 855 bp apart. Binding of our probes to F2 was verified by electrophoretic mobility shift assays (Figure 1d). The appearance of several shifted bands at binding of P1 or P2 to the cognate DNA target is due to the formation of distinct structural isomers16. As seen from the Figure, the shifts are larger when both probes are bound (Lane 4). No gel shift was observed upon incubation of F1 with both probes (not shown) highlighting the binding specificity of the both PNA tags to only F2 and not to F1.
Figure 2 summarizes the results of four separate experiments, which illustrate the feasibility of PNA/DNA complex detection using nanopores. At least five typical DNA translocation events are shown on the left for each experiment, and cumulative all-point current histograms for a large population (>500 events) of events are shown on the right. In Figure 2a, two controls are shown: The 3.5 kbp DNA fragment F2 (top), and the F1 fragment after incubation with PNA probes P1 and P2 at equal mole ratios (bottom). The ion-current traces of both samples are practically identical, exhibiting a characteristic single blockade level with mean amplitude ΔI = 1.05±0.08 nA (see current histograms in Figure 2), as expected for free dsDNA12. F1P1P2 serves as a negative control by demonstrating that non-specific binding of PNA does not alter the nanopore's ion current signal. In contrast, as shown in Figure 2b, traces for the F2P1 (F2 hybridized solely with P1) and F2P1P2 samples display distinct current blockade signatures, with deeper blockades than those witnessed with the untagged dsDNA appearing at ΔI = 1.45±0.08 nA. Nanopore measurements of the F2P1 fragments typically display a single additional blockade pulse with amplitude ΔI = 1.45±0.12 nA, while F2P1P2 displayed two such blockades for one DNA molecule, marked by red arrows on the current histograms. These additional pulses in the experimental sample are ∼40-fold greater than the characteristic RMS noise in our signal (∼0.01 nA), and therefore are attributed to the signal induced from passage of the bis-PNA/DNA complex through the pore.
Figure 2.
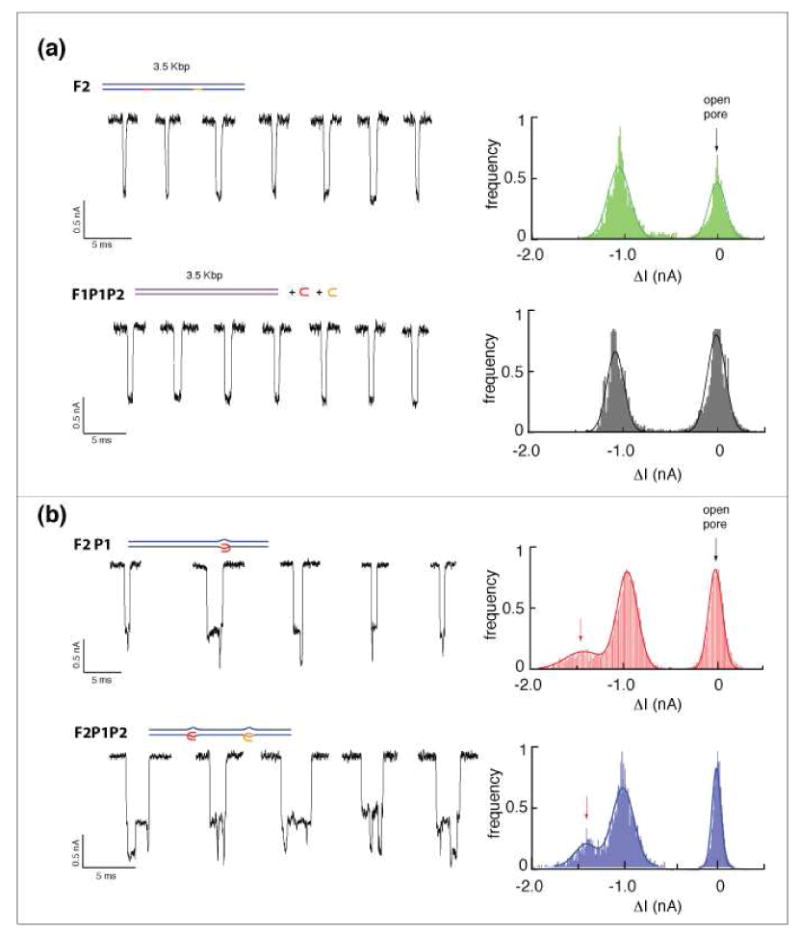
Representative ion current traces of F1 and F2 translocation through a ∼4.5 nm pore (low-pass filtered for better presentation). (a) Control measurements, using the lone F2 and F1 hybridized with both P1 and P2, are nearly identical showing a single blocked level with δI ≈ 1 nA. (b) Signals from F2 molecules hybridized with either one or both of the PNA probes display two distinct current levels, with δI ≈ 1 nA and 1.4 nA, Signals were digitally filtered at 20 kHz for display purpose.
We further checked whether the characteristic ion current blockades due to the PNA/DNA complexes are independent of each other. For this purpose we analyzed the dwell-time and magnitude of the ion-current blockades induced by the PNA probes, of a large population of events (at least 1,000), in the samples including a single PNA site and the one with two PNA sites. A custom threshold-crossing algorithm (LabVIEW, National Instruments) was used to analyze the PNA/DNA dwell-times (tPNA) and current amplitudes (ΔIPNA), as shown in Figure 3a. In Figure 3b and 3c we display our analyses for the once tagged DNA and twice tagged DNA samples, F2P1 and F2P1P2, respectively. We find that in the case of the single tagging regime, the current amplitudes distribution can be well fitted by single Gaussian function, yielding ΔIPNA_1 = 0.42±0.08 (mean and standard deviation, left-hand panel of Figure 3b). In the case of the twice tagged molecule, we find that each of the two current amplitudes, induced by the PNA, can be well fitted with a single Gaussian, with ΔIPNA_1 = 0.46±0.12 and ΔIPNA_2 = 0.46±0.13 (see fits in left hand panel of Figure 3c), in excellent agreement with the current amplitudes measured for F2P1.
Figure 3.

a) Schematic of key characteristics of a F2P1P2 translocation event. Gathering ∼1000 events enables statistically detailed analysis of the mean duration and blockade level of the PNA. Results for both F2P1 (b) and F2P1P2 (c) were nearly identical. Mean blockades for both PNA tags, regardless of number along the DNA, was consistent as ∼0.45 nA and the stalling time of the PNA inside the pore was likewise consistent at ∼200 μs.
Furthermore, as shown in the right panels of Figures 3b and 3c, we find that the dwell time distribution for the passage of the PNA/DNA complexes exhibit similar distributions regardless if they were measured in the F2P1 or F2P1P2 samples. In both cases, the distributions yield a peak at ∼50 μs followed by an exponential decay with a characteristic timescale of 185±14 μs or 164±9 μs for F2P1 or F2P1P2 samples respectively, extracted by tail-fitting the distributions (solid lines). Taken together, these findings suggest that a spacing of ∼850 bp (∼300 nm) between the two PNA tags is sufficient for achieving independent signals from two neighboring PNA probes.
We have previously characterized the translocation time of dsDNA through sub-5 nm solid state pores12. In accordance with Figure 3 we find that, on average, the mean translocation time of the 8-base PNA/DNA complex (∼20 μs/bp) is ∼200-fold greater than a similar length of free DNA (0.1 μs/bp). Stalling at the DNA/PNA complex site may result from a combination of two factors: a) increased interactions of the bulky, less-charged complex with the pore13, and b) formation of kinks along the DNA molecule at the PNA binding site, as observed by electron microscopy and atomic force microscopy17. Regardless of the exact stalling mechanism, this process serendipitously improves the fidelity of detecting a DNA/PNA complex in a long DNA fragment, particularly important for minimizing errors associated with multiple tag readout.
In summary, we have presented a novel single-molecule method for identification of sequences embedded within dsDNA, without the need for fluorescent/radio labeling. We have shown, through both singular and multiple specific tags, that discrimination between untagged and PNA-tagged molecules is feasible, simply by identifying the secondary blockades of the ion current evident during a translocation event. The well-studied sequence specificity and high affinity of bis-PNA molecules, combined with the sensitivity of the nanopore sensors are expected to enable accurate genotyping at the single-molecule level. While further studies are needed to determine the ultimate spatial resolution of this technique, and reveal the detailed PNA/DNA translocation mechanism, our findings are already of foreseeable use, as extremely long dsDNA molecule have shown to be efficiently captured and analyzed using sub-5 nm solid-state pores18. As our method simply entails counting the number of bound PNA tags per DNA molecule, and does not require elaborated analysis of the translocation dynamics, our findings that PNA probes yield uniform current amplitude and long dwell-times (Figure 3) highly facilitate an automated computer-based counting of each PNA probe. Although bis-PNAs pose certain sequence limitations on their binding sites (the binding site must consists of purines in one strand and pyrimidines in the other), these limitations are relatively mild since the binding sites can be as short as 7 nucleotides19. As a result, bis-PNAs have already found applications in several diagnostics based on fluorescence detection7, 20, 21. We envision that this method can be straightforwardly adapted to additional PNA variants, such as γ-PNA, which hold the potential to reduce these sequence restrictions5, 6, 22. In conclusion, our electrical method for rapid identification of key sequences without the need for amplification, photo/radio labels, or thermocycle processes, opens up a broad range of possibilities in the fields of human genomics and pathogen detection, relevant for combating infectious disease and bioterrorism.
Methods
Nanopore fabrication and data acquisition
Nanopores with diameters of 4.5±0.5 nm were fabricated in 30 nm thick, low-stress SiN windows (8 μm × 8 μm) supported by a 5×5 mm Si chip12. A JEOL 2010F TEM was used to fabricate and thereafter image the nanopores, as previously described19. Nanopore chips were cleaned and assembled on a custom-designed cell under controlled temperature and humidity. Following the addition of degassed and filtered 1 M KCl electrolyte solution (buffered with 10 mM Tris-HCl to pH 7.5), the nanopore cell was placed in a custom-designed chamber and maintained at 21 ± 0.1°C. Ag/AgCl electrodes were immersed into each chamber of the cell and connected to an Axon 200B headstage, where all measurements were taken inside a dark Faraday cage. The Axon signal was low-pass filtered using an analog 50 kHz Butterworth filter, and sampled at 250 kHz using a 16-bit DAQ card. In all cases, the DNA was introduced to the cis chamber, and a positive voltage of 300 mV was applied to the trans chamber15.
Data acquisition involved an automated routine for detecting and saving single-molecule translocation events (∼1000 events), where translocations are defined by two conditions in our data collection software: First, the nanopore current must be reduced from its open level to less than 80% of its open pore level (the expected level for dsDNA and the pore diameter used). Second, the total event duration (dwell-time) must be longer than 50 μs. Samples hybridized with PNA which exhibited secondary peaks in the ion current, which were analyzed to extract the dwell times and the additional ion current amplitudes. In all cases the PNA complex dwell-times were determined by the mid-point of the transition between the two respective levels (δIDNA − δIPNA) as shown in Figure 3a. Curve fits were performed using Levenberg-Marquardt nonlinear least squares minimization in Igor Pro (WaveMetrics, Inc.), also used to evaluate the errors.
Sample Preparation
Oligonucleotides were purchased from Integrated DNA Technologies (Coralville, IA). DNA concentrations were determined using a NanoDrop ND-1000 spectrophotometer. Lambda DNA was obtained from New England BioLabs (Ipswich, MA). PNAs were a gift from Dr. Peter E. Nielsen (Copenhagen, Denmark). PCR Reactions were performed in 1× Pfu buffer (Stratagene) containing 0.1 ng/μl lambda DNA, 400 μM of each dNTP, 0.5 μM each of a corresponding primer pair, and 0.025 units/μl of Pfu DNA polymerase. Amplification was carried out with an initial denaturation step at 93°C for 180 s, followed by 33 cycles of denaturation at 93°C for 30 s, primer annealing at 56°C for 45 s, and extension at 72°C for 10 min. PCR amplicons were purified by QIAQuick PCR purification kit (Qiagen).
Primer pairs for fragments F1 (3518 bp) and F2 (3506 bp) were as follows (numbers denote the locations on lambda phage genome):
F1-F (14591-14611): 5′-CTG GAT AAT CTG GAG GCG ACG
F1-R (18086-18108): 5′-CTC AAT TTT GAC AGC CCA CAT GG
F2-F (5957-5976): 5′-ACC ACG CTG ACG TTC TAC AA
F2-R (9445-9462): 5′-TGG CAG GCG TCA CGG TCA
PNA/DNA complex formation
PCR amplicons (∼ 2 pmoles) were incubated with the corresponding PNAs (1.5 μM) for 3 h at 42°C in 75 μl buffer containing 10 mM Na-phosphate (pH 6.8 at 25°C) and 0.05 mM EDTA. The following PNAs were used:
PNA-1 (located 1322 bp from 5′ end of F2): H-Lys2-JTTTJTTJ-(eg1) 3-CTTCTTTC-Lys-NH2
PNA-2 (located 1313 bp from 3′ end of F2): H-Lys2-TTJJTTTJ-(eg1) 3-CTTTCCTT-Lys-NH2
Subsequent to PNA incubation, samples were precipitated by the addition of sodium chloride (0.2 M) and two volumes of ethanol, and suspended in 20 μl buffer containing 10 mM Tris-HCl (pH 7.4) and 0.1 mM EDTA Surplus PNAs were removed by gel filtration (Sephadex G-50). PCR amplicons were analyzed using 1 % agarose gels. Sample aliquots of PNA/DNA complexes were analyzed on 5 % polyacrylamide gels (29:0.5 w/w acrylamide: N,N'-methylene-bis-acrylamide), which were run for 5-7 h at 20 mA (ambient temperature) in 1× TBE buffer (90 mM Tris-borate, 2 mM EDTA, pH 8.0). Gels were stained with ethidium bromide, illuminated at 302 nm, and scanned with a CCD camera.
Acknowledgments
A.M. acknowledges support from NIH award HG-004128 and NSF award PHY-0646637.
References
- 1.Egholm M, Christensen L, Dueholm KL, Buchardt O, Coull J, Nielsen PE. Nuc Acid Res. 1995;23(2):217–222. doi: 10.1093/nar/23.2.217. [DOI] [PMC free article] [PubMed] [Google Scholar]
- 2.Demidov VV, Frank-Kamenetskii MD. Tren Biochem Sci. 2004;29(2):62–71. doi: 10.1016/j.tibs.2003.12.007. [DOI] [PubMed] [Google Scholar]
- 3.Kuhn H, Demidov VV, Frank-Kamenetskii MD, Nielsen PE. Nuc Acid Res. 1998;26(2):582–587. doi: 10.1093/nar/26.2.582. [DOI] [PMC free article] [PubMed] [Google Scholar]
- 4.Lohse J, Dahl O, Nielsen PE. Proc Natl Acad Sci USA. 1999;96(21):11804–11808. doi: 10.1073/pnas.96.21.11804. [DOI] [PMC free article] [PubMed] [Google Scholar]
- 5.Rapireddy S, He G, Roy S, Armitage BA, Ly DH. J Am Chem Soc. 2007;129(50):15596–15600. doi: 10.1021/ja074886j. [DOI] [PubMed] [Google Scholar]
- 6.He G, Rapireddy S, Bahal R, Sahu B, Ly DH. J Am Chem Soc. 2009;131(34):12088–90. doi: 10.1021/ja900228j. [DOI] [PMC free article] [PubMed] [Google Scholar]
- 7.Phillips KM, Larson JW, Yantz GR, D'Antoni CM, Gallo MV, Gillis KA, Goncalves NM, Neely LA, Gullans SR, Gilmanshin R. Nucl Acid Res. 2005;33(18):5829–5837. doi: 10.1093/nar/gki895. [DOI] [PMC free article] [PubMed] [Google Scholar]
- 8.Bayley H, Braha O, Gu LQ. Adv Mater. 2000;12(2):139–142. [Google Scholar]
- 9.Deamer DW, Branton D. Acc Chem Res. 2002;35(10):817–825. doi: 10.1021/ar000138m. [DOI] [PubMed] [Google Scholar]
- 10.Li JL, Gershow M, Stein D, Brandin E, Golovchenko JA. Nat Mate. 2003;2(9):611–615. doi: 10.1038/nmat965. [DOI] [PubMed] [Google Scholar]
- 11.Storm AJ, Storm C, Chen JH, Zandbergen H, Joanny JF, Dekker C. Nano Lett. 2005;5(7):1193–1197. doi: 10.1021/nl048030d. [DOI] [PubMed] [Google Scholar]
- 12.Wanunu M, Sutin J, McNally B, Chow A, Meller A. Biophys J. 2008;95(10):4716–4725. doi: 10.1529/biophysj.108.140475. [DOI] [PMC free article] [PubMed] [Google Scholar]
- 13.Wanunu M, Sutin J, Meller A. Nano Letters. 2009;9(10):3498–3502. doi: 10.1021/nl901691v. [DOI] [PMC free article] [PubMed] [Google Scholar]
- 14.Kim MJ, Wanunu M, Bell DC, Meller A. Adv Mater. 2006;18(23):3149–3153. [Google Scholar]
- 15.Wanunu M, Meller A. In: Single Molecule Analysis of Nucleic Acids and DNA-protein Interactions using Nanopores. Selvin P, Ha T, editors. Cold Spring Harbor Press; Spring Harbor, NY: 2008. [Google Scholar]
- 16.Hansen GI, Bentin T, Larsen HJ, Nielsen PE. J Mol Biol. 2001;307(1):67–74. doi: 10.1006/jmbi.2000.4487. [DOI] [PubMed] [Google Scholar]
- 17.Cherny DI, Fourcade A, Svinarchuk F, Nielsen PE, Malvy C, Delain E. Biophys J. 1998;74(2):1015–1023. doi: 10.1016/S0006-3495(98)74026-3. [DOI] [PMC free article] [PubMed] [Google Scholar]
- 18.Wanunu M, Morison W, Rabin Y, Grosberg AY, Meller A. Nat Nanotechnol. 2009 doi: 10.1038/nnano.2009.379. (EPAP 20/12/2009) [DOI] [PMC free article] [PubMed] [Google Scholar]
- 19.Bukanov NO, Demidov VV, Nielsen PE, Frank-Kamenetskii MD. Proc Nat Acad Sci USA. 1998;95(10):5516–5520. doi: 10.1073/pnas.95.10.5516. [DOI] [PMC free article] [PubMed] [Google Scholar]
- 20.Smolina IV, Lee C, Frank-Kamenetskii MD. Appl Enviro Microb. 2007;73(7):2324–2328. doi: 10.1128/AEM.02038-06. [DOI] [PMC free article] [PubMed] [Google Scholar]
- 21.Smolina IV, Kuhn H, Lee C, Frank-Kamenetskii MD. Bioorgan Med Chem. 2008;16(1):84–93. doi: 10.1016/j.bmc.2007.04.063. [DOI] [PubMed] [Google Scholar]
- 22.Zhang X, Ishihara T, Corey DR. Nuc Acids Res. 2000;28(17):3332–3338. doi: 10.1093/nar/28.17.3332. [DOI] [PMC free article] [PubMed] [Google Scholar]