Abstract
The reaction of nitric oxide (NO) with the ferric (met) nitrite derivative of human adult hemoglobin Hb is probed for both solution phase and sol-gel encapsulated populations. The evolution of both the Q band absorption spectrum and fitted populations of Hb derivatives are used to show the sequence of events occurring when NO interacts with nitrite bound to a ferric heme in Hb. The sol-gel is used to compare the evolving populations as a function of quaternary state for the starting met nitrite populations. The redox status of intermediates is probed using the CN− anion to trap ferric heme species. The emergent presence of reactive NO species such as N2O3 during the course of the reaction is probed using the fluorescent probe DAF-2 whereas the fluorophore Chemi-fluor is used as an indirect measure of the ability of the reaction to create S-nitrosothiols on glutathione. The results are consistent with the formation of a stable reactive intermediate capable of generating bioactive forms of NO. The patterns observed are consistent with a proposed mechanism whereby NO reacts with the ferric nitrite derivative to generate N2O3.
Keywords: nitric oxide, hemoglobin, nitrite, s-nitrosolation, sol-gel, dinitrogentrioxide
Introduction
Over the past several years there have been growing indications that the functionality of hemoglobin extends beyond oxygen transport and delivery. Most significant is the compelling evidence that Hb can function as a physiologically important vasodilator through mechanisms that generate non-eNOS sources of bioactive NO[1; 2; 3; 4; 5; 6; 7; 8; 9; 10; 11; 12; 13; 14; 15; 16; 17; 18; 19]. This proposed function is relevant not only for Hb within the red blood cell but also for acellular Hb. Vasoactivity on the part of acellular Hb is important both for pathophysiological states that produce red cell hemolysis[1; 2; 3] and for clinical situations where acellular Hb is infused into the circulation as a blood substitute, i.e. hemoglobin-based oxygen carriers or HBOCs[4; 5; 6; 7; 8; 9; 10; 11; 12; 13; 14; 15; 16; 17; 18; 19].
A central question relating to this proposed functionality stems from the ability of ferrous forms of Hb to scavenge NO. Scavenging occurs both from the strong binding of NO to deoxy hemes and from the NO dioxygenation reaction whereby NO reacts with heme-bound dioxygen to produce nitrate. The NO scavenging capabilities of different Hbs are similar, as has been observed in measurements showing that a variety of different HBOCs all deplete perivascular NO to a comparable degree despite some HBOCs being vasoconstrictive and others vasodilatory[20]. The general question that is pertinent both to HBOC behavior as well as to Hb in the RBC is how, in the face of this scavenging process, does Hb generate NO or an NO related species that can cause vasodilation. In the case of the RBC the question also encompasses the issue of how does NO or other bioactive forms of NO potentially generated from Hb, escape from the RBC.
The formation of an NO bearing quasi-stable Hb associated intermediate is the common theme in the various proposed mechanisms that attempt to explain how in the face of NO scavenging Hb can still function as a source for bioactive forms of NO. S-nitrosothiols are a promising vehicle through which the normally reactive NO can be maintained for an extended time period while retaining its capacity to function as a downstream vasodilator[21; 22; 23; 24; 25; 26; 27; 28; 29; 30; 31]. Thus an important biophysical question becomes, what are the Hb-based mechanisms for the formation of such species as S-nitrosocysteine, S-nitrosoglutathione and S-nitrosoHb (SNOHb)-all of which are potential contributors to the overall process. NO by itself is not effective in creating S-nitrosothiols. In contrast to NO, both NO+ and N2O3 are potent nitrosating agents of thiol-containing peptides such as glutathione as well as the intrinsic reactive thiols (Cys 93) on Hb[24; 25]. Ford and coworkers [32; 33]raised the possibility that either inner or outer sphere electron transfer reactions could result in Hb mediated formation of S-nitrosothiols through the production of either NO+ or N2O3. One proposed allosterically responsive mechanism entails a quaternary structure dependent linkage between the redox state of the β chain hemes and the sulfhydryls on the two Cys β93 residues in the presence of NO that results in the transfer of NO from the heme to the sulfhydryl[34; 35; 36; 37; 38]. Recent studies[39; 40] have purported to have identified a possible role for the Fe(+2)-NO+ resonance structure associated with the ferric NO derivative (Fe(+3)-NO) in a possible mechanism for producing a heme-associated form of NO that can nitrosate thiols. An additional proposed avenue through which Hb can produce these nitrosating agents is via nitrite-mediated reactions.
Initial studies [3; 41; 42; 43; 44; 45]raised the prospect that the nitrite reductase (NR) reaction of Hb might be a major pathway for the production of non-eNOS bioactive NO. In this reaction, nitrite reacts with a five coordinate ferrous heme to yield an NO and an aquomet heme. The reaction has been shown to be under allosteric control with R state ferrous five coordinate hemes being much more reactive than those associated with the T state[42; 43; 45; 46]. The lower redox potential of the R state relative to the T state appears to be a significant factor contributing to this difference in reactivity[47]. The NR reaction still leaves us with the same dilemma of how do get from the generated NO to a long lived bioactive form of NO such as an S-nitrosothiol. A possible but still controversial mechanism was proposed in which met heme in the presence of both nitrite and NO can undergo a reaction that ultimately results in ferrous NO-heme but through an intermediate consisting of N2O3 coordinated to the heme[48]. This novel reaction has been referred to as a nitrite anhydrase reaction. Evidence that the met derivative can be a potent participant in the process of generating bioactive NO has emerged from a study (Cabrales and Friedman, in preparation) demonstrating that in the presence of nitrite, the aquomet derivative of PEGylated Hbs is exceptionally effective as a vasodilator. The present study seeks to evaluate this met Hb-based mechanism through a series of kinetic and spectroscopic measurements involving primarily sol-gel encapsulated met Hb exposed to both nitrite and NO. This work builds on an earlier study that utilized a trehalose glass matrix to trap potential intermediates[49].
The use of thin films of sol-gel encapsulated Hb in this study is motivated by two considerations. The first is that the sol-gel permits experiments where low concentrations of reactants such as NO can be maintained in the large volume of buffer bathing the sol-gel encapsulated Hb potentially creating pseudo first order kinetics even at low concentrations of substrate. In this way one can evaluate phenomena at low concentrations of the substrate but still not be limited by a low total number of substrate molecules. Thus one can achieve conditions where there is essentially a constant concentration of substrate despite consumption of substrate by the reaction. In many respects that situation mimics physiological conditions although we utilize nonphysiological concentrations to enhance specific reactions and pathways. The second benefit of using sol-gel encapsulated Hb is that the sol-gel can be used to trap and maintain either the T or R state populations independent of the redox or ligation status of the heme[50; 51; 52; 53; 54; 55; 56; 57; 58; 59; 60]. This technique was used previously to show the T/R difference in the rate of the NR reaction[43].
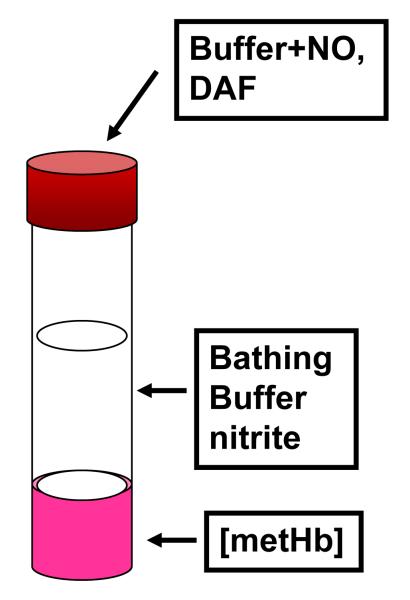
Our approach, shown in Fig. 1, is to first prepare a thin sol-gel layer lining the inside lower third of an optical quality NMR tube that has encapsulated within its interior a population of aquomet Hb. The sample is bathed in an excess of buffer to which substrates and ligands can be easily added through an airtight septum. Additionally the buffer and its contents are easily removed and replaced. The sealed tube can maintain an anaerobic environment for time periods that greatly exceed the duration of any set of measurements.
Figure 1.
Schematic of sol-gel encapsulated Hb samples as a thin layer (~ 1 mm) on the inner wall of an optical quality 10 mm diameter NMR tube.
The present study seeks to address the following: i) confirm that nitrite accelerates the autoreduction of met HbNO and if so establish if there is a discernable intermediate; ii) determine whether NO directly reacts with met Hb-nitrite to form a reactive intermediate; and iii) characterize any spectroscopically detected intermediate with respect to redox status and capacity to generate bioactive forms of NO. This study builds on our earlier study utilizing a rigid trehalose derived glassy matrix to show that whereas NO displaces water and nitrate from a ferric heme, it reacts with ferric heme-bound nitrite to form an intermediate that is consistent with N2O3 coordinated to the heme[49].
Experimental procedures
Materials
Purified HbA was obtained and prepared as previously described[43; 49]. Reagent grade chemicals (TMOS, sodium nitrite, DAF-2, KCN, K3Fe(CN)6) were purchased from Sigma at the highest purity levels available. The thiol reactive dye (Chemfluor) was purchased from Cell Technology, Mountain View CA.
Methods
Uv-vis absorption spectra were recorded on a Lambda 2 (Perkin Elmer, Norwalk, CT); Fluorescence specta were recorded on a QuantaMaster Fluorometer (Photon Technology, Ontario Can.).
Solution samples
Met HbA
Met Hb was prepared from oxy HbA using K3Fe(CN)6, which was subsequently removed using a spin column. The samples were then purged with Ar as were all buffer solutions prior to preparing salt or dye solutions and solutions of NO. All solutions were prepared anaerobically and sealed. NO solutions were prepared by bubbling purified (by passing the gas through a concentrated NaOH solution) NO into Ar purged buffer. A concentration of 2 mM was assumed for the gas saturated solution.
Preparation of the Sol-gel samples
The Sol-gel samples were prepared according to a method previously published[43; 61]. Briefly TMOS is hydrolyzed with acid (2 mM HCl) on ice; purged with N2 gas and mixed in a 1:1 ratio with a solution of the protein in the appropriate buffer. The final concentration of the protein is ~ 0.45 to 0.50 mM in heme. The mixture is spun in an optical quality NMR tube under N2 until gelation, then rinsed with buffer and stored/aged in the cold (4° C). R state gels were prepared initially as the CO derivative of Hb, then photolyzed under incandescent light in the presence of air to form the oxy derivative and then treated with ferricyanide to form the R state aquo/hydroxyl met derivative at pH 7.4. T state gels were prepared from met HbA with the inclusion of a several fold excess of L35 [62; 63; 64; 65; 66; 67]in the buffer with the protein. Immediately upon gelation the buffer was changed to pH 6.0 with L35 (1:1 heme) and stored in the cold. Just prior to probing the reaction initiated with nitrite and NO, the low pH buffer was changed the same pH 7.4 Tris buffer used for the R state measurement. The relaxation time for an encapsulated T state sample to relax to an R state sample is many days longer than the several hours required for the measurement. In the following text, encapsulated met Hb is designated as [met Hb]. The species in the bracket is the derivative that is initially encapsulated prior to any addition of substrate in the bathing buffer.
Reaction Conditions
Reactions of met HbA in solution (0.45 mM in heme) or in the Sol-gel were performed anaerobically in sealed vessels. Nitrite at the same pH as the reaction was added to the met HbA in solution or to the bathing buffer of a Sol-gel. A solution of NO at the same pH was added to initiate the reaction.
Cyanide experiments
The cyanide ion which binds with very high affinity to met HbA was used in this study as a means of trapping all ferric intermediates on the reaction path as the cyano met derivative. This approach is similar to one used by Rifkind and coworkers in which azide was used to trap ferric species[39]. Typically KCN was added to the reaction mixture in solution or in the Sol-gel bathing buffer during the reaction initiated by the addition of NO to a nitrite loaded met Hb sample. The time point at which the KCN is added is determined by the optical spectrum of the evolving sample. In some cases the KCN is added at the point when the spectrum reflects the initial appearance of the “intermediate” and in other cases after the appearance of features indicative of product formation, i.e. ferrous HbNO. The control for these experiments was achieved as follows: KCN was added to [met HbA] bathed in pH 7.4 buffer (c.f. 10 mm KCN) resulting in the preparation of the cyanomet derivative. This sample was then treated in the same manner as the [met HbA] sample that underwent the nitrite/NO reaction (addition of nitrite, 0.1 M, followed by addition of NO (.25 mM). An additional control consisted of adding KCN to a met Hb solution containing 0.1 M nitrite to evaluate whether the levels of added KCN are sufficient to convert the entire ferric sample to the cyanomet derivative under the same conditions used to probe the redox status of the intermediate and final populations.
DAF-2 detection
DAF-2 will react with NO+ and N2O3 to produce a species with dramatically enhanced yield of fluorecence [49; 68]. DAF-2 does not respond to nitrite or NO in the absence of dioxygen. In this study, the dye was used to trace the possible appearance of NO+ and N2O3 during the time course of the nitrite/NO reactions. DAF-2 was added to the bathing buffer (0.05M B-T OAc, pH 7.4) of Sol-gel [met HbA] samples to achieve a concentration of 2.5 μM. An initial DAF-2 emission spectrum was recorded before and after the addition of 0.1 M Na NO2−, and then subsequently after a variable delay following the further addition of 0.25 mM NO solution (all in the same buffer). A second sample was prepared in the same manner without the addition of the dye. The UV-vis absorption spectrum was used to track the evolution of populations for both samples. The sample with dye was also tracked in fluorescence emission. When both samples approached the same point in the reaction (based on the absorption spectrum), the same concentration of dye was then added to the dye-free sample and the fluorescence monitored in time. The fluorescence was measured using a 90° scattering geometry in sol-gel containing NMR tubes but with the tubes inverted to avoid interference from the absorption of the encapsulated Hb. With the tube inverted, the excitation and emission is generated in what is essentially an optically clear solution (there is a weak absorption due to the DAF-2). Control Hb-free samples in similar sealed NMR tubes containing DAF-2 in the presence of nitrite and/or NO were also prepared and monitored. The excitation conditions were as previously reported[49].
Chemfluor
Chemfluor is a fluorescent probe used to monitor free reactive sulfhydryl groups. In this study we use this probe to compare the change in the number of accessible SH groups in a population of glutathione (GSH) subsequent to the addition of L-Cysteine that had been exposed to [met Hb] during the nitrite/NO reaction. The basic concept behind this measurement is that the formation of the reactive S-nitrosothiol derivate of L-Cys during the Hb reaction would then provide a potent nitrosating source for the GSH. A sample of [met HbA] was treated with nitrite (0.1M) and NO (0.25 mM ) as described above; a second control sample was treated with KCN (10 mM) as described above. Then, L-cysteine was added to both samples (5 mM final concentration). At a late point in the nitrite/NO reaction an aliquot was removed from both the reacting sample and the control cyanomet sample and then these aliquots were added to solutions of GSH. The two solutions were then allowed to react with the thiol detecting dye and were compared with respect to the resulting fluorescence intensity from the fluorophore.
Mathematical methods
The absorption spectrum of samples (gel or solution) were repetitively scanned at regular time intervals (30-90 s, longer intervals for the gel samples). Each spectrum was deconvoluted using a basis set consisting of Fe(II)NO, Fe(III)NO2−, aquo and hydroxyl met, Fe(III)NO which were prepared individually. The subtraction of each spectrum of pure component from the unknown sample data yielded a unique spectrum that was not resolved with any of the potential components in the reaction mixture. This unique spectrum was observed in several sets of data. As a result this unique component was used as an intermediate in subsequent fits with better results. The theoretical curves and the difference between the actual sample spectrum and the theoretical fit were greatly improved.
The mathematical expression used for the fitting was a program within Mathcad (version 14.0, PTC Needham MA). The spectral analysis basically consists of a summation of data points that yields a theoretical curve calculated from the input spectra. The theoretical fit is overlayed with the unknown data curve, and the residuals (the difference between the actual data and the fit), were calculated and were 10−3 or less for each data point. The fit required the use of the unique intermediate spectrum to reproduce the sample data and to minimize the residuals.
Results
Nitrite accelerates autoreduction of ferric NOHb
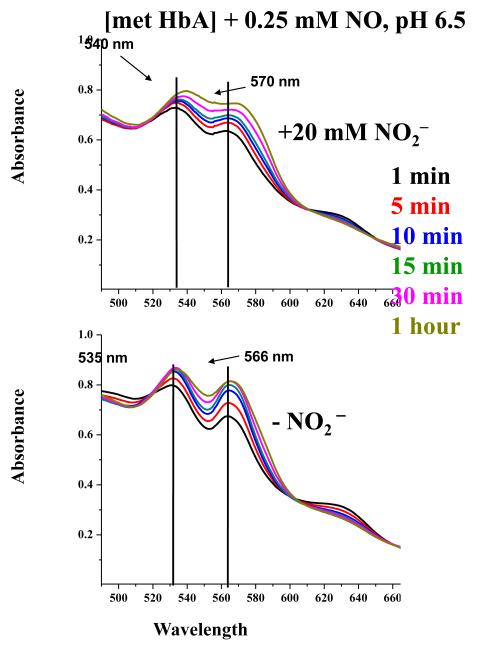
Fig. 2 shows the evolution with time of the absorption spectrum of sol-gel encapsulated samples of metHbA designated as [metHbA] when exposed to an excess of solution containing in one case (Panel A) 0.25 mM NO and 0.20 mM nitrite and in the other case (Panel B) just the 0.25 mM NO. Although the subsequently described measurements were all conducted at pH 7.4, the present results were obtained using a buffer at pH 6.5 in order to enhance the difference between the ± nitrite result. The corresponding result for the pH 7.4 samples (see Figures 1s and 2s in the on line supplementary section) is similar to what is shown but with less of difference in rate or formation of ferrous NO derivative. Both the nitrite and pH enhancement of the autoreduction reaction were described in earlier work[32; 33].
Figure 2.
Time evolution of the Q band absorption spectrum of sol-gel encapsulated met Hb ([met Hb] bathed in pH 6.5 buffer, subsequent to the addition of NO (0.25 mM final concentration) in the presence (top panel) and absence (bottom panel) of nitrite (20 mM final concentration).
It can be seen that both samples originate with prominent peaks at 535 and 565 nm that are characteristic of ferric NOHbA. The sample containing the NO and the nitrite shows a clear time dependent shift of the absorption peaks to higher wavelengths over a time course where the other sample shows little or no evolution. The arrows in the figure show that at the end of an hour period the α and β components of the Q band are at 540 and 570 nm for the Panel A sample and at 535 and 566 nm for the Panel B sample.
Fitting of the spectra requires introducing an intermediate
In trying to fit the sequence of spectra of the kind seen in Panel A of Figure 2 as well as spectra associated with the subsequent measurements, it is found that the best fit requires the addition of an intermediate spectrum that is distinct from the basis set spectra that include aquo met Hb, hydroxy met Hb, ferric NOHb, ferrous NOHb (R and T state forms), and nitrite met Hb. The best fit is typically achieved with the inclusion of a spectrum that is similar to that of the ferrous NOHb species but with the Q band peaks being blue shifted (see Methods). The intermediate spectrum has Q band α and β peaks at ~ 538/539 nm and ~ 569/570 nm respectively. The corresponding equilibrium ferrous NOHbA peaks are at ~ 545 nm and 573/574 nm respectively; whereas, the ferric NOHb species has sharp peaks at 535 nm and 565 nm with a prominent valley between the two Q band peaks. The nitrite met Hb spectrum has two Q band peaks; one at 538 nm and much weaker one at 568 nm. Both aquo met Hb and nitrite met Hb have an additional band at ~ 630 nm. The intermediate spectrum differs from the nitrite met Hb in that the β peak of the Q band is comparable in intensity to the α band and there is no clearly discernable 630 nm peak. The intermediate and its properties will be discussed further in subsequent sections.
Build up of the intermediate precedes the appearance of ferrous NOHb when nitrite is present with NO
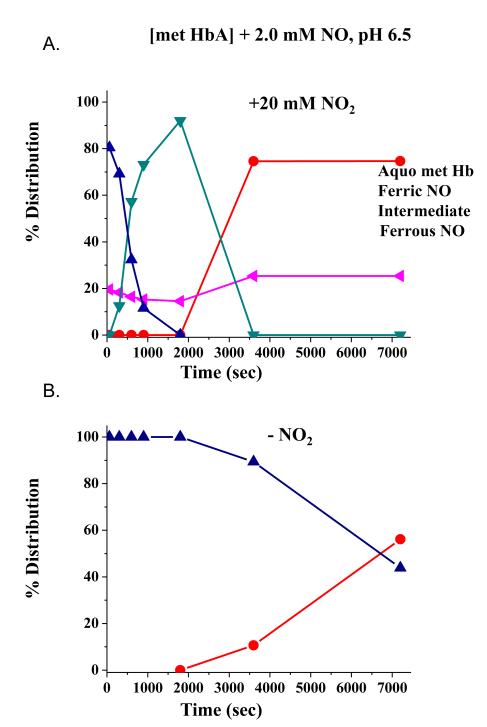
Fig. 3 shows how for [met HbA] bathed in a solution at pH 6.5 containing ~ 2 mM NO, the addition of nitrite drastically alters the evolution of the ferric NOHb population. In the absence of added nitrite (Panel B), the ferric NOHb population slowly autoreduces to directly form ferrous NOHb. In contrast, the addition of 20 mM nitrite with the NO, results in a much faster loss of the ferric NOHb population. In this case, instead of directly evolving into the ferrous NOHb spectrum, the initial population first evolves to form the intermediate which initially builds up and then decays as the ferrous NOHb population builds up.
Figure 3.
Time evolution of populations of Hb derivatives subsequent to the addition of NO (0.25 mM final) to encapsulated met Hb at pH 6.5 in the presence (A) and absence (B) of 20 mM nitrite.
The formation of the intermediate from nitrite metHb
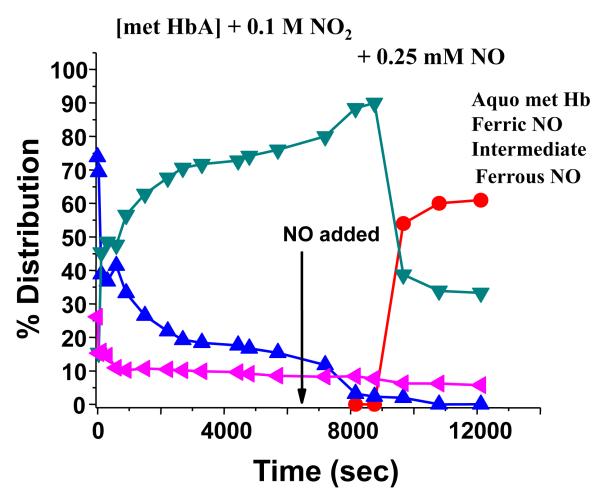
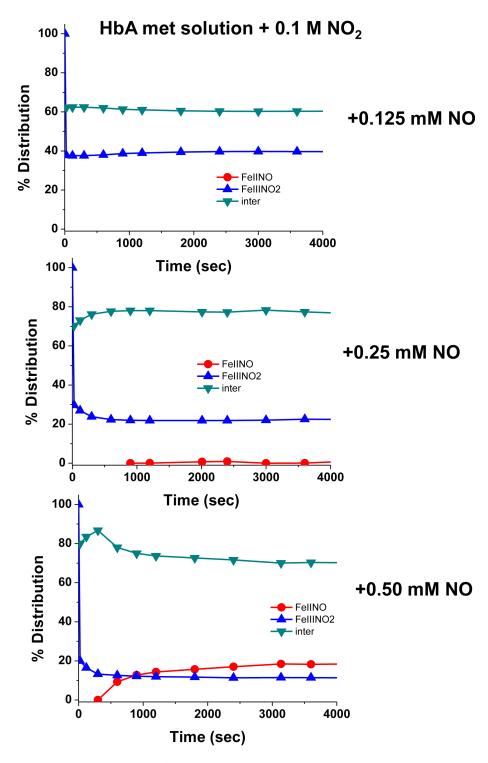
At the concentrations used in the above discussed measurements, the starting sample consists of a mixed population of met Hb derivatives. To directly probe the evolution of the nitrite metHb species at physiological pH, we have chosen to use high nitrite concentration to insure that the starting population in the subsequent experiments is overwhelmingly nitrite metHb. In Fig. 4 is shown the evolution of a [metHbA] sample bathed in buffer at pH 7.4 containing 0.1 M nitrite to which is added 0.25 mM NO at time zero. In the absence of added NO, the met nitrite population is stable for days. The arrow in Fig. 4 indicates the time point at which a second aliquot of NO containing buffer was added. It can be seen that there is an initial very rapid loss of the nitrite metHb population with a concomitant build up of the intermediate. With the addition of a second aliquot of NO, there is again a rapid loss of the remaining nitrite metHb population and a further build up of the intermediate. When the population of the intermediate reaches an amplitude close to 90%, there is then a loss of the intermediate population and a corresponding build up of ferrous NOHb. A similar but not identical pattern is observed for Hbs that have the SH groups on the two Cys β93 residues modified with maleimide reagents (to be presented and discussed in a future manuscript). Fig. 5 shows that similar behavior occurs in solution. It can be seen that with increasing additions of NO to a sample that is initially nitrite metHb, there is first a build up of the intermediate and only when the population attains an excess of intermediate (> 80%) does there appear to be formation of the ferrous NOHb species. This pattern of a build up of intermediate followed by the formation of the ferrous NO population has been seen repeatedly and consistently in numerous sol-gel and solution phase measurements.
Figure 4.
Time evolution of populations subsequent to the addition of NO (time t=0) followed by a second addition noted by the arrow at time ~ 6300 seconds to [met Hb] at pH 7.4 in the presence of 0.1 M nitrite.
Figure 5.
Time evolution of populations subsequent to the addition of NO (time t=0) (final concentrations as noted) to a solution of met Hb in the presence of 0.1 M nitrite at pH 7.4.
Quaternary structure dependence
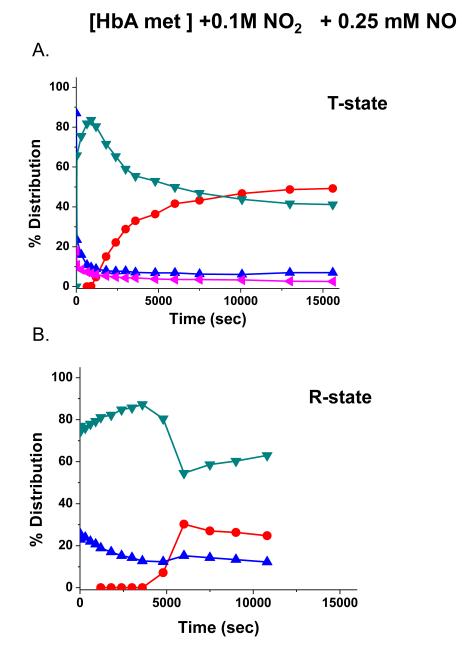
Fig. 6 depicts the difference in the evolution of sol-gel encapsulated met nitrite HbA upon addition of NO for two different sol-gel preparative protocols at the same pH of 7.4. In Panels A and B, the sol-gel protocols were designed to trap the T and R state population of met HbA prior to the addition of either the nitrite and NO (see Methods for details regarding the preparative protocols). It can be seen that in both cases, as described for the above samples, the intermediate first builds up and then decays as the ferrous NO population increases in amplitude. Although both samples follow the same general pattern, there is a clear difference in the kinetics and amplitudes for the different populations. In comparing the T to R state samples it can be seen that the build up of ferrous NO occurs earlier. The net effect is that the population of the intermediate is more persistent for the R state. Preliminary results on high oxygen affinity PEGylated Hbs that are being evaluated as potential blood substitutes (HBOCs) show similar R state behavior.
Figure 6.
Time evolution of populations subsequent to the addition of .25 mM NO (time t=0) to [met Hb] at pH 7.4 in the presence of .1 M nitrite for T and R state [met Hb] samples.
Properties of the intermediate population: redox state of the heme iron
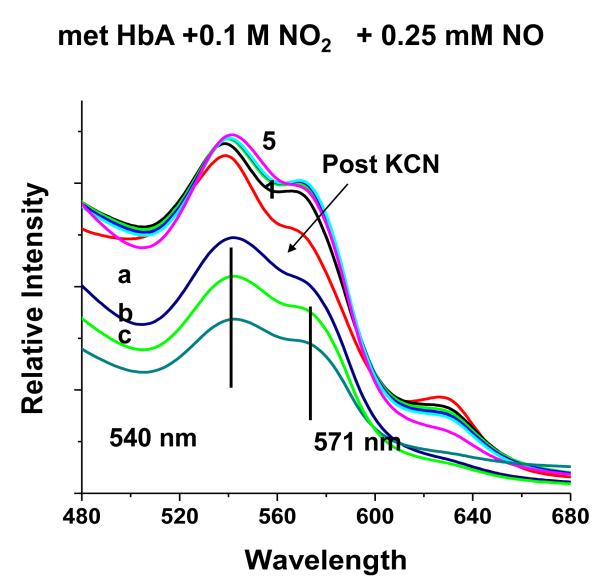
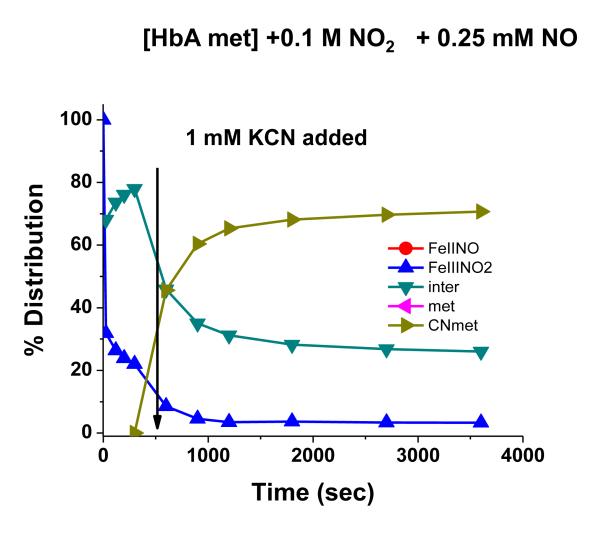
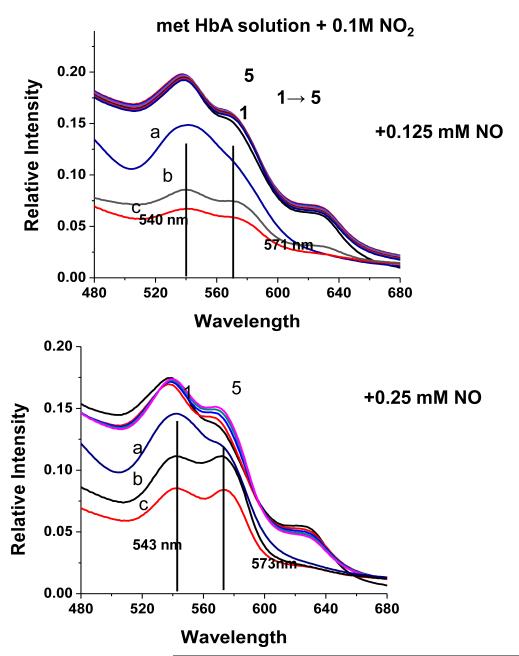
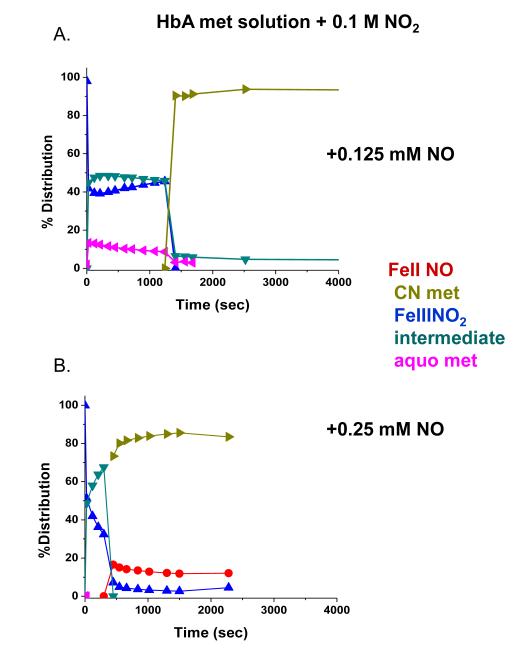
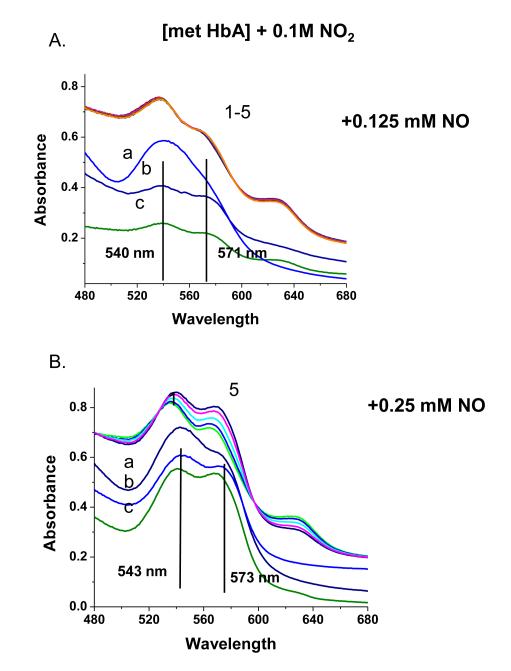
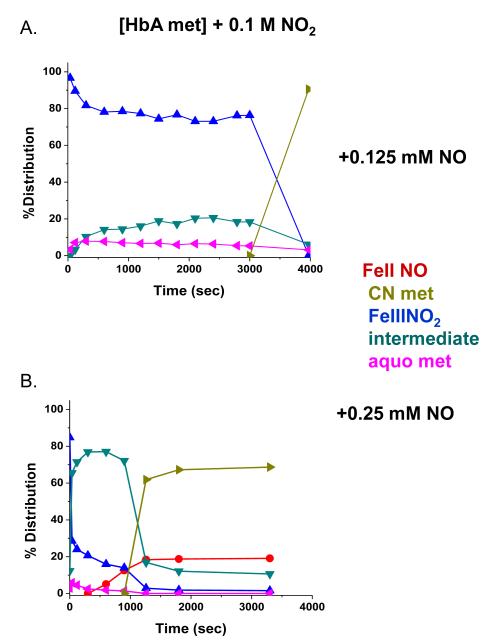
The addition of NO to the met Hb-nitrite samples initiates a progression of changes in the Q band absorption. The initial changes include the loss of the 630 nm peak and an increase in the intensity of the β peak of the Q band relative to the α peak. There is also a slight red shift in the wavelengths of the α and β Q band peaks. The question arises as to when during the evolution from the ferric heme associated with the met-nitrite population to the ferrous heme associated with the ferrous NO product does the heme undergo the ferric to ferrous heme transition. The initial spectrum of the intermediate is suggestive of a ferrous like species but is clearly not at the wavelengths for the final ferrous-NO product. To evaluate the redox state of the intermediate at various time points during the ferric to ferrous evolution, we add KCN to the evolving sample and monitor the resulting spectra. The CN anion, a very strong ligand for the ferric heme, will displace any of the anticipated ferric ligands participating in this reaction and form met HbCN. If an excess of CN is present, the added CN will convert all the ferric hemes to the CN derivative and any remaining population that is not met HbCN can be assigned as a ferrous species. In Fig. 7, the spectra labeled from 1 to 5 represent the changes taking place starting with the met Hb-nitrite population and following the changes occurring over approximately the first 20 minutes after NO (.25 mM) is added to the population of met Hb-nitrite. At approximately 20 minutes, KCN is added to the solution (1 mM in CN). Spectrum a is the stable resulting composite spectrum of solution after the addition of the CN. Spectrum b is the composite stable spectrum minus the spectrum of met HbCN and spectrum c is the composite spectrum just prior to the addition of CN minus the spectrum of met Hb-nitrite. The same experiment but without any added NO, results in the complete conversion of the initial met nitrite population into a cyanomet population. Fig. 8 shows the evolution of the different populations occurring after the addition of NO (at t=0) and after the addition of CN. The same experiment conducted without the addition of NO but with the addition of the 1 mM KCN resulted in the entire sample being converted to met HbCN. From both figures it can be seen that at the point at which CN is added there is a ferrous population that resembles ferrous HbNO but with both α and β peaks of the Q band blue shifted relative to the final HbNO peaks (see next figures). Figures 9 and 10 show the spectra and the time dependence of populations for met Hb-nitrite solution samples to which is added NO (top panel-.125 mM NO, bottom panel .25 mM NO) followed by the addition of 10 mM KCN after allowing the sample to evolve. For these samples compared to the previous one (Figures 7 and 8), the ten fold higher addition of CN results in a faster response and a greater conversion of the population over to the met HbCN species. It can be seen that for the sample with the lesser amount of added NO, the resulting subtracted spectra are similar to the “intermediate” ferrous spectra shown in Fig. 7. In contrast, the subtracted spectra as well as the plot of the evolving populations show that for the sample with the higher amount of added NO, the remaining ferrous population subsequent to addition of the CN contains a substantial amount of the ferrous HbNO end product. Similar plots for two sol-gel encapsulate samples (with .125 and .25 mM added NO followed by 10 mM added KCN) are shown in Figures 11 and 12. Here again, the sample with the lower amount of added NO yields subtracted ferrous spectra resembling the ferrous intermediate whereas for the sample with the higher amount of added NO, the subtracted ferrous population is a mix of intermediate and ferrous HbNO.
Figure 7.
The evolution (1 5) of the Q band absorption spectrum of a solution phase pH 7.4 met Hb sample (~ 0.45 mM in heme) in the presence of nitrite subsequent to the addition of NO (0.25 mM). After spectrum 5 was obtained (22 minutes post addition of NO), KCN (1 mM) is added (Spectrum a). Spectrum b is the result of subtracting the cyanomet reference spectrum from Spectrum a. Spectrum c is the result of subtracting the initial met nitrite spectrum (Spectrum 1) from Spectrum 5.
Figure 8.
Evolution of populations from the experiment shown in Fig. 7.
Figure 9.
Same type of experiment as in Figure 7 but with 10 mM instead of 1 mM KCN added. The two panels show the results two different concentrations of added NO.
Figure 10.
Evolution of populations from the experiments shown in Fig. 9.
Figure 11.
Same type of experiment as in Figure 9 with 10 mM KCN added but using a sol-gel sample ([met Hb]) instead of a solution phase sample. The two panels show the results two different concentrations of added NO.
Figure 12.
Evolution of populations from the experiments shown in Fig. 11.
The nature of the ferrous intermediate: DAF-2 fluorescence
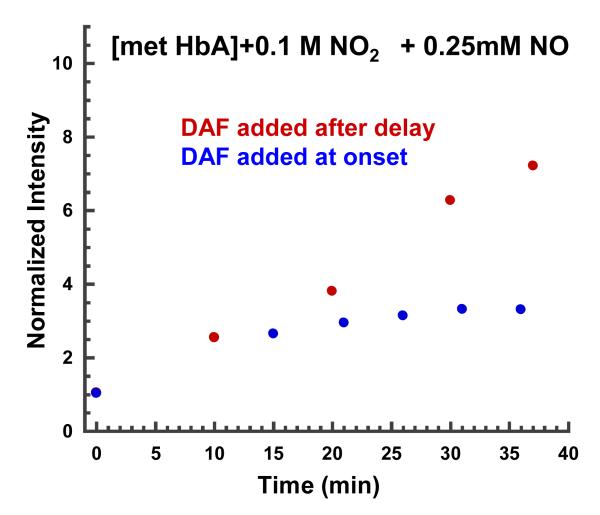
Fig. 13 shows the change in DAF-2 fluorescence intensity with time for two different samples. In one case DAF-2 is present in the buffer bathing the sol-gel encapsulated met Hb-nitrite samples from the start when NO is added to the met Hb-nitrite sample. In the other case the DAF-2 is added after the NO containing sample has evolved to a level where the absorption spectrum indicated a build up of the intermediate. In both cases the DAF-2 fluorescence increases with time but with a larger increase for the sample that has the DAF-2 added after the appearance of the intermediate. Similar samples with only nitrite show no such increase over a much longer time interval. Additionally, when samples of nitrite (0.1 M) with DAF-2 in the same sealed tubes used for the above measurements are flushed with NO and left overnight, there is only a small initial increase in DAF-2 fluorescence with no further change over the ensuing 12 hour period.
Figure 13.
Increase in DAF-2 fluorescence intensity, see text for details.
Generation of S-nitrosothiols
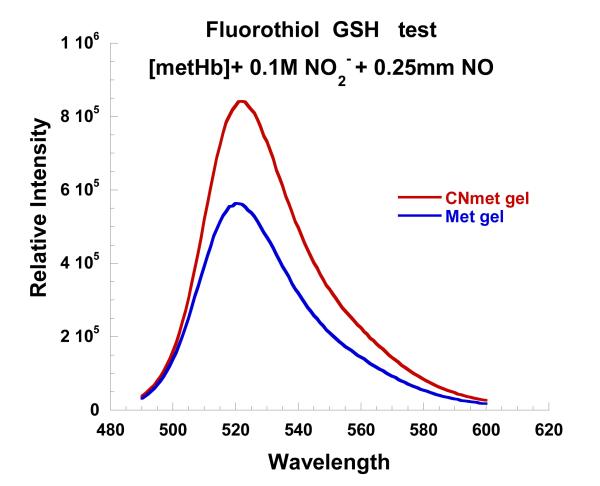
The DAF-2 results indicate that a source of N2O3/NO+ is being generated during the NO reaction with met Hb-nitrite. If that is indeed the case then the reaction should also be capable of nitrosating the sulfhydryls of peptides and amino acids such as GSH and cysteine respectively. To test this possibility, L-cysteine was added to the buffer bathing two different sol-gel samples. In one case the encapsulated Hb was met HbCN and in the other case it was met Hb-nitrite. In both cases the bathing buffer had 0.1 M nitrite and 0.25 mM NO. After, the spectrum of the met Hb-nitrite samples showed spectral evidence for the build up of the intermediate, an aliquot of the cysteine containing buffer was withdrawn from the tube (anaerobically) and added to a solution containing GSH. The same protocol (with respect to time and volume) was carried out for the met HbCN sample as well. The GSH samples were evaluated and compared with respect to reactive –SH groups by using an –SH reactive fluorophore. It can be seen in Fig. 14 that the eluant from the cyanomet sample has a greater number of free SH groups than the sample undergoing the NO induced reaction with met Hb-nitrite. Attempts at using amperometric detection of SNO formation were ambiguous due to issues relating to the inherent instability of the compound and sensitivity of the instrument.
Figure 14.
Fluorescence assay to compare the relative concentration of free sulfhydryls on GSH for two different experimental protocols (see text for details).
Discussion
The presented results are consistent with earlier studies that show that nitrite accelerates the autoreduction of MetHb(Fe(III)-NO) to Hb(Fe(II)-NO)[32; 33]. The present results also indicate that the nitrite-mediated process occurs through an intermediate that forms prior to the formation of the ferrous nitroso derivative of Hb. By starting with an excess of nitrite, it is possible to follow the sequence starting with the MetHb nitrite derivative. The progressive addition of NO first produces a spectroscopically distinct population that continues to grow until approximately 80% of the initial MetHb nitrite population has been converted into the intermediate. At that point, continued addition of NO results in the appearance of the end point population-Hb(Fe(II)-NO). It is clear from the evolution of the populations that the formation of the Fe(II)-NO hemes occurs at the expense of the intermediate and that the formation of the intermediate is associated with loss of the Met-nitrite hemes. Whereas the build up of intermediate at the expense of the Hb-nitrite population is straightforward to explain in terms of added NO interacting with the heme bound nitrite, it is not obvious as to why the population of the intermediate has to build up prior to the relatively precipitous NO-induced collapse of the intermediate population with a concomitant build up of the ferrous NO product. This behavior will be revisited after the discussion of the nature of the intermediate.
The nature of the intermediate population
The CN and NO titration experiments show that the intermediate population can be pushed towards either of two relatively inert products. The addition of the CN results in a substantial but not total conversion of the intermediate population to the MetHb(Fe(III)-CN) product whereas the same intermediate population can be driven entirely to the Hb(Fe(II)-NO) product. Once the Fe(II)-NO heme is formed as in the case when higher amounts of NO are added prior to the addition of CN, the CN can no longer convert that heme to a Fe(III)-CN derivative. These results suggest that the intermediate population is poised in a balance between ferric and ferrous hemes. This balance is achievable if there is a dynamic equilibrium between Fe(III) and Fe(II) heme species with both types of heme having a ligand that can be displaced or replaced by a stronger ligand such as CN or NO for ferric and ferrous heme respectively.
The DAF-2 results can be explained by a build up in either N2O3 or NO+ that is concomitant with the build up in the intermediate. This DAF-2 result is similar to results reported previously [49]for glass-embedded samples of MetHb-nitrite exposed to NO. The formation of either of these two reactive derivatives of NO can generate S-nitrosothiols which would explain the capacity of the L-cysteine containing eluant from the sol-gel encapsulated population of “intermediate” to generate GSNO.
The formation of NO+ has been proposed to occur as part of the autoreduction mechanism for Fe(III)-NO[39; 40]. The key aspect of this mechanism is the formation of the resonance pair Fe(III)-NO↔Fe(II)-NO+. It was proposed that the presence of excess NO can result in the displacement of the NO+ by NO leading to the formation of Fe(II)-NO. Under the conditions of the present study where there is an excess of nitrite relative to NO, the NO+ mechanism is not likely to be dominant. A more plausible mechanism is one based on a heme reaction termed nitrite anhydrase[48]. In this reaction, nitrite and NO combine within the distal heme pocket of Hb to form N2O3 coordinated to a ferrous heme. This mechanism builds on the EPR-supported claim that Met heme-bound nitrite can exist as an equilibrium population consisting of:
NO• then reacts with the ferrous bound radical to form Fe(II)-N2O3. The NO titration data is consistent with NO displacing the N2O3 from the Fe(II)-N2O3 heme resulting in the formation of the highly stable Fe(II)-NO heme. The seeming autocatalytic behavior that occurs once the population builds up to over 80% may be in part the result of two factors: i) the rate of NO reacting with the heme bound nitrite being faster than that of the NO displacement of heme-bound N2O3; and ii) the NO displaced N2O3 dissociating into NO and NO2 thereby sustaining and accelerating the reaction with the intermediate with continued production of NO.
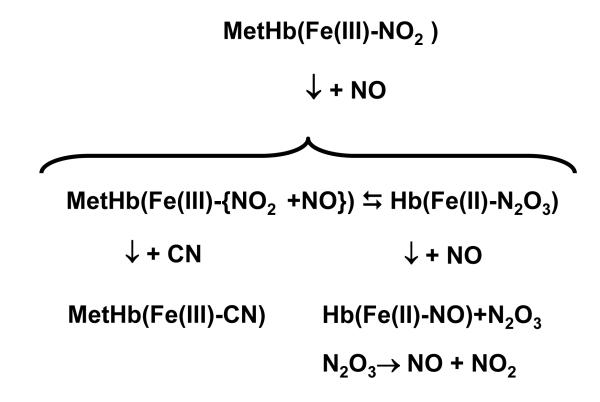
The scheme shown in Fig. 15 summarizes the proposed reactions that account for the observed results. The key feature attributed to the intermediate that accounts for the CN and NO titration is the proposed dynamic equilibrium between ferric heme with nitrite bound to the iron and an uncoordinated NO residing within the distal hemepocket in close proximity to the heme-bound nitrite (represented by a curly bracket in the figure) and ferrous heme with N2O3 bound to the ferrous iron. Our earlier results [49]obtained on Hb embedded in a trehalose-derived glassy matrix is consistent with there being a requirement for a conformational change within the distal hemepocket in order to stabilize the Fe(II)-NO2•
Figure 15.
A proposed scheme to account for the observed results in the presence and absence of CN and NO.
Quaternary structure dependence
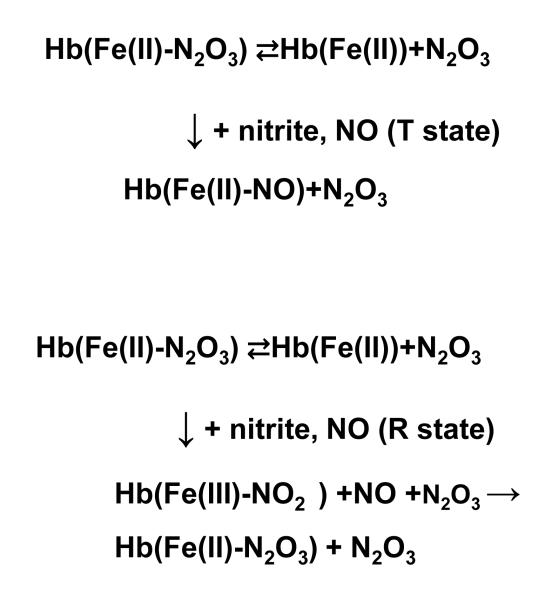
Previous studies demonstrated that the nitrite reductase reaction between a ferrous five coordinate heme and nitrite in hemoglobins is quaternary - structure dependent with the rates being significantly faster for the R state. In an earlier study, sol-gel encapsulation was used to trap T and R forms of fully deoxygenated HbA in order to directly compare the NR activity of HbA under similar solution conditions. In the present study, the same approach is used to compare T and R state forms of MetHb at the same pH with respect to the reaction of added NO in the presence of excess nitrite. In both the R and T state samples there is a comparable build up of intermediate; however, the formation of the nitroso ferrous derivative is faster and more pronounced for the T state sample whereas for the R state the intermediate persists longer. The R/T difference in the NR activity can be used to explain this R/T difference in the reactivity of MetHb-nitrite towards NO. The R-T difference in NR rates injects itself into the Met-nitrite reaction at the level of the intermediate. Assuming the intermediate is the Fe(II)-N2O3 species, then upon dissociation of the N2O3, the ferrous five coordinate heme has two other possible substrates: nitrite and NO. Under the present condition where there is an excess of nitrite relative to the NO, one can consider the competition between the two substrates/ligands. The rate of binding of NO to the ferrous heme is essentially the same for the R and T state species, hence it is proposed that the variation in the NR rates that determine the different outcomes. For T state Hb, the lower rate for NR favors NO binding over the nitrite reaction; whereas, for the R state, the NR reaction can now compete with the NO binding. In the presence of high concentration of nitrite, the R state scenario leads to a self sustaining reaction in that the NR reaction results in the formation of ferric heme which can then bind nitrite and again form the intermediate. This proposed scheme is shown in Fig. 16 where it can be seen how the R state pathway leads to greater production of N2O3 compared to the T state pathway.
Figure 16.
A proposed scheme to account for the difference between T and R state [met Hb] with respect to the response to added NO in the presence of excess nitrite.
Physiological implications
Non-physiological levels of nitrite are used in the present work to clearly identify reactions associated with the Met nitrite derivative of HbA. Despite the high levels of nitrite, the presented results have implications with respect to the proposed in vivo reactivity of Hb with respect to vasoactivity. The results support the appearance of a relatively long lived Hb intermediate derived from the presence of both NO and nitrite that has properties implying the production of N2O3, a potent generator of S-nitrosothiols. This finding supports the claims that Hb can function as catalyst for the formation of S-nitrosothiols[30] which are more likely to function as a long lived bioactive source of NO than the free NO produced by NOS. The mechanism that emerges from this study is very similar to the nitrite anhydrase mechanism proposed by Gladwin and coworkers[30; 48] and consistent with the prediction by Ford and coworkers that such mechanisms could result in the production of S-nitrosothiols[32; 33]. This N2O3 based mechanism, if active under physiological conditions can account for the formation of SNO-Hb as well as S-nitrosothiol derivatives of cysteine and glutathione. The quaternary structure dependence of this reaction, may explain why certain acellular Hb formulations (most notably certain PEGylated Hbs) are vasodilatory instead of being vasoconstrictive as would be expected based on the NO scavenging capacity of most potential HBOC candidates. The vasodilatory properties of PEGylated Hbs are likely attributed to a PEGylation platform-induced increase in the stability of the R state as reflected in the increased oxygen affinity. This increase in the propensity of these PEGylated Hbs to adopt the R state conformation would result in an increased rate for the nitrite reductase reaction which in turn would result in a higher production of bioactive forms of NO through the N2O3 generating pathway associated with the Met derivative. This Met Hb-based hypothesis is strongly supported by the observation (Cabrales et al, submitted) that infusion of the Met derivative of a PEGylated Hb was substantially more effective than the corresponding ferrous derivative with respect to reversing vasoconstriction due to NO scavenging.
Supplementary Material
Figure 1s. Time evolution of the Q band absorption spectrum of sol-gel encapsulated met Hb ([met Hb] bathed in pH 7.4 buffer, subsequent to the addition of NO (0.25 mM final concentration) in the presence (top panel) and absence (bottom panel) of nitrite (20 mM final concentration).
Figure 2s. Time evolution of populations of Hb derivatives subsequent to the addition of NO (0.25 mM final) to encapsulated met Hb at pH 7.4 in the presence (A) and absence (B) of 20 mM nitrite.
Acknowledgment
This work was supported through funding from National Institutes of Health Grant P01HL071064 and FJC, A Foundation of Philanthropic Funds.
Footnotes
Publisher's Disclaimer: This is a PDF file of an unedited manuscript that has been accepted for publication. As a service to our customers we are providing this early version of the manuscript. The manuscript will undergo copyediting, typesetting, and review of the resulting proof before it is published in its final citable form. Please note that during the production process errors may be discovered which could affect the content, and all legal disclaimers that apply to the journal pertain.
References
- [1].Frei AC, Guo Y, Jones DW, Pritchard KA, Jr., Fagan KA, Hogg N, Wandersee NJ. Vascular dysfunction in a murine model of severe hemolysis. Blood. 2008;112:398–405. doi: 10.1182/blood-2007-12-126714. [DOI] [PMC free article] [PubMed] [Google Scholar]
- [2].Hsu LL, Champion HC, Campbell-Lee SA, Bivalacqua TJ, Manci EA, Diwan BA, Schimel DM, Cochard AE, Wang X, Schechter AN, Noguchi CT, Gladwin MT. Hemolysis in sickle cell mice causes pulmonary hypertension due to global impairment in nitric oxide bioavailability. Blood. 2007;109:3088–98. doi: 10.1182/blood-2006-08-039438. [DOI] [PMC free article] [PubMed] [Google Scholar]
- [3].Minneci PC, Deans KJ, Shiva S, Zhi H, Banks SM, Kern S, Natanson C, Solomon SB, Gladwin MT. Nitrite reductase activity of hemoglobin as a systemic nitric oxide generator mechanism to detoxify plasma hemoglobin produced during hemolysis. Am J Physiol Heart Circ Physiol. 2008;295:H743–54. doi: 10.1152/ajpheart.00151.2008. [DOI] [PMC free article] [PubMed] [Google Scholar]
- [4].Cabrales P, Tsai AG, Winslow RM, Intaglietta M. Extreme hemodilution with PEG-hemoglobin vs. PEG-albumin. Am J Physiol. 2005;289:H2392–400. doi: 10.1152/ajpheart.00225.2005. [DOI] [PubMed] [Google Scholar]
- [5].Cabrales P, Kanika ND, Manjula BN, Tsai AG, Acharya SA, Intaglietta M. Microvascular PO2 during extreme hemodilution with hemoglobin site specifically PEGylated at Cys-93(beta) in hamster window chamber. Am J Physiol. 2004;287:H1609–17. doi: 10.1152/ajpheart.00146.2004. [DOI] [PubMed] [Google Scholar]
- [6].Wettstein R, Tsai AG, Erni D, Winslow RM, Intaglietta M. Resuscitation with MalPEG-Hemoglobin improves microcirculatory blood flow and tissue oxygenation after hemorrhagic shock in awake hamsters. Crit Care Med. 2003;31:1824–1830. doi: 10.1097/01.CCM.0000069340.16319.F2. [DOI] [PubMed] [Google Scholar]
- [7].Cabrales P, Friedman J. Pegylated hemoglobins mechanisms to avoid vasoconstriction and maintain perfusion. Transfusion Alternatives in Transfusion Medicine. 2007;9:281–293. [Google Scholar]
- [8].Acharya SA, Acharya VN, Kanika ND, Tsai AG, Intaglietta M, Manjula BN. Non-hypertensive tetraPEGylated canine haemoglobin: correlation between PEGylation, O2 affinity and tissue oxygenation. Biochem J. 2007;405:503–11. doi: 10.1042/BJ20070238. [DOI] [PMC free article] [PubMed] [Google Scholar]
- [9].Cooper CE. Radical producing and consuming reactions of hemoglobin: how can we limit toxicity? Artif Organs. 2009;33:110–4. doi: 10.1111/j.1525-1594.2008.00694.x. [DOI] [PubMed] [Google Scholar]
- [10].Fitzpatrick CM, Savage SA, Kerby JD, Clouse WD, Kashyap VS. Resuscitation with a blood substitute causes vasoconstriction without nitric oxide scavenging in a model of arterial hemorrhage. J Am Coll Surg. 2004;199:693–701. doi: 10.1016/j.jamcollsurg.2004.07.025. [DOI] [PubMed] [Google Scholar]
- [11].Fronticelli C, Koehler RC. Design of recombinant hemoglobins for use in transfusion fluids. Crit Care Clin. 2009;25:357–71. doi: 10.1016/j.ccc.2008.12.010. Table of Contents. [DOI] [PubMed] [Google Scholar]
- [12].Irwin D, Buehler PW, Alayash AI, Jia Y, Bonventura J, Foreman B, White M, Jacobs R, Piteo B, Tissotvanpatot MC, Hamilton KL, Gotshall RW. Mixed S-nitrosylated Polymerized Bovine Hemoglobin Species Moderate Hemodynamic Effects in Acute Hypoxic Rats. Am J Respir Cell Mol Biol. 2009 doi: 10.1165/rcmb.2008-0364OC. [DOI] [PMC free article] [PubMed] [Google Scholar]
- [13].Jahr JS, Walker V, Manoochehri K. Blood substitutes as pharmacotherapies in clinical practice. Curr Opin Anaesthesiol. 2007;20:325–30. doi: 10.1097/ACO.0b013e328172225a. [DOI] [PubMed] [Google Scholar]
- [14].Kim HW, Greenburg AG. Hemoglobin mediated vasoactivity in isolated vascular rings. Artif Cells Blood Substit Immobil Biotechnol. 1995;23:303–9. doi: 10.3109/10731199509117946. [DOI] [PubMed] [Google Scholar]
- [15].Kim HW, Greenburg AG. Mechanisms for vasoconstriction and decreased blood flow following intravenous administration of cell-free native hemoglobin solutions. Adv Exp Med Biol. 2005;566:397–401. doi: 10.1007/0-387-26206-7_52. [DOI] [PubMed] [Google Scholar]
- [16].Mongan PD, Moon-Massat PF, Rentko V, Mihok S, Dragovich A, Sharma P. Regional blood flow after serial normovolemic exchange transfusion with HBOC-201 (Hemopure) in anesthetized swine. J Trauma. 2009;67:51–60. doi: 10.1097/TA.0b013e3181838030. [DOI] [PubMed] [Google Scholar]
- [17].Raat NJ, Liu JF, Doyle MP, Burhop KE, Klein J, Ince C. Effects of recombinant-hemoglobin solutions rHb2.0 and rHb1.1 on blood pressure, intestinal blood flow, and gut oxygenation in a rat model of hemorrhagic shock. J Lab Clin Med. 2005;145:21–32. doi: 10.1016/j.lab.2004.05.017. [DOI] [PubMed] [Google Scholar]
- [18].Serruys PW, Vranckx P, Slagboom T, Regar E, Meliga E, de Winter RJ, Heyndrickx G, Schuler G, van Remortel EA, Dube GP, Symons J. Haemodynamic effects, safety, and tolerability of haemoglobin-based oxygen carrier-201 in patients undergoing PCI for CAD. EuroIntervention. 2008;3:600–9. doi: 10.4244/eijv3i5a108. [DOI] [PubMed] [Google Scholar]
- [19].Lui FE, Dong P, Kluger R. Polyethylene glycol conjugation enhances the nitrite reductase activity of native and cross-linked hemoglobin. Biochemistry. 2008;47:10773–80. doi: 10.1021/bi801116k. [DOI] [PubMed] [Google Scholar]
- [20].Tsai AG, Cabrales P, Manjula BN, Acharya SA, Winslow RM, Intaglietta M. Dissociation of local nitric oxide concentration and vasoconstriction in the presence of cell-free hemoglobin oxygen carriers. Blood. 2006;108:3603–10. doi: 10.1182/blood-2006-02-005272. [DOI] [PMC free article] [PubMed] [Google Scholar]
- [21].Ignarro LJ, Edwards JC, Gruetter DY, Barry BK, Gruetter CA. Possible involvement of S-nitrosothiols in the activation of guanylate cyclase by nitroso compounds. FEBS Lett. 1980;110:275–8. doi: 10.1016/0014-5793(80)80091-3. [DOI] [PubMed] [Google Scholar]
- [22].Ramachandran N, Root P, Jiang XM, Hogg PJ, Mutus B. Mechanism of transfer of NO from extracellular S-nitrosothiols into the cytosol by cell-surface protein disulfide isomerase. Proc Natl Acad Sci U S A. 2001;98:9539–44. doi: 10.1073/pnas.171180998. [DOI] [PMC free article] [PubMed] [Google Scholar]
- [23].Zhang Y, Hogg N. S-Nitrosothiols: cellular formation and transport. Free Radic Biol Med. 2005;38:831–8. doi: 10.1016/j.freeradbiomed.2004.12.016. [DOI] [PubMed] [Google Scholar]
- [24].Hogg N. The biochemistry and physiology of S-nitrosothiols. Annu Rev Pharmacol Toxicol. 2002;42:585–600. doi: 10.1146/annurev.pharmtox.42.092501.104328. [DOI] [PubMed] [Google Scholar]
- [25].Hogg N. Biological chemistry and clinical potential of S-nitrosothiols. Free Radic Biol Med. 2000;28:1478–86. doi: 10.1016/s0891-5849(00)00248-3. [DOI] [PubMed] [Google Scholar]
- [26].Foster MW, Pawloski JR, Singel DJ, Stamler JS. Role of circulating S-nitrosothiols in control of blood pressure. Hypertension. 2005;45:15–7. doi: 10.1161/01.HYP.0000150160.41992.71. [DOI] [PubMed] [Google Scholar]
- [27].Liu L, Yan Y, Zeng M, Zhang J, Hanes MA, Ahearn G, McMahon TJ, Dickfeld T, Marshall HE, Que LG, Stamler JS. Essential roles of S-nitrosothiols in vascular homeostasis and endotoxic shock. Cell. 2004;116:617–28. doi: 10.1016/s0092-8674(04)00131-x. [DOI] [PubMed] [Google Scholar]
- [28].Arnelle DR, Stamler JS. NO+, NO, and NO- donation by S-nitrosothiols: implications for regulation of physiological functions by S-nitrosylation and acceleration of disulfide formation. Arch Biochem Biophys. 1995;318:279–85. doi: 10.1006/abbi.1995.1231. [DOI] [PubMed] [Google Scholar]
- [29].Stamler JS. S-nitrosothiols and the bioregulatory actions of nitrogen oxides through reactions with thiol groups. Curr Top Microbiol Immunol. 1995;196:19–36. doi: 10.1007/978-3-642-79130-7_4. [DOI] [PubMed] [Google Scholar]
- [30].Angelo M, Singel DJ, Stamler JS. An S-nitrosothiol (SNO) synthase function of hemoglobin that utilizes nitrite as a substrate. Proc Natl Acad Sci U S A. 2006;103:8366–71. doi: 10.1073/pnas.0600942103. [DOI] [PMC free article] [PubMed] [Google Scholar]
- [31].Stamler JS, Jia L, Eu JP, McMahon TJ, Demchenko IT, Bonaventura J, Gernert K, Piantadosi CA. Blood flow regulation by S-nitrosohemoglobin in the physiological oxygen gradient. Science. 1997;276:2034–7. doi: 10.1126/science.276.5321.2034. [DOI] [PubMed] [Google Scholar]
- [32].Fernandez BO, Ford PC. Nitrite catalyzes ferriheme protein reductive nitrosylation. J Am Chem Soc. 2003;125:10510–1. doi: 10.1021/ja036693b. [DOI] [PubMed] [Google Scholar]
- [33].Fernandez BO, Lorkovic IM, Ford PC. Mechanisms of ferriheme reduction by nitric oxide: nitrite and general base catalysis. Inorg Chem. 2004;43:5393–402. doi: 10.1021/ic049532x. [DOI] [PubMed] [Google Scholar]
- [34].Gow AJ, Stamler JS. Reactions between nitric oxide and haemoglobin under physiological conditions. Nature. 1998;391:169–73. doi: 10.1038/34402. [DOI] [PubMed] [Google Scholar]
- [35].Jia L, Bonaventura C, Bonaventura J, Stamler JS. S-nitrosohaemoglobin: a dynamic activity of blood involved in vascular control. Nature. 1996;380:221–226. doi: 10.1038/380221a0. [DOI] [PubMed] [Google Scholar]
- [36].Gow AJ, Luchsinger BP, Pawloski JR, Singel DJ, Stamler JS. The oxyhemoglobin reaction of nitric oxide. Proc Natl Acad Sci U S A. 1999;96:9027–32. doi: 10.1073/pnas.96.16.9027. [DOI] [PMC free article] [PubMed] [Google Scholar]
- [37].Luchsinger BP, Rich EN, Gow AJ, Williams EM, Stamler JS, Singel DJ. Routes to S-nitroso-hemoglobin formation with heme redox and preferential reactivity in the beta subunits. Proc Natl Acad Sci U S A. 2003;100:461–6. doi: 10.1073/pnas.0233287100. [DOI] [PMC free article] [PubMed] [Google Scholar]
- [38].McMahon TJ, Stamler JS. Concerted nitric oxide/oxygen delivery by hemoglobin. Methods Enzymol. 1999;301:99–114. doi: 10.1016/s0076-6879(99)01073-3. [DOI] [PubMed] [Google Scholar]
- [39].Salgado MT, Nagababu E, Rifkind JM. Quantification of intermediates formed during the reduction of nitrite by deoxyhemoglobin. J Biol Chem. 2009 doi: 10.1074/jbc.M808647200. In press. [DOI] [PMC free article] [PubMed] [Google Scholar]
- [40].Nagababu E, Ramasamy S, Rifkind JM. Intermediates detected by visible spectroscopy during the reaction of nitrite with deoxyhemoglobin: the effect of nitrite concentration and diphosphoglycerate. Biochemistry. 2007;46:11650–9. doi: 10.1021/bi700364e. [DOI] [PubMed] [Google Scholar]
- [41].Gladwin MT, Kim-Shapiro DB. The functional nitrite reductase activity of the heme-globins. Blood. 2008;112:2636–47. doi: 10.1182/blood-2008-01-115261. [DOI] [PMC free article] [PubMed] [Google Scholar]
- [42].Gladwin MT, Grubina R, Doyle MP. The New Chemical Biology of Nitrite Reactions with Hemoglobin: R-State Catalysis, Oxidative Denitrosylation, and Nitrite Reductase/Anhydrase. Acc Chem Res. 2008 doi: 10.1021/ar800089j. [DOI] [PubMed] [Google Scholar]
- [43].Roche CJ, Dantsker D, Samuni U, Friedman JM. Nitrite reductase activity of sol-gel-encapsulated deoxyhemoglobin. Influence of quaternary and tertiary structure. J Biol Chem. 2006;281:36874–82. doi: 10.1074/jbc.M603914200. [DOI] [PubMed] [Google Scholar]
- [44].Gladwin MT, Raat NJ, Shiva S, Dezfulian C, Hogg N, Kim-Shapiro DB, Patel RP. Nitrite as a vascular endocrine nitric oxide reservoir that contributes to hypoxic signaling, cytoprotection, and vasodilation. Am J Physiol Heart Circ Physiol. 2006;291:H2026–35. doi: 10.1152/ajpheart.00407.2006. [DOI] [PubMed] [Google Scholar]
- [45].Huang Z, Shiva S, Kim-Shapiro DB, Patel RP, Ringwood LA, Irby CE, Huang KT, Ho C, Hogg N, Schechter AN, Gladwin MT. Enzymatic function of hemoglobin as a nitrite reductase that produces NO under allosteric control. J Clin Invest. 2005;115:2099–107. doi: 10.1172/JCI24650. [DOI] [PMC free article] [PubMed] [Google Scholar]
- [46].Isbell TS, Gladwin MT, Patel RP. Hemoglobin oxygen fractional saturation regulates nitrite-dependent vasodilation of aortic ring bioassays. Am J Physiol Heart Circ Physiol. 2007;293:H2565–72. doi: 10.1152/ajpheart.00759.2007. [DOI] [PubMed] [Google Scholar]
- [47].Grubina R, Basu S, Tiso M, Kim-Shapiro DB, Gladwin MT. Nitrite reductase activity of hemoglobin S (sickle) provides insight into contributions of heme redox potential versus ligand affinity. J Biol Chem. 2008;283:3628–38. doi: 10.1074/jbc.M705222200. [DOI] [PubMed] [Google Scholar]
- [48].Basu S, Grubina R, Huang J, Conradie J, Huang Z, Jeffers A, Jiang A, He X, Azarov I, Seibert R, Mehta A, Patel R, King SB, Hogg N, Ghosh A, Gladwin MT, Kim-Shapiro DB. Catalytic generation of N2O3 by the concerted nitrite reductase and anhydrase activity of hemoglobin. Nat Chem Biol. 2007;3:785–94. doi: 10.1038/nchembio.2007.46. [DOI] [PubMed] [Google Scholar]
- [49].Navati MS, Friedman JM. Reactivity of glass-embedded met hemoglobin derivatives toward external NO: implications for nitrite-mediated production of bioactive NO. J Am Chem Soc. 2009;131:12273–9. doi: 10.1021/ja903364h. [DOI] [PMC free article] [PubMed] [Google Scholar]
- [50].Samuni U, Roche C, Dantsker D, Friedman J. T- and R-state Tertiary Relaxations in Sol-gel Encapsulated Haemoglobin. In: Bolognesi M d.P.G., Verde C., editors. Dioxygen Binding and Sensing Proteins. A Tribute to Beatrice and Jonathan Wittenberg. Springer; Springer Berlin Heidelberg New York: 2008. pp. 133–159. [Google Scholar]
- [51].Samuni U, Roche CJ, Dantsker D, Juszczak LJ, Friedman JM. Modulation of reactivity and conformation within the T-quaternary state of human hemoglobin: the combined use of mutagenesis and sol-gel encapsulation. Biochemistry. 2006;45:2820–35. doi: 10.1021/bi050010i. [DOI] [PMC free article] [PubMed] [Google Scholar]
- [52].Viappiani C, Bettati S, Bruno S, Ronda L, Abbruzzetti S, Mozzarelli A, Eaton WA. New insights into allosteric mechanisms from trapping unstable protein conformations in silica gels. Proc Natl Acad Sci U S A. 2004;101:14414–9. doi: 10.1073/pnas.0405987101. [DOI] [PMC free article] [PubMed] [Google Scholar]
- [53].Samuni U, Dantsker D, Khan I, Friedman AJ, Peterson E, Friedman JM. Spectroscopically and kinetically distinct conformational populations of sol-gel-encapsulated carbonmonoxy myoglobin. A comparison with hemoglobin. J Biol Chem. 2002;277:25783–90. doi: 10.1074/jbc.M200301200. [DOI] [PubMed] [Google Scholar]
- [54].Shibayama N, Saigo S. Direct observation of two distinct affinity conformations in the T state human deoxyhemoglobin. FEBS Lett. 2001;492:50–3. doi: 10.1016/s0014-5793(01)02225-6. [DOI] [PubMed] [Google Scholar]
- [55].Mozzarelli A, Bettati S. Functional Properties of Immobilized Proteins. In: Nalwa H, editor. Advanced Functional Molecules and Polymers. Gordon and Breach Science Publishers; Amsterdam: 2001. pp. 55–97. [Google Scholar]
- [56].Khan I, Dantsker D, Samuni U, Friedman AJ, Bonaventura C, Manjula B, Acharya SA, Friedman JM. Beta 93 modified hemoglobin: kinetic and conformational consequences. Biochemistry. 2001;40:7581–92. doi: 10.1021/bi010051o. [DOI] [PubMed] [Google Scholar]
- [57].Bruno S, Bonaccio M, Bettati S, Rivetti C, Viappiani C, Abbruzzetti S, Mozzarelli A. High and low oxygen affinity conformations of T state hemoglobin. Protein Sci. 2001;10:2401–7. doi: 10.1110/ps.20501. [DOI] [PMC free article] [PubMed] [Google Scholar]
- [58].Abbruzzetti S, Viappiani C, Bruno S, Bettati S, Bonaccio M, Mozzarelli A. Functional characterization of heme proteins encapsulated in wet nanoporous silica gels. J Nanosci Nanotechnol. 2001;1:407–15. doi: 10.1166/jnn.2001.058. [DOI] [PubMed] [Google Scholar]
- [59].Khan I, Shannon CF, Dantsker D, Friedman AJ, Perez-Gonzalez-de-Apodaca J, Friedman JM. Sol-gel trapping of functional intermediates of hemoglobin: geminate and bimolecular recombination studies. Biochemistry. 2000;39:16099–109. doi: 10.1021/bi000536x. [DOI] [PubMed] [Google Scholar]
- [60].Das TK, Khan I, Rousseau DL, Friedman JM. Temperature dependent quaternary state relaxation in sol-gel encapsulated hemoglobin. Biospectroscopy. 1999;5(S):64–70. doi: 10.1002/(SICI)1520-6343(1999)5:5+<S64::AID-BSPY7>3.0.CO;2-W. [DOI] [PubMed] [Google Scholar]
- [61].Samuni U, Roche C, Danstker D, Friedman J. T and R State Tertiary Relaxations in Sol-Gel Encapsulated Hemoglobin. Springer; 2008. [Google Scholar]
- [62].Chen Q, Lalezari I, Nagel RL, Hirsch RE. Liganded hemoglobin structural perturbations by the allosteric effector L35. Biophys J. 2005;88:2057–67. doi: 10.1529/biophysj.104.046136. [DOI] [PMC free article] [PubMed] [Google Scholar]
- [63].Lalezari I, Lalezari P, Poyart C, Marden M, Kister J, Bohn B, Fermi G, Perutz MF. New effectors of human hemoglobin: structure and function. Biochemistry. 1990;29:1515–23. doi: 10.1021/bi00458a024. [DOI] [PubMed] [Google Scholar]
- [64].Malavalli A, Manjula BN, Friedman JM, Acharya AS. Perturbation of the intermolecular contact regions (molecular surface) of hemoglobin S by intramolecular low-O2-affinity-inducing central cavity cross-bridges. J Protein Chem. 2000;19:255–67. doi: 10.1023/a:1007039111556. [DOI] [PubMed] [Google Scholar]
- [65].Marden MC, Bohn B, Kister J, Poyart C. Effectors of hemoglobin. Separation of allosteric and affinity factors. Biophys J. 1990;57:397–403. doi: 10.1016/S0006-3495(90)82556-X. [DOI] [PMC free article] [PubMed] [Google Scholar]
- [66].Peterson ES, Shinder R, Khan I, Juczszak L, Wang J, Manjula B, Acharya SA, Bonaventura C, Friedman JM. Domain-specific effector interactions within the central cavity of human adult hemoglobin in solution and in porous sol-gel matrices: evidence for long-range communication pathways. Biochemistry. 2004;43:4832–43. doi: 10.1021/bi035481o. [DOI] [PubMed] [Google Scholar]
- [67].Yokoyama T, Neya S, Tsuneshige A, Yonetani T, Park SY, Tame JR. R-state haemoglobin with low oxygen affinity: crystal structures of deoxy human and carbonmonoxy horse haemoglobin bound to the effector molecule L35. J Mol Biol. 2006;356:790–801. doi: 10.1016/j.jmb.2005.12.018. [DOI] [PubMed] [Google Scholar]
- [68].Kojima H, Nakatsubo N, Kikuchi K, Kawahara S, Kirino Y, Nagoshi H, Hirata Y, Nagano T. Detection and imaging of nitric oxide with novel fluorescent indicators: diaminofluoresceins. Anal Chem. 1998;70:2446–53. doi: 10.1021/ac9801723. [DOI] [PubMed] [Google Scholar]
Associated Data
This section collects any data citations, data availability statements, or supplementary materials included in this article.
Supplementary Materials
Figure 1s. Time evolution of the Q band absorption spectrum of sol-gel encapsulated met Hb ([met Hb] bathed in pH 7.4 buffer, subsequent to the addition of NO (0.25 mM final concentration) in the presence (top panel) and absence (bottom panel) of nitrite (20 mM final concentration).
Figure 2s. Time evolution of populations of Hb derivatives subsequent to the addition of NO (0.25 mM final) to encapsulated met Hb at pH 7.4 in the presence (A) and absence (B) of 20 mM nitrite.


