Abstract
PURPOSE
The VMD2 gene, mutated in Best macular dystrophy (BMD) encodes bestrophin, a 68-kDa basolateral plasma membrane protein expressed in retinal pigment epithelial (RPE) cells. BMD is characterized by a depressed light peak (LP) in the electro-oculogram. Bestrophin is thought to be the Cl channel that generates the LP. The goal was to generate an animal model of BMD and to determine the effects of bestrophin overexpression on the RPE-generated components of the ERG.
METHODS
Bestrophin or bestrophin mutants (W93C or R218C) were overexpressed in the RPE of rats by injection of replication-defective adenovirus. Immunofluorescence microscopy and ERG recordings were used to study subsequent effects.
RESULTS
Bestrophin was confined to the basolateral plasma membrane of the RPE. Neither wild-type (wt) nor mutant bestrophin affected the a- or b-waves of the ERG. Wt bestrophin, however, increased the c-wave and fast oscillation (FO), but not the LP. In contrast, both mutants had little or no effect on the c-wave and FO, but did reduce LP amplitude. LP amplitudes across a range of stimuli were not altered by wt bestrophin, though the luminance response function was desensitized. LP response functions were unaffected by bestrophin R218C but were significantly altered by bestrophin W93C.
CONCLUSIONS
A model of BMD was developed in the present study. Because overexpression of wt bestrophin shifted luminance response but did not alter the range of LP response amplitudes, the authors conclude that the rate-limiting step for generating LP amplitude occurs before activation of bestrophin or that bestrophin does not directly generate the LP conductance.
The VMD2 gene is mutated in individuals with Best vitelliform macular dystrophy (BMD),1,2 an autosomal dominant disease characterized by early-onset degeneration of the macula, 3 a specialized region of the retina with the fovea at its center. VMD2 encodes bestrophin, a 68-kDa transmembrane protein localized to the basolateral plasma membrane of retinal pigment epithelial (RPE) cells.4 Bestrophin is a member of the RFP-TM family of proteins that is named for a highly conserved arginine, phenylalanine, proline (RFP) motif.1,2,5 In humans, four RFP-TM family members including bestrophin have been identified from genomic data.5
BMD is one of several diseases that present clinically with an egg-yolk–like vitelliform lesion in the ocular fundus.6,7 However, the only fully penetrant symptom of the disease is the finding of an abnormal ratio of the electro-oculogram (EOG) light peak (LP) to the dark trough, without aberrations in the a-or b-waves of the clinical electroretinogram (ERG).8,9 This is the defining characteristic of BMD and distinguishes it from other vitelliform dystrophies. The LP can be monitored more precisely using DC amplification of the ERG.10 In vitro studies on chick retina/RPE/choroid preparations have shown that the LP is generated by a depolarization of the basolateral plasma membrane of the RPE due to activation of Cl conductance11,12 and studies of RPE Cl conductances (reviewed in Ref. 13) indicate that a Ca2+ sensitive Cl channel probably underlies the LP. It has been proposed that bestrophin functions directly as a Ca2+-sensitive Cl channel, based on patch-clamp studies of bestrophin and other RFP-TM family members heterologously overexpressed in cell culture.14–16
Although these patch-clamp studies suggest a potential function for bestrophin, understanding the etiology of BMD requires animal models that recapitulate the major symptoms of the disease. Therefore, we set out to develop a model of BMD by transiently overexpressing mutant forms of bestrophin in the eyes of rats, by using adenovirus vectors. Our data indicate that the amplitude of the LP is indeed depressed by overexpression of BMD-associated bestrophin mutants without affecting the a- or b-waves of the ERG. These are exactly the symptoms observed in patients with BMD. Overexpression of wild-type (wt) besstrophin did not result in an increase in the LP, which suggests either that the limiting step in generating the LP occurs before activation of bestrophin channels or that bestrophin is not responsible directly for the LP conductance.
MATERIALS AND METHODS
Plasmid and Adenovirus Constructs
The plasmid pCDNA3.1-Best has been described.4 The W93C and R218C mutants of bestrophin were produced by using the vector pCDNA3.1-Best and the site-directed mutagenesis method (Quick-Change; Stratagene, La Jolla, CA). Bestrophin-W93C and bestrophin-R218C were transferred into the plasmid pAdlox and replication-defective adenovirus vectors were constructed in CRE8 cells, as described previously for AdBest4 using the method of Hardy et al.17 For subretinal injection, viruses were amplified in CRE8 cells and purified on a discontinuous cesium chloride gradient as described elsewhere.18 Purified viruses were dialyzed against 50 mM Tris (pH 7.5), 0.25 M NaCl and 20% (vol/vol) glycerol and stored at −80°C. Titers were determined by plaque assays performed by the Cleveland Clinic, Lerner Research Institute Virus Core. Adenoviruses used in this study included AdBest for expression of wt bestrophin, AdBest-W93C for expression of bestrophin-W93C, AdBest-R218C for expression of bestrophin-R218C, and Ψ5,17 which served as a control. In some early experiments, an adenovirus vector for expression of green fluorescent protein (GFP) was used as a control. No differences were observed in experiments using AdGFP versus Ψ5 as control vectors.
Subretinal Injections
Subretinal injections were performed on female Long-Evans rats between 6 and 8 weeks of age, as described previously.19,20 All animals were treated in accordance with the ARVO Statement for the Use of Animals in Ophthalmic and Vision Research. In brief, rats were anesthetized with ketamine (50 mg/kg) and xylazine (2 mg/kg). The animal’s eyes were dilated with phenylephrine (2.5%) and atropine (1%) drops, and a topical anesthetic (1% proparacaine) was applied. Under a stereomicroscope, a custom-engineered 32-gauge cannula20 was inserted through an incision made 1 mm posterior to the limbus. With a modified syringe (Hamilton, Reno, NV) attached to a foot activated pump, a 20-µL volume of adenovirus vector diluted to the indicated titer in Hanks’ balanced salt solution was injected. The cannula was then withdrawn and the wound allowed to recover. Rats that displayed postoperative complications due to surgery (e.g., cataract, infection) were excluded from subsequent analysis.
Conventional ERG Recordings
After overnight dark adaptation, rats were anesthetized with ketamine (50 mg/kg) and xylazine (2 mg/kg) and placed on a temperature-regulated heating pad throughout the recording session. Eye drops were used to anesthetize the cornea (1% proparacaine HCl) and to dilate the pupil (1% tropicamide, 2.5% phenylephrine HCl, and 1% cyclopentolate HCl). Conventional ERGs (a- and b-wave) were recorded from both eyes simultaneously, by using stainless-steel electrodes that made contact with the corneal surface through a thin layer of 0.7% methylcellulose. Needle electrodes placed in the rat’s cheeks and tail served as reference and ground leads, respectively. Strobe stimulus flashes ranging from −3.6 to 2.1 log cd sec/m2 were presented in a Ganzfeld (LKC Technologies, Gaithersburg, MD). Responses were differentially amplified (0.3–1500 Hz), averaged, and stored, using a signal averaging system (UTAS E-3000; LKC). The amplitudes of the a- and b-waves were measured conventionally, and b-wave intensity–response functions for each eye were analyzed as before,21 with the Naka-Rushton equation:
In this equation, response amplitude (R) is related to flash intensity (I), by using three parameters: Rmax, the asymptotic maximum response amplitude measured in microvolts; K, the semisaturation constant or intensity (cd sec/m2) required to elicit a b-wave equal to one-half the amplitude of Rmax, and n, a dimensionless slope constant.
RPE-Generated ERG Components
Measurement of RPE-generated ERG components was performed as described previously.22 In brief, responses were recorded from one eye using an unpulled 1-mm diameter glass capillary tube with filament (BF100-50-10; Sutter Instruments, Novato, CA) that was filled with Hanks’ balanced salt solution to make contact with an Ag/AgCl wire electrode. The active electrode was placed in contact with the center of the rat’s cornea. A similar electrode placed in the orbit of the same eye served as a reference lead. Responses were differentially amplified (dc-100 Hz; gain = 1000×; model DP-301; Warner Instruments, Hamden, CT), digitized at 20 Hz, and stored on computer with datarecording software (LabScribe; iWorx, Dover, NH). White light stimuli were derived from an optical channel, using a microscope illuminator as the light source, and delivered to the test eye with a 1-cm diameter fiber-optic bundle. The unattenuated stimulus luminance was 4.7 log cd/m2. Neutral density filters (Oriel Instruments, Stratford, CT) placed in the light path were used to reduce stimulus luminance. Luminance calibrations were made with a photometer (model LS-110; Minolta, Ramsey, NJ) focused on the output of the fiber-optic bundle. A shutter system (Uniblitz, Rochester, NY) was used to control stimulus duration at 5 minutes. After the initial setup procedures, a response was recorded to the lowest-intensity light stimulus. Before additional stimuli, which were presented in order of increasing intensity, were presented, the rat was dark adapted during a 30-minute intertrial interval, and supplemental anesthesia was given (ketamine, 5–10 mg/kg per hour).
The major waveform components (c-wave, fast oscillation [FO], and LP) were analyzed as described previously.22 Grand averages were derived by averaging all waveforms within each experimental group. Because the LP time constant (τ) is not normally distributed, log τ was used for statistical purposes. All data in the dose–response and luminance series were analyzed by a two-way, repeated-measures analysis of variance (ANOVA). Single-point comparisons were made with t-tests.
Immunofluorescence
Immunofluorescence staining of rat eyes was performed essentially as described previously.19 Rats were asphyxiated with CO2 and the eyes enucleated. After removal of the anterior segments, the eyecup was immersed and stored in −20°C methanol before embedding in optimal cutting temperature (OCT) compound (Sakura Finetek, Torrance, CA). Frozen sections (10 µm) were blocked in phosphate-buffered saline (PBS) containing 3% BSA (PBS-BSA) for 1 hour, then incubated with a 1:1000 dilution of monoclonal antibody E6-6 (Novus Biologicals, Littleton, CO) in PBS-BSA for 2 hours. After they were washed in PBS, the sections were reacted with Texas-red–conjugated goat anti-mouse IgG in PBS-BSA for 1 hour, after which the sections were washed in PBS and mounted (Fluormount; Electron Microscopy Sciences, Fort Washington, PA). In some cases nuclei were stained with 4′,6′-diamino-2-phenylindole (DAPI). Sections were examined and photographed with a confocal microscope (TCS-SP2; Leica Microsystems, Bannockburn, IL).
RESULTS
Expression of Bestrophin in Rat RPE
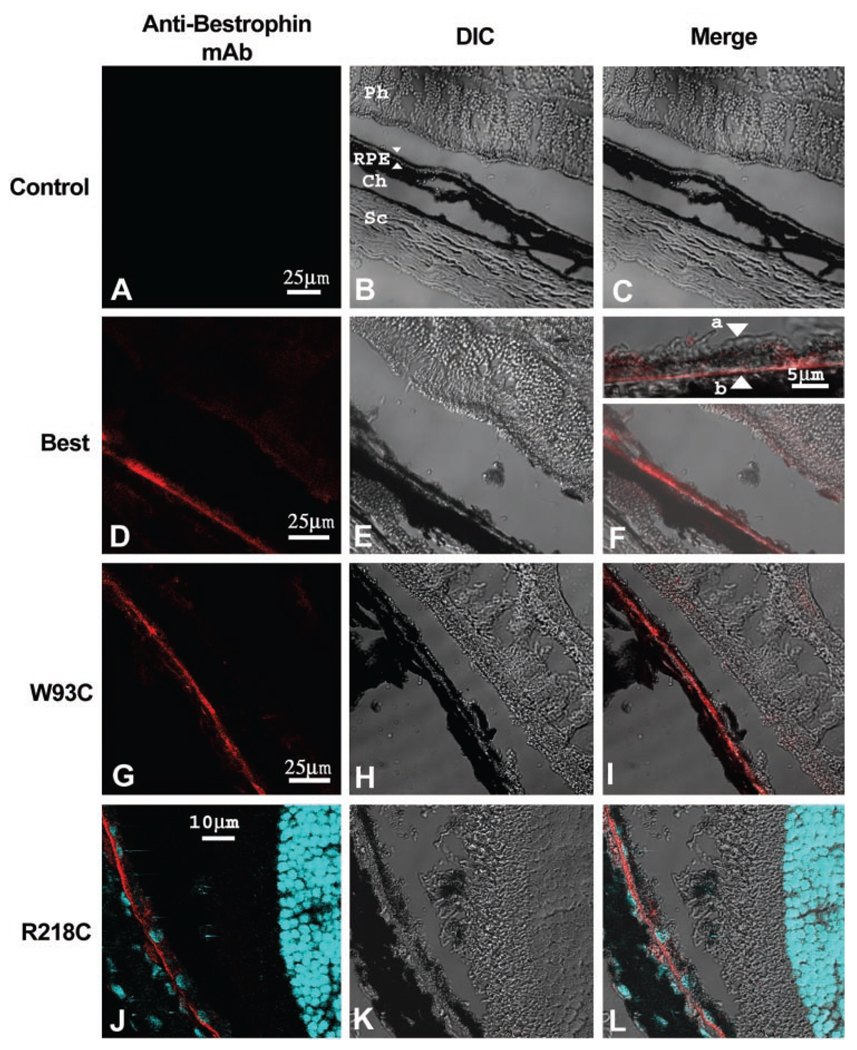
To examine the effect of bestrophin or bestrophin mutant overexpression, rats were injected subretinally with replication-defective adenovirus vectors driving expression of wt human bestrophin (AdBest), bestrophin-W93C (AdBest-W93C), bestrophin-R218C (AdBest-R218C), or a null vector (Ψ5) containing no expression cassette (control). Our initial experiments tested several doses of each vector ranging from 1.46 × 10⁶ to 4.66 × 10⁷ pfu, except for AdBest-R218C which was used only at 4.66 × 10⁷ pfu. Beginning 5 days after subretinal injection, bestrophin expression was examined by immunofluorescence (Fig. 1) at all doses and determined to be restricted to the RPE. At all doses, nearly 100% of the RPE in each section examined were positive for human bestrophin from 5 days through 6 weeks after injection. Human bestrophin (Figs. 1D–F) was always localized to the basolateral membrane of the RPE cells, consistent with our previous findings.4,23,24 Intracellular accumulation or missorting of bestrophin to the apical plasma membrane were not observed. Similarly, the bestrophin-W93C (Figs. 1G–I) and bestrophin-R218 (Figs. 1J–L) mutants were localized to the basolateral plasma membrane of the RPE cells, with no evidence of missorting or intracellular accumulation, indicating that trafficking defects due to these mutations do not underlie BMD. We did not observe accumulation of lipofuscin in or around the RPE or the formation of a vitelliform lesion in animals overexpressing either bestrophin W93C of R218C (data not shown).
FIGURE 1.
Normal localization of bestrophin and bestrophin mutants. The localization of bestrophin (D–F) or bestrophin mutants (W93C, G–I; R218C, J–L) was determined by immunofluorescence staining and confocal microscopy in eyes injected with a control (Null, A–C) vector or with adenovirus vectors encoding bestrophin (WT), or bestrophin mutants (W93C, R218C). Cryosections of rat eyes preserved in cold methanol were stained with monoclonal antibody E6-6 and a Texas-red–conjugated secondary antibody (red). For eyes expressing bestrophin-R218C, nuclei were stained with DAPI (blue). Confocal images of sections stained for bestrophin (Mab, A, D, G, J, red staining) and corresponding differential interference contrast (DIC, B, E, H, K) images are shown. When images were merged (Merge, C, F, I, L), bestrophin staining exhibited a pattern consistent with localization to the RPE (B, arrows). Inspection at higher magnification (F, inset) demonstrates that the protein was predominantly in the basolateral plasma membrane of the RPE (F, inset, apical membrane, a; basal membrane, b). Other cell types in the sclera (Sc), choroid (Ch), or neurosensory retina (Ph) did not express bestrophin. Also note that the antibody was specific for the human form of bestrophin and did not react with the endogenous protein in the uninjected eye.
Effect of Bestrophin and Bestrophin Mutants on Neural Retina Function
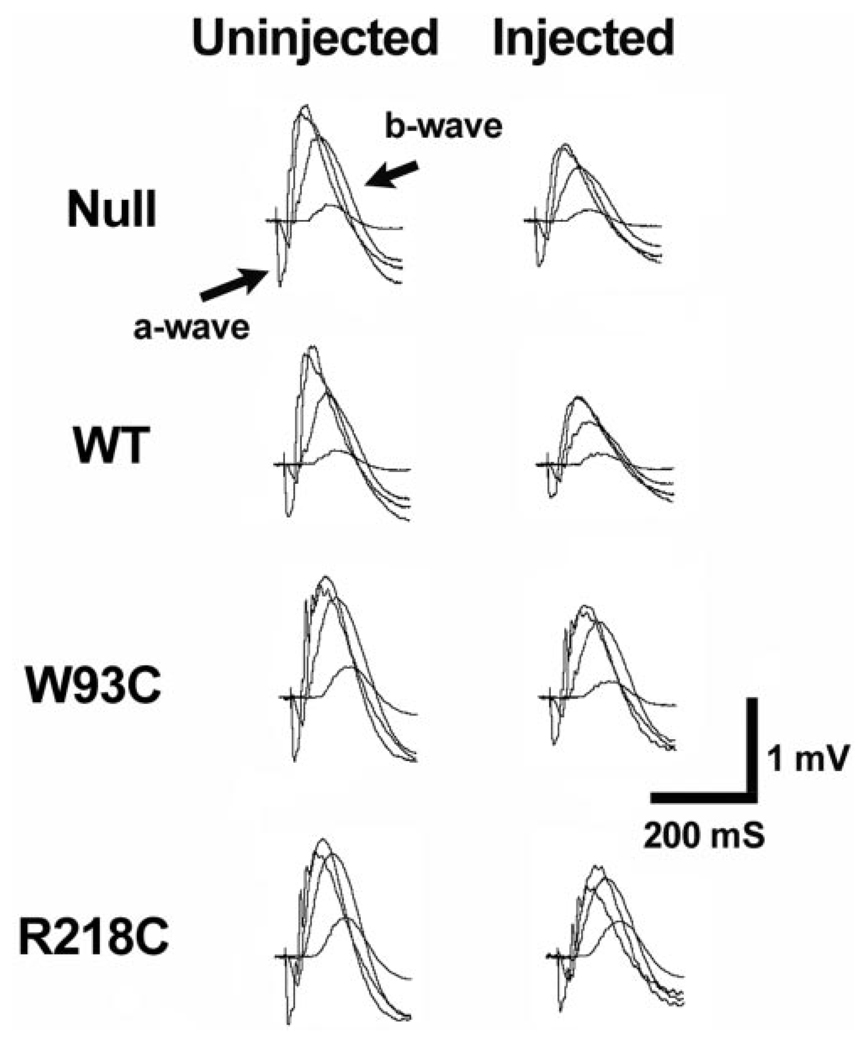
Previous results indicated that the recovery of the ERG after subretinal injection surgery was complete by 10 to 14 days after surgery.20 Therefore, in all experiments, ERGs were recorded 10 to 14 days after administration of the vector through subretinal injection. Overall retinal function was analyzed by using conventional ERG recordings. As observed previously,20 there was an overall reduction in the amplitude of the ERG recorded from vector-injected eyes versus uninjected eyes (Fig. 2), however, no difference between the a- or b-waves was recorded among groups of rats receiving any of the viral constructs (Fig. 2, Table 1).
FIGURE 2.
Effect of bestrophin and bestrophin mutant overexpression on neurosensory retina function. The effect of bestrophin overexpression on neurosensory retina function was assessed by conventional ERG. Responses to four different flash intensities are superimposed. The major ERG components (a- and b-wave) are labeled. Note that ERGs obtained from the injected eye are similar in waveform to those obtained from the control eye, though with a diminished amplitude. This effect on the ERG was presumably due to the surgery or viral load, because it did not differ with the expression construct (Table 1).
TABLE 1.
Naka-Rushton Parameters’ for Eyes Overexpressing Bestrophin and Bestrophin Mutants
| Parameter | Control n = 11 |
WT n = 19 |
R218C n = 9 |
W93C n = 12 |
|---|---|---|---|---|
| Rmax (µV) | 0.69 ± 0.16 | 0.58 ± 0.20 | 0.78 ± 0.09 | 0.76 ± 0.28 |
| n | 1.12 ± 0.10 | 1.09 ± 0.23 | 1.02 ± 0.09 | 1.05 ± 0.17 |
| K (cd-sec/m2) | 1.99 ± 1.98 | 3.33 ± 5.49 | 2.27 ± 2.07 | 3.64 ± 2.84 |
Parameter values for transduced eyes expressed relative to the values obtained from the nonsurgical eye. Data are the mean ± SD.
Effect of Bestrophin on RPE-Generated ERG Components
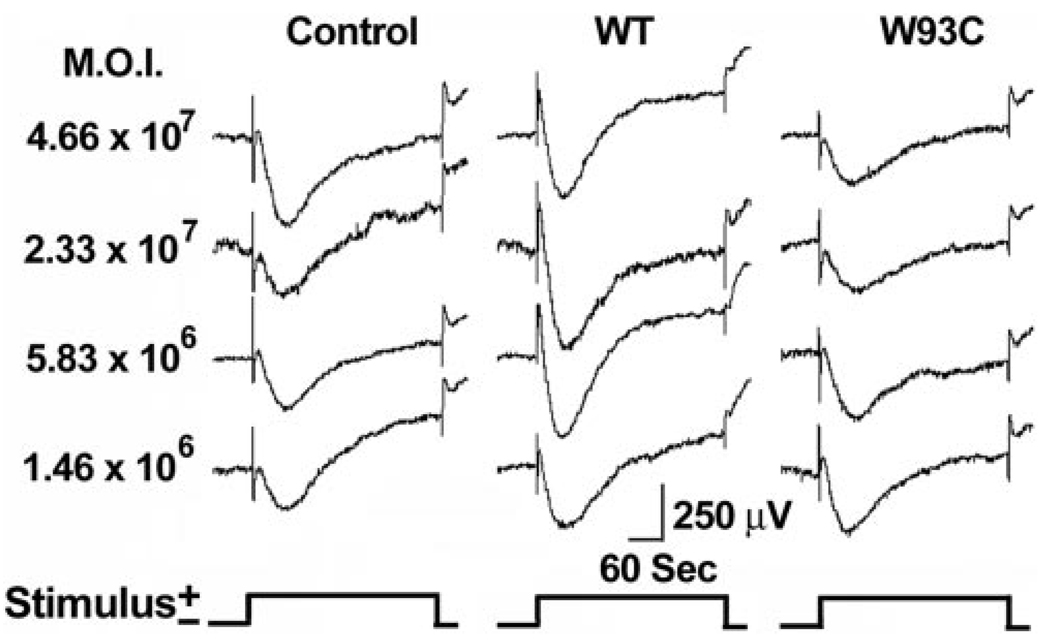
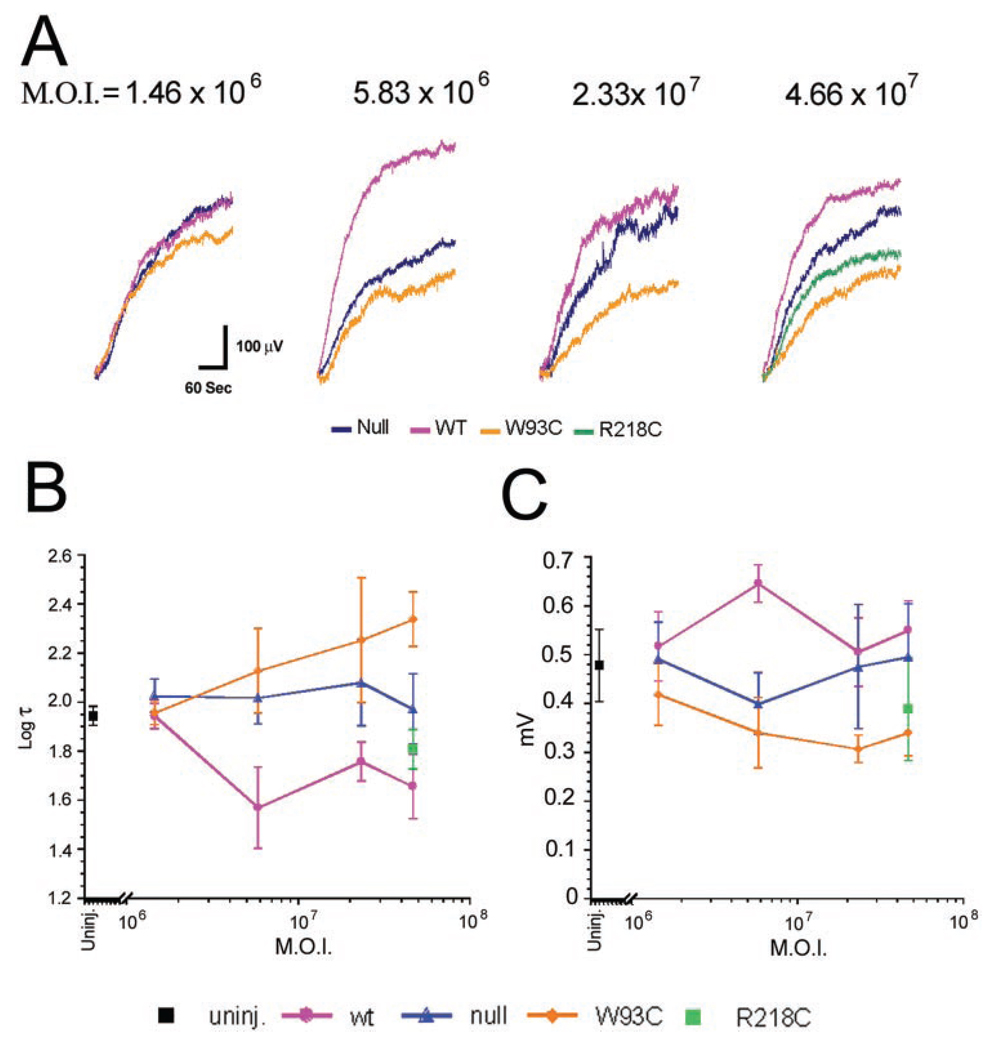
We recorded RPE-generated ERG components from rats in response to a single-standard 5-minute stimulus of 2.7 cd/m2. Grand average waveforms for control, AdBest, and AdBest-W93C–injected eyes are shown in Figure 3. All the major ERG components were present in all experimental groups. Figure 4A shows isolated mean LPs for the series of viral doses studied. In rats overexpressing wt bestrophin at a dose of 5.83 × 10⁶ pfu, the amplitude of the LP (Fig. 4B) was significantly increased relative to the control (P < 0.03); however, comparable effects were obtained at all other viral doses (Fig. 4B). ANOVA analysis of LP amplitudes did not find a significant effect on LP amplitude in response to increasing viral doses. These results indicate that the LP does not grow beyond a maximum amplitude, despite the addition of more bestrophin protein. In contrast, and consistent with the effects observed in Best disease, bestrophin-W93C overexpression significantly decreased LP amplitude (ANOVA, P < 0.0002) at all doses except the lowest, 1.46 × 10⁶. At a dose of 2.33 × 10⁷ pfu, the LP in the bestrophin-W93C group was only 64% of the amplitude in the control group, whereas wt bestrophin was 106% of control. Bestrophin-R218C overexpression also decreased LP amplitude (P < 0.02). At the single dose tested, the amplitude in the bestrophin-R218C group was 78% of control compared with 111% for wt bestrophin and 69% for bestrophin-W93C.
FIGURE 3.
Dose-response effects of bestrophin and bestrophin mutant overexpression on the ERG waveform. RPE-generated ERG components were recorded from rats injected subretinally with replication-defective adenovirus vectors with an empty expression cassette (control) or driving expression of wt bestrophin (WT) or bestrophin W93C.
FIGURE 4.
Dose-response effects of bestrophin and bestrophin mutant overexpression on the LP. Mean LPs pinned at 110 sec into a 2.7-log cd/m2 stimulus are shown for each viral dose (A) and color coded as indicated. (B) Log τ data. LP amplitudes (C) in uninjected eyes and eyes overexpressing bestrophin, bestrophin mutants, or the control, were derived from the minimum and maximum values derived from each LP contributing to the grand averages shown in (A). Data in (B) and (C) are the mean ± SE, with 5 ≤ n ≤ 30. Color codes for (B) and (C) are as indicated.
We used a time constant (τ)22 to examine the kinetics of the LP (Fig. 4C). In the control group, log τ was essentially constant across the full range of viral doses. In contrast, wt bestrophin caused a significant (ANOVA, P < 0.001) decrease in log τ at all doses, indicating a general acceleration of the LP. Log τ did not change significantly across the dose–response range, indicating saturation of the response by the 5.83 × 10⁶ dose. In comparison to control, bestrophin-W93C exhibited a significant (ANOVA, P < 0.0001) increase in logτ, indicating a slowing of the LP in response to bestrophin-W93C overexpression. For bestrophin-R218C, at the single dose examined, log τ was faster than control (P < 0.01) and similar to wt bestrophin.
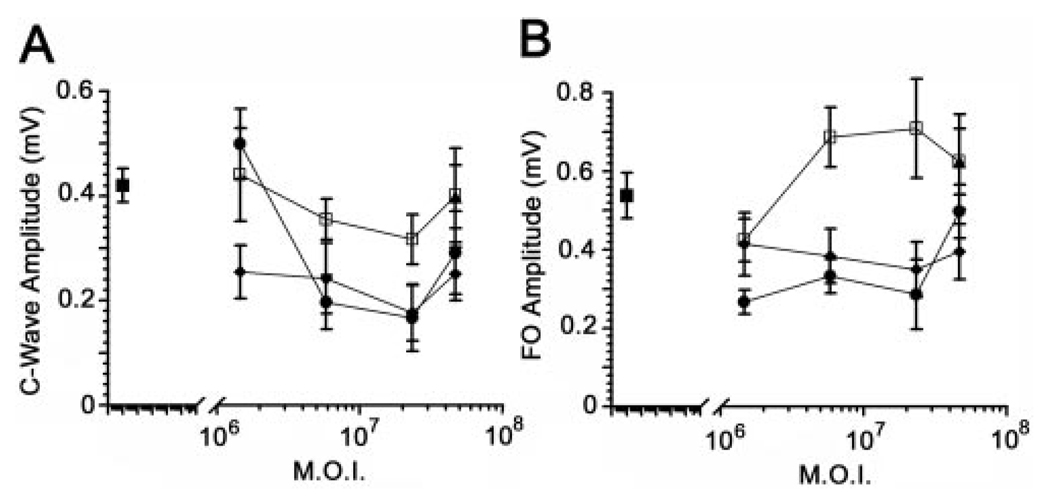
Other RPE-generated ERG components were also examined (Fig. 5). Both the c-wave and FO were significantly (P < 0.05) increased in animals overexpressing wt bestrophin at doses of 5.83 × 10⁶ pfu and higher. The c-wave was diminished at 1.46 × 10⁶ pfu in bestrophin-W93C overexpressing animals, but not at higher doses, and the FO was unaffected in bestrophin-W93C–overexpressing rats. The c-wave and FO in animals injected with 4.66 × 10⁷ pfu of AdBest-R218C exhibited c-wave and FO amplitudes identical with those in animals overexpressing wt-bestrophin, despite the diminished LP amplitude.
FIGURE 5.
Dose-response effects of bestrophin and bestrophin mutant overexpression on the c-wave and FO. c-Wave (A) and FO (B) amplitudes from ERGs conducted on uninjected (■) rats; rats injected with a null adenovirus vector (●); or rats injected with adenovirus vectors for overexpression of wt-bestrophin (□), bestrophin-W93C (♦), or bestrophin-R218C (▲) were examined as a function of viral dose. Data are the mean ± SE, with 5 ≤ n ≤ 30.
Effect of Bestrophin and Bestrophin Mutants on Light Sensitivity of the LP
As stimulus luminance varies, each ERG component varies in amplitude and timing.22,25 Because the final waveforms are influenced by this interaction, a complete analysis requires the use of a wider range of stimulus luminance, and so we next examined the luminance dependence of the LP in rats receiving 4.66 × 10⁷ pfu of AdBest, AdBest-W93C, AdBest-R218C, or null vector. This dose was chosen to maximize the effects of the bestrophin mutants based on ANOVA analysis of overall trends in dose–response experiments.
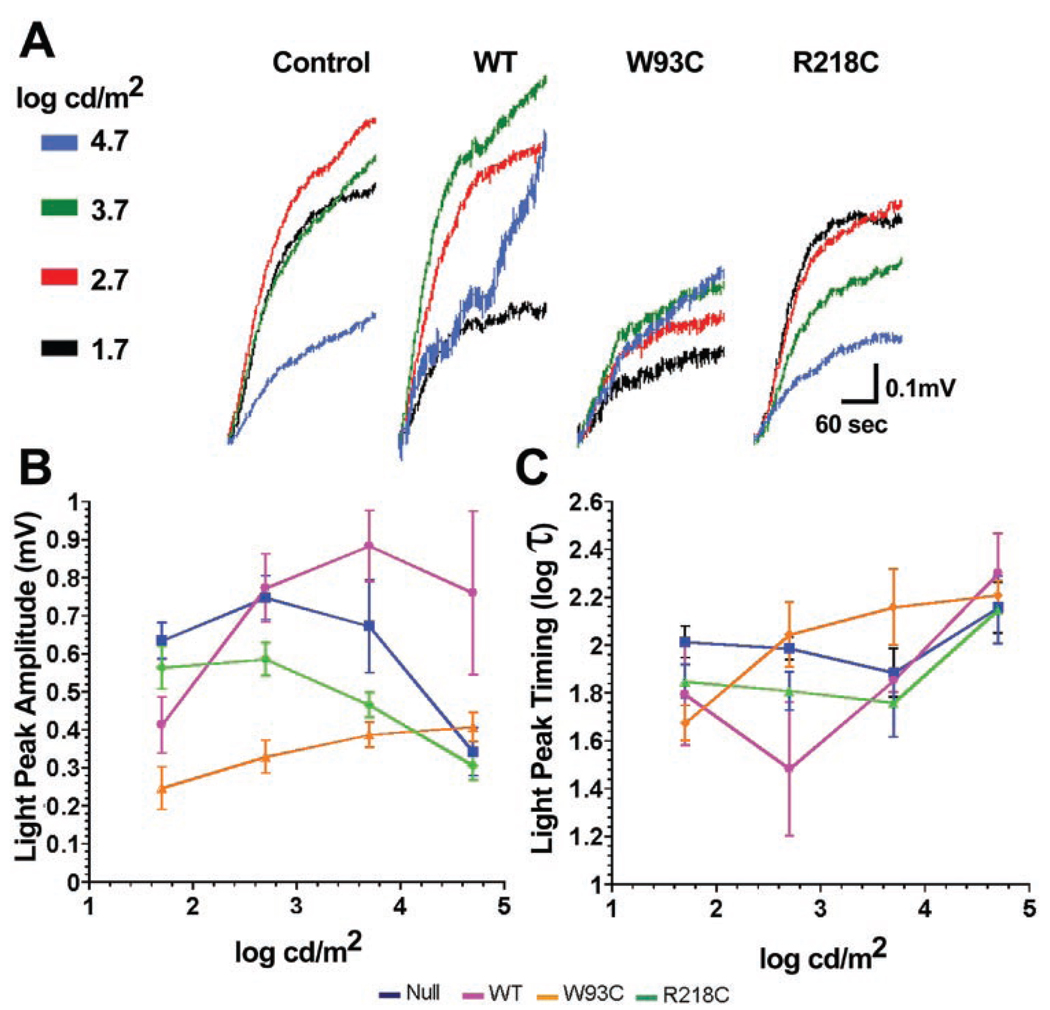
Figure 6A shows mean LPs isolated in each experimental group across the stimulus range of 1.7 to 4.7 log cd/m2. From the waveforms alone, it is obvious that the LPs are smaller in animals expressing bestrophin-W93C or bestrophin-R218C when compared with those recorded from control or wt bestrophin expressors. In comparison to control values, which resemble prior results,22 LP amplitudes (Fig. 6B) were not, as a group, increased in rats overexpressing wt bestrophin, but were significantly smaller in rats receiving either mutant bestrophin (W93C ANOVA, P < 0.0001; R218C ANOVA, P < 0.05). In comparison to the control group, wt bestrophin significantly (ANOVA, P < 0.0001) diminished sensitivity (manifested as a rightward shift in the luminance-response function).
FIGURE 6.
Effect of bestrophin and bestrophin mutants on LP luminance response. RPE-generated ERG components were recorded in response to increasing luminance (color coded as indicated for A) in rats injected subretinally with 4.66 × 10⁷ pfu of replication-defective adenovirus vectors with an empty expression cassette (control) or driving expression of bestrophin (WT) bestrophin-W93C (W93C) or bestrophin-R218C (R218C; see color codes beneath B and C). Mean isolated LPs collected between 110 and 300 seconds were normalized to the 110-second data point (A). (B) Mean LP amplitudes; (C) log τ. Data are the mean ± SE, with 4 ≤ n ≤ 12.
The bestrophin-W93C group exhibited a markedly different luminance response compared with the control (Fig. 6). The luminance-response function (Fig. 6B) for bestrophin-W93C was reduced in amplitude (ANOVA, P < 0.0001) and was shifted to the right on the luminance axis (ANOVA, P < 0.0001) compared with the control, indicating a gross desensitization and spreading of the light-evoked response. In contrast, bestrophin-R218C significantly (P < 0.05) reduced LP amplitude below control levels across the entire stimulus range, though there was no significant change in the position of the response function on the luminance axis.
Examination of log τ (Fig. 6C) across the luminance-response series indicated that the decrease observed in the dose-response series for wt bestrophin and bestrophin-R218C occurred only at lower stimulus levels (1.7–2.7 log cd/m2). This was significant (P < 0.0001) for the individual values at the two lowest luminance levels only for wt-bestrophin, and the overall function for log τ did not differ significantly from control (ANOVA, P < 0.0531) with wt bestrophin or bestrophin R218C. For bestrophin-W93C, log τ values were lower than the control at the lowest stimulus luminance, but progressively increased with increasing stimulus luminance. This trend, however, was not significantly different (ANOVA, P < 0.0771) from the control group and may be due to the similarity of log τ in the control, wt bestrophin, and bestrophin-R218C groups at the two highest luminance levels. For these experimental groups, the increase in log τ at higher stimulus levels may reflect a saturation of the response combined with merging of components to produce smaller and slower responses.
DISCUSSION
In this work, we report the production of an acute animal model of BMD. This model faithfully recreates the diminished LP response in the absence of a-wave, b-wave, and FO abnormalities that is the only fully penetrant symptom of BMD and that differentiates BMD from other vitelliform dystrophies. 8,26,27 We also examined the effects of overexpression of wt bestrophin. Effects of bestrophin and bestrophin mutants on the various RPE-generated components of the ERG are discussed.
Interpretation of the data reported herein requires an understanding of the relationships between the c-wave, FO, and LP. The c-wave and FO are generated by a distinct mechanism from the LP (reviewed in Ref. 13), but the amplitude of the c-wave has been shown to be linked to the amplitude of the LP.28 The c-wave represents a hyperpolarization of the RPE apical plasma membrane in response to a transient decrease in [K+] in the subretinal space. In an elegant series of experiments, Linsenmeier and Steinberg28 superimposed c-waves over the FO and LP in the cat. The c-waves were greatest in amplitude at the peak of the LP and smallest in the FO trough. Linsenmeier and Steinberg28 proposed that this effect was related to changes in the basal membrane resistance (Rba) with the c-wave appearing larger when Rba was decreased during the LP. The FO, which represents a hyperpolarization of the RPE basal membrane results from the slowed apical absorption of Cl by the Na/K/2Cl cotransporter and concomitant decrease in ECl. In contrast, the LP is generated by an unknown molecular signal, the LP substance, which is thought to be secreted by photoreceptors and triggers a depolarization of the RPE basal membrane due to an increased Cl conductance. It is thought that this conductance may be sensitive to Ca2+, since Ca2+-dependent stimulation of basal membrane Cl conductances by adenosine triphosphate (ATP) mimics the LP response. 29
The effects of bestrophin mutants on the DC-ERG were essentially confined to the LP, because significant changes in the c-wave and FO were not observed in animals overexpressing bestrophin mutants, with the exception of a decrease in the c-wave amplitude in rats receiving 1.46 × 10⁶ pfu of AdBest-W93C (Fig. 5). The single dose in which a depressed c-wave was observed is consistent with data reported by Nilsson and Skoog30 who observed depressed c-waves under certain stimulus conditions in a cohort of six patients with BMD.
The apparent increase in the FO in animals overexpressing bestrophin-R218C was not significantly different from the control (see Fig. 5). For bestrophin mutants, this is consistent with previously published reports that found no significant changes in FO in patients with BMD.27
Significantly, when we overexpressed wt-bestrophin, we observed a desensitizing shift in the LP response, but no increase in the response range of the LP. The two bestrophin mutants affected luminance response differently from wt bestrophin, and from each other. With regard to LP amplitude, the changes observed are consistent with those typically observed in patients exhibiting BMD8,9 and, for bestrophin-W93C, included changes in LP timing similar to those reported by Weleber27 in patients with BMD. However, W93C appears to diminish the LP to a greater extent than R218C. Clinically, Caldwell et al.,31 found Arden ratios of 1.5 and 1.75 in the eyes of a 59-year-old carrier of the R218C mutation, who exhibited no other clinical symptoms of BMD. In contrast all other individuals in the study with VMD2 mutations (including W93C) exhibited Arden ratios of less than 1.6 bilaterally. These patient data support the possibility that the effects of R218C may indeed be less severe than those of other mutations. In the clinic, the EOG is usually performed at a standard luminance level.32 Our data suggest that generation of EOG luminance-response curves could point to specific genotype/phenotype correlations that to date have been overlooked. Because BMD-associated mutations cluster into four regions of the protein, 33,34 it is likely that each region exerts a different effect on luminance response. These changes may provide clues to the functional domains within bestrophin and to the role of bestrophin in generating or regulating the LP.
Sun et al.,14 have proposed that bestrophin functions as a Ca2+-sensitive Cl channel that generates the LP. According to their hypothesis, BMD results from a loss of channel activity due to mutations in bestrophin. The dominant inheritance pattern of the disease is hypothesized to result from the formation of bestrophin tetramers or higher order oligomers containing inactive subunits. In our study, overexpression of mutant bestrophin reduced LP amplitude significantly, but neither mutant abolished the LP. Because it is likely that the FO would return to baseline on its own, this could account for some of the residual LP observed in animals overexpressing bestrophin mutants; however, it is clear that we did not completely eliminate the LP. It is possible that human bestrophin does not efficiently form oligomers with the endogenous rat bestrophin, this would account for the remaining LP and the dose-response changes in animals overexpressing bestrophin-W93C.
The Cl channel model proposed by Sun et al.,14 suggests that bestrophin generates the LP due to its channel activity and that BMD results from a loss of this activity, resulting in a reduced LP. Based on this model we expected that overexpression of wt bestrophin would result in an increase in LP amplitude across the entire luminance-response range. We did not find this to be the case. Instead, we found that the LP luminance response was desensitized but that the range of response amplitudes did not differ significantly from the control. It is possible that the rate-limiting step for generating the LP occurs before the activation of bestrophin Cl channels and that channel open time is reduced proportionate to the dilution of a putative secondary messenger. Alternatively, the number of open bestrophin channels in the resting state could be greater. This may explain the increase in amplitude of the c-wave and FO which, as stated earlier, is dependent on the resistance of the basolateral plasma membrane. An alternative explanation is that bestrophin does not itself generate the LP conductance, but instead is an intermediate in the pathway that generates the LP. A hypothesis that would also be consistent with the data obtained from animals overexpressing bestrophin mutants. Future studies examining the phenotype of a bestrophin knockout mouse will be required to answer these questions.
In summary, we have produced a model for BMD using adenovirus-based in vivo gene transfer. The model exhibits all the electrophysiological properties of BMD and suggests interesting genotype/phenotype correlations similar to those reported in humans. The effects of wt bestrophin overexpression on LP timing and luminance response suggest that bestrophin’s role in generating/regulating the LP is more complex than previously recognized.
Acknowledgments
The authors are grateful to Daniel Chung and Ronald Dandy for performing subretinal injections and fundus examinations in the experimental animals.
Supported by National Eye Institute Grants EY13160 (ADM), EY13847 (LYM), EY14465 (NSP), the Medical Research Service, Department of Veterans Affairs (NSP), the Swedish Medical Research Council and Swedish Society for Medical Research (BB, CW), Synfräjandets Research Foundation (BB), and an unrestricted grant from Research to Prevent Blindness to the Department of Ophthalmology, University of Arizona.
Footnotes
Disclosure: A.D. Marmorstein, None; J.B. Stanton, None; J. Yocom, None; B. Bakall, (P); M.T. Schiavone, None; C. Wadelius, (P); L.Y. Marmorstein, None; N.S. Peachey, None
References
- 1.Marquardt A, Stohr H, Passmore LA, Kramer F, Rivera A, Weber BH. Mutations in a novel gene, VMD2, encoding a protein of unknown properties cause juvenile-onset vitelliform macular dystrophy (Best’s disease) Hum Mol Genet. 1998;7:1517–1525. doi: 10.1093/hmg/7.9.1517. [DOI] [PubMed] [Google Scholar]
- 2.Petrukhin K, Koisti MJ, Bakall B, et al. Identification of the gene responsible for Best macular dystrophy. Nat Genet. 1998;19:241–247. doi: 10.1038/915. [DOI] [PubMed] [Google Scholar]
- 3.Godel V, Chaine G, Regenbogen L, Coscas G. Best’s vitelliform macular dystrophy. Acta Ophthalmol Suppl. 1986;175:1–31. [PubMed] [Google Scholar]
- 4.Marmorstein AD, Marmorstein LY, Rayborn M, Wang X, Hollyfield JG, Petrukhin K. Bestrophin, the product of the Best vitelliform macular dystrophy gene (VMD2), localizes to the basolateral plasma membrane of the retinal pigment epithelium. Proc Natl Acad Sci USA. 2000;97:12758–12763. doi: 10.1073/pnas.220402097. [DOI] [PMC free article] [PubMed] [Google Scholar]
- 5.Stohr H, Marquardt A, Nanda I, Schmid M, Weber BH. Three novel human VMD2-like genes are members of the evolutionary highly conserved RFP-TM family. Eur J Hum Genet. 2002;10:281–284. doi: 10.1038/sj.ejhg.5200796. [DOI] [PubMed] [Google Scholar]
- 6.Gass DJM. Heredodystrophic disorders affecting the pigment epithelium and retina. In: Gass DJM, editor. Stereoscopic Atlas of Macular Diseases, Diagnosis and Treatment. Vol 1. St. Louis: Mosby; 1997. pp. 303–313. [Google Scholar]
- 7.Marmor MF, Small K. Dystrophies of the retinal pigment epithelium. In: Wolfensberger MF, Ma TJ, editors. The Retinal Pigment Epithelium. New York: Oxford University Press; 1998. pp. 330–333. [Google Scholar]
- 8.Cross HE, Bard L. Electro-oculography in Best’s muscular dystrophy. Am J Ophthalmol. 1974;77:46–50. doi: 10.1016/0002-9394(74)90603-5. [DOI] [PubMed] [Google Scholar]
- 9.Deutman AF. Electro-oculography in families with vitelliform dystrophy of the fovea. Br J Ophthalmol. 1969;81:305–316. doi: 10.1001/archopht.1969.00990010307001. [DOI] [PubMed] [Google Scholar]
- 10.Steinberg RH, Linsenmeier RA, Griff ER. Retinal pigment epithelial cell contributions to the electroretinogram and electrooculogram. In: Osborne NN, Chader GJ, editors. Progress in Retinal Research. Vol. 4. Oxford, UK: Pergamon Press; 1985. pp. 33–66. [Google Scholar]
- 11.Gallemore RP, Steinberg RH. Light-evoked modulation of basolateral membrane Cl-conductance in chick retinal pigment epithelium: the light peak and fast oscillation. J Neurophysiol. 1993;70:1669–1680. doi: 10.1152/jn.1993.70.4.1669. [DOI] [PubMed] [Google Scholar]
- 12.Gallemore RP, Steinberg RH. Effects of DIDS on the chick retinal pigment epithelium. II. Mechanism of the light peak and other responses originating at the basal membrane. J Neurosci. 1989;9:1977–1984. doi: 10.1523/JNEUROSCI.09-06-01977.1989. [DOI] [PMC free article] [PubMed] [Google Scholar]
- 13.Gallemore RP, Hughes BA, Miller SS. Light-induced responses of the retinal pigment epithelium. In: Marmor MF, Wolfensberger TJ, editors. The Retinal Pigment Epithelium. New York: Oxford University Press; 1998. pp. 175–198. [Google Scholar]
- 14.Sun H, Tsunenari T, Yau KW, Nathans J. The vitelliform macular dystrophy protein defines a new family of chloride channels. Proc Natl Acad Sci USA. 2002;99:4008–4013. doi: 10.1073/pnas.052692999. [DOI] [PMC free article] [PubMed] [Google Scholar]
- 15.Tsunenari TSH, Williams J, Cahill H, Smallwood P, Yau KW, Nathans J. Structure-function analysis of the bestrophin family of anion channels. J Biol Chem. 2003;278:41114–41125. doi: 10.1074/jbc.M306150200. [DOI] [PMC free article] [PubMed] [Google Scholar]
- 16.Qu ZWR, Mann W, Hartzell HC. Two bestrophins cloned from Xenopus laevis Oocytes express ca-activated Cl currents. J Biol Chem. 2003;278:49563–49572. doi: 10.1074/jbc.M308414200. [DOI] [PubMed] [Google Scholar]
- 17.Hardy S, Kitamura M, Harris-Stansil T, Dai Y, Phipps ML. Construction of adenovirus vectors through Cre-lox recombination. J Virol. 1997;71:1842–1849. doi: 10.1128/jvi.71.3.1842-1849.1997. [DOI] [PMC free article] [PubMed] [Google Scholar]
- 18.Spector DL, Goldman RD, Leinwand LA, editors. Cells: A Laboratory Manual. Vol. 2. Plainview, NY: Cold Spring Harbor Press; 1998. [Google Scholar]
- 19.Marmorstein AD, Gan YC, Bonilha VL, Finnemann SC, Csaky KG, Rodriguez-Boulan E. Apical polarity of N-CAM and EMMPRIN in retinal pigment epithelium resulting from suppression of basolateral signal recognition. J Cell Biol. 1998;142:697–710. doi: 10.1083/jcb.142.3.697. [DOI] [PMC free article] [PubMed] [Google Scholar]
- 20.Marmorstein AD, Peachey NS, Csaky KG. In vivo gene transfer as a means to study the physiology and morphogenesis of the retinal pigment epithelium in the rat. Methods. 2003;30:277–285. doi: 10.1016/s1046-2023(03)00034-3. [DOI] [PubMed] [Google Scholar]
- 21.Peachey NS, Alexander KR, Fishman GA. The luminance-response function of the dark-adapted human electroretinogram. Vision Res. 1989;29:263–270. doi: 10.1016/0042-6989(89)90075-8. [DOI] [PubMed] [Google Scholar]
- 22.Peachey NS, Stanton JB, Marmorstein AD. Response characteristics of the rat DC-electroretinogram. Vis Neurosci. 2002;19:693–701. doi: 10.1017/s0952523802196015. [DOI] [PubMed] [Google Scholar]
- 23.Bakall B, Marmorstein LY, Hoppe G, Peachey NS, Wadelius C, Marmorstein AD. Expression and localization of bestrophin during normal mouse development. Invest Ophthalmol Vis Sci. 2003;44:3622–3628. doi: 10.1167/iovs.03-0030. [DOI] [PubMed] [Google Scholar]
- 24.Hoppe G, Marmorstein LY, Marmorstein AD. Localization and functional analysis of bestrophin. In: Andersen RG, La Vail MM, Hollyfield JG, editors. New Insights into Retinal Degenerative Diseases. New York: Kluwer Academic/Plenum Publishers; 2001. pp. 207–216. [Google Scholar]
- 25.Linsenmeier RA, Steinberg RH. Origin and sensitivity of the light peak in the intact cat eye. J Physiol. 1982;331:653–673. doi: 10.1113/jphysiol.1982.sp014396. [DOI] [PMC free article] [PubMed] [Google Scholar]
- 26.Blodi CF, Stone EM. Best’s vitelliform dystrophy. Ophthalmic Paediatr Genet. 1990;11:49–59. [PubMed] [Google Scholar]
- 27.Weleber RG. Fast and slow oscillations of the electro-oculogram in Best’s macular dystrophy and retinitis pigmentosa. Arch Ophthalmol. 1989;107:530–537. doi: 10.1001/archopht.1989.01070010544028. [DOI] [PubMed] [Google Scholar]
- 28.Linsenmeier RA, Steinberg RH. A light-evoked interaction of apical and basal membranes of retinal pigment epithelium: c-wave and light peak. J Neurophysiol. 1983;50:136–147. doi: 10.1152/jn.1983.50.1.136. [DOI] [PubMed] [Google Scholar]
- 29.Peterson WM, Meggyesy C, Yu K, Miller SS. Extracellular ATP activates calcium signaling, ion, and fluid transport in retinal pigment epithelium. J Neurosci. 1997;17:2324–2337. doi: 10.1523/JNEUROSCI.17-07-02324.1997. [DOI] [PMC free article] [PubMed] [Google Scholar]
- 30.Nilsson SE, Skoog KO. The ERG c-wave in vitelliruptive macular degeneration (VMD) Acta Ophthalmol (Copenh) 1980;58:659–666. doi: 10.1111/j.1755-3768.1980.tb08309.x. [DOI] [PubMed] [Google Scholar]
- 31.Caldwell GM, Kakuk LE, Griesinger IB, et al. Bestrophin gene mutations in patients with Best vitelliform macular dystrophy. Genomics. 1999;58:98–101. doi: 10.1006/geno.1999.5808. [DOI] [PubMed] [Google Scholar]
- 32.Marmor MF, Zrenner E. Standard for clinical electro-oculography. Doc Ophthalmol. 1993;85:115–124. doi: 10.1007/BF01371127. [DOI] [PubMed] [Google Scholar]
- 33.Bakall B, Marknell T, Ingvast S, et al. The mutation spectrum of the bestrophin protein–functional implications. Hum Genet. 1999;104:383–389. doi: 10.1007/s004390050972. [DOI] [PubMed] [Google Scholar]
- 34.White K, Marquardt A, Weber BH. VMD2 mutations in vitelliform macular dystrophy (Best disease) and other maculopathies. Hum Mutat. 2000;15:301–308. doi: 10.1002/(SICI)1098-1004(200004)15:4<301::AID-HUMU1>3.0.CO;2-N. [DOI] [PubMed] [Google Scholar]


