

Abstract
The genetic and environmental sources of variance in mothers’ and fathers’ ratings of child temperament in middle childhood were estimated and compared. Parents of 88 MZ twin pairs and 109 same-sex DZ twin pairs completed a temperament questionnaire. For Effortful Control, significant genetic and environmental effects were indicated across mothers’ and fathers’ ratings, but parent differences were found for the Negative Affectivity factor. When present, sibling contrast effects were not consistent for mothers and fathers. Parental ratings of the Effortful Control factor were best explained by the Biometric model whereas the Negative Affectivity factor was best explained by the Rater Bias model. Overall, mothers’ and fathers’ ratings yielded similar evidence of genetic and environmental etiology of temperament in middle childhood.
Keywords: Temperament, Parental ratings, Genetic effects, Environmental effects, Sibling contrast effects
1. Introduction
Individual differences in child temperament arise from complex genetic and environmental processes. Behavior genetic methods can provide basic information about these processes. Moderate genetic effects have been indicated for a wide array of temperamental aspects from infancy to early childhood, but less is known about these processes in middle childhood or about potential differences in mothers’ and fathers’ ratings of child behavior. The goal of the current project was to use the twin design to estimate and compare genetic and environmental variance components of temperament based on parents’ ratings, and to test for potential rater bias and sibling contrast effects.
Temperament refers to individual differences in reactivity and self-regulatory processes that are relatively stable and appear early in infancy (Goldsmith et al., 1987). Moreover, temperament encompasses the individual’s biological framework, in the context of hereditary and experiential processes over the course of development (Rothbart & Bates, 1998). Genetic and environmental influences on temperament in infancy and early childhood (up to 5 years of age) have been examined extensively. Twin studies consistently have indicated modest to moderate heritability (20–60%) on a wide array of temperament attributes including negative emotionality, activity level, shyness, distress, positive affect, negative affect, effortful control, and behavioral inhibition (Buss & Plomin, 1984; Cherny, Fulker, Corley, Plomin, & DeFries, 1994; Cyphers, Phillips, Fulker, & Mrazek, 1990; Goldsmith, Buss, & Lemery, 1997; Robinson, Kagan, Reznick, & Corley, 2004; Saudino & Cherny, 2001; Stevenson & Fielding, 1985). However, negligible heritability has been indicated for attributes such as soothability, adaptability, and sociability in infancy (Goldsmith, Lemery, Buss, & Campos, 1999; Silberg et al., 2005) and positive affect in the toddler and preschooler years (Goldsmith et al., 1997).
By comparison, there has been relatively little exploration of temperament in middle childhood. The handful of investigations that have been conducted—like the work in infancy and early childhood—point to moderate genetic variance. Matheny and Dolan (1980) reported intra-class correlations for 7–10 year old MZ twins (.45–.66) that were significantly greater than those of DZ twins (−.11 to .19), with respect to sociability, negative emotionality, and activity–distractibility. Other than this study, nearly all others in middle childhood have been adoption designs, and the results are mixed. The adoption studies have shown evidence of genetic variance in emotionality, activity level, and sociability in middle childhood for teachers’ and testers’ reports but not for parents’ reports (Loehlin & Horn, 1981; Schmitz, 1994; Schmitz, Saudino, Plomin, Fulker, & DeFries, 1996). Given the paucity of studies in middle childhood and the apparent discordance in findings in the adoption studies in middle childhood compared to findings from twin studies in early childhood, our first aim was to use a twin design to estimate genetic and environmental sources of variance in temperament in middle childhood.
The discrepancy in variance estimates obtained from adoption and twin studies is an interesting caveat in the study of individual differences in temperament. One possible explanation for this lack of convergence between designs is non-additive genetic variance. This interaction between genes is shared completely among MZ twins but to a lesser degree by parent and offspring and siblings. Therefore, if non-additive genetic variance is substantial, genetic influences will be found in twin studies, but not adoption parent–offspring or sibling designs where the non-additive genetic variance plays a smaller role (Schmitz et al., 1996). Another potential contributing factor is that for twin designs, there may be a specific form of parental rating bias which results in exaggerated comparisons of twins resulting in near zero or negative sibling correlations—especially for DZ twins (i.e., sibling contrast effect;Saudino, 2003). For example, when a sibling pair is compared to other children, both may be high in sociability. However, if one sibling is slightly more sociable than the other, because parents are comparing the siblings to each other instead of other children, the parents’ rating may inflate a relatively small difference causing the siblings to be rated much less similarly than they should be. This sibling contrast effect does not typically occur when parents rate monozygotic twins because they are usually much more similar to each other; therefore, when contrast effects occur in a twin design, monozygotic twin correlations are unaffected while dizygotic twin correlations are artifactually attenuated. Although sibling contrast effects have been indicated for aspects of temperament during early childhood (Saudino, Cherny, & Plomin, 2000), whether and how these effects operate for mother and father ratings for school-age children is unknown. Identifying such potential effects was our second aim.
Another methodological question arises regarding informants. Most prior studies of temperament have relied on maternal reports of child behavior. In those studies in which fathers’ ratings were collected, typically their reports were averaged with mothers’ reports rather than being analyzed separately. Mothers’ and fathers’ reports show modest to moderate agreement, depending on the study and temperament dimension in question (Field & Greenberg, 1982; Lyon & Plomin, 1981; Saudino, McGuire, Reiss, Hetherington, & Plomin, 1995). No study has shown evidence of substantial agreement (i.e., correlations > .6), suggesting that mothers and fathers may have different perspectives or different experiences with their children’s behaviors—and their ratings may yield similar or different pictures regarding genetic and environmental variance. To address this question, in the current study we used mothers’ and fathers’ ratings to examine two contrasting models developed to disentangle reliable effects from potential rating biases specific to mothers’ and fathers’ reports.
In sum, the goal of the current study was to extend the extant literature by estimating genetic, shared environmental, and non-shared environmental variance components in temperament in middle childhood using the most recently developed instrument, the Child Behavior Questionnaire—Short Form (Putnam & Rothbart, 2006). Based on the findings from twin studies of temperament in infancy and early childhood, we anticipated finding evidence of moderate genetic and non-shared environmental sources of variance, and only modest shared environmental variance (Buss & Plomin, 1984; Goldsmith et al., 1997). We also tested for the presence of sibling contrast and parent rating bias effects in a series of models.
2. Method
2.1. Participants
Participants included 88 MZ twin pairs (60% female) and 109 same-sex DZ twin pairs (52% female) and their parents from the Western Reserve Reading Project (WRRP), a longitudinal behavioral genetic study of environmental influences on the development of reading and other cognitive skills (see Petrill, Deater-Deckard, Thompson, DeThorne, & Schatschneider, 2006, for a detailed description of the study). Nearly all families were two-parent households (6% single mothers) and the majority was White (92%). On average, mothers were 37.87 years old (SD = 4.95) and fathers were 39.56 (SD = 5.78). Mothers’ and fathers’ education levels were similar: 10–13% high school or less, 22–23% some college or associates degree, 33–36% bachelor’s degree, 6–8% some post-graduate education, 20% post-graduate degree, and 4% not specified. Cheek swabs were taken to determine zygosity using DNA analysis. The majority (~90%) of the parents consented to the genotyping. However, for the minority of cases where parents did not consent to genotyping, zygosity was determined using a highly reliable parent questionnaire on twins’ physical similarity (Goldsmith, 1991). Within each twin pair, the twins were randomly designated as twin 1 or twin 2 in the following analyses.
Children were included in the sample when CBQ-SF data were available from either parent. Complete mother-rated CBQ-SF data were available for 88 MZ pairs and 109 DZ pairs and complete father-rated CBQ-SF data were available for 44 MZ twin pairs and 54 DZ twin pairs. Approximately half of the fathers in the current sample did not complete the CBQ-SF, however, there were no significant differences overall for those fathers who completed the temperament ratings and those who did not complete the ratings for fathers’ age, education, ratings of children’s problem behaviors (externalizing, internalizing), or negative and positive feelings toward their children (Pillai’s trace = .07; F(14, 76), p = .98). Likewise, there was no evidence of systematic effects of fathers response or non-response on the CBQ-SF on mothers’ ratings of child temperament (Pillai’s trace = .10; F(30, 174), p = .90).
2.2. Procedure
Parents were participants in an on-going longitudinal study that includes annual home visits. Following the second annual home visit, all participating parents were invited to complete a supplemental questionnaire by mail that included ratings of each twin’s temperament. The timing of the supplemental questionnaire was not systematic. On average, the parent questionnaire was completed 11 months after the second home visit.
2.3. Measures
Temperament in middle childhood was assessed using the Child Behavior Questionnaire—Short Form (CBQ-SF, Putnam & Rothbart, 2006). Parents indicated how accurate a particular statement was for each twin separately on a 7-point scale ranging from “extremely true” to “extremely untrue” of each child. The CBQ-SF measures Surgency (Impulsivity, High-Intensity Pleasure, activity level, Shyness [reversed]), Negative Affectivity (Fear, Anger, Sadness, Discomfort, Soothability [reversed]), and Effortful Control (Attentional Focusing, Inhibitory Control, Low-Intensity Pleasure, Perceptual Sensitivity). Two additional temperament facets, Approach and Smiling/Laughter are also measured. In the current sample, Cronbach’s alphas ranged from .60 to .87 for the 15 temperament facets.
Because the measure is so new, we examined the factor structure in these data to see if we could replicate the published structure for the CBQ-SF. We conducted maximum likelihood factor analysis with direct oblimin rotation, using the 13 subscales that comprise the three factors in the published CBQ-SF solution. We forced a three-factor solution without otherwise constraining the model. We conducted this analysis four times, once each for mother or father ratings of both twins. Although there were some variations in the order in which factors were extracted, the overall pattern replicated the published solution. In all four analyses, the anticipated three factors were obtained from the expected subscales for each factor; factor loadings in the pattern and structure matrices were very similar. Detailed results of the factor solutions are available from the first author.
2.4. Data analysis
We decomposed the measured phenotypic variation into latent genetic and environmental components by comparing phenotypic similarity among pairs of individuals (e.g., twins) as a function of genetic relatedness. This yields variance estimates that represent the relative contribution of genetic and environmental effects to the observed phenotypic variation. Competing models were tested and the best fitting models were selected using Akaike’s Information Criterion (AIC; Burnham & Anderson, 1998) and the Root Means Square Error of Approximation (RMSEA). The model with the lowest AIC value is considered to be the best fitting model, and a RMSEA of .10 is considered an adequate fit and a value equal to or below .06 is considered a very good fit (Hu & Bentler, 1999; Steiger, 1989). All models were fit to twin variance/covariance matrices using Mx (Neale, 1997) maximum likelihood model-fitting procedures.
The “ACE” model was used to estimate the proportion of variance attributable to additive genetic effects (A), shared environment effects (C), and non-shared environment effects (E). In the ACE model, the additive genetic path (A) is set to 1.0 for MZ twin pairs (share 100% of their segregating genes) and to 0.50 for DZ twin pairs (share 50% of their segregating genes). The shared environmental path (C) is set to 1.0 for both MZ and DZ twin pairs because they share 100% of their common environment (e.g., shared parenting behavior, attending the same school). The non-shared environmental path (E) refers to those experiences that are unique to each twin (e.g., accidents, different friends) and includes any variance due to error.
When there was evidence of potential non-additive genetic effects (i.e., DZ twin correlations were close to zero or negative), we also estimated models to test for genetic dominance and sibling contrast effects. The non-additive genetic model (ADE model) was examined which is similar to the ACE model with the exception of the estimation of non-additive genetic effects (D) which is substituted for shared environmental effects (C). This change is necessary because based on the basic twin design shared environmental effects and non-additive effects are confounded and therefore cannot be estimated within the same model. In addition, the non-additive genetic path (D) is set to 1.0 for MZ twin pairs (share 100% of their segregating genes) and to .25 for DZ twin pairs (share only a quarter of genetic variation due to dominance). Next, the sibling interaction model (Fig. 1; ACE + b model) was fit to evaluate potential contrast effects. In this model which is also a modification of the ACE model, the critical feature is the added interaction path (b) which implies an interaction between the observed phenotypes. Therefore, each twin’s phenotype is a function of both genetic and environmental effects, and the phenotype of his or her co-twin. By including this additional interaction path (b), we can test whether parents’ rating of one twin’s phenotype is influencing their rating of the other twin therefore using one twin as a metric by which to rate the co-twin’s behavior (Neale & Stevenson, 1989). Given that it also is possible that both sibling contrast effects and non-additive genetic variance could be operating, an alternative non-additive genetic sibling contrast model (ADE + b) also was examined.
Fig. 1.
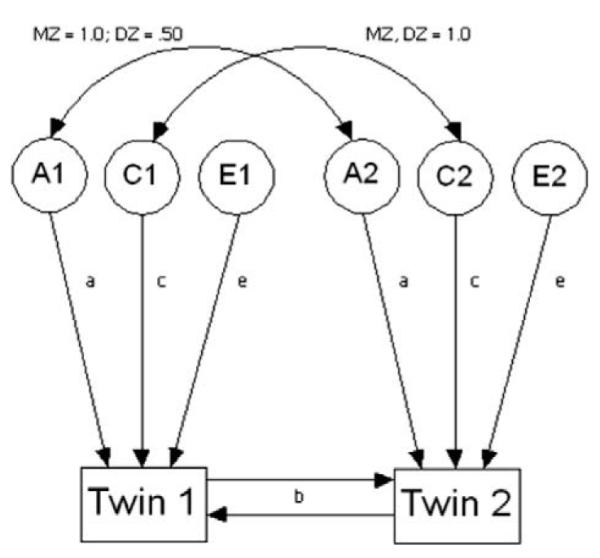
Sibling interaction model. Twins 1 and 2 are measured temperamental phenotypes for the two twins (e.g., shyness). A, C, E, are latent variables that represent additive genetic influence, shared environmental influence, and non-shared environmental influences, respectively. The curved two-headed arrows represent correlations between the variables they connect. The single-headed arrows a, c, e represents the additive genetic parameter, the shared environmental parameter, and the non-shared environmental parameter, respectively. The b interaction paths refer to the phenotypic interaction or contrast between each twin’s phenotype.
To examine potential rater biases, mother and father data were examined simultaneously using the Biometric, Psychometric, and Rater Bias models. First, we examined the Biometric model (Fig. 2; also called a Cholesky or triangular decomposition). This model is viewed as a psychologically less informative rotation of the Psychometric model (Hewitt, Silberg, Neale, Eaves, & Erickson, 1992). The model serves as a baseline and assumes that parents are assessing only unique aspects of the child’s behavior that are correlated for unspecified reasons. If this model fits well it suggests that parents are not assessing the same phenotype. This model is appropriate when mothers and fathers only report on those behaviors observed in distinct situations, or if they do not share a common understanding of the behavioral indicators. In the Psychometric model (Fig. 3) it is possible to partition the variance in informants’ ratings (e.g., mothers and fathers) into their components due to trait variance shared across the raters and the trait variance unique to each specific rater. Thus, this model represents behavioral indicators of temperament agreed upon across informants. The last model examined was the Rater Bias model (Fig. 4). This model posits that a reliable, common behavioral view across informants is influenced by a common set of genetic and environmental factors. The remaining variance is accounted for by unreliability which is further partitioned into a rater-bias component (informant’s tendency to consistently overestimate or underestimate scores) and a measurement-error component (unreliability due to measurement error).
Fig. 2.

A bivariate Cholesky decomposition was used to partition the variances of, and covariances between, mothers’ reports and fathers’ reports into genetic and non-genetic components. Separate models were estimated for Effortful Control, Negative Affectivity, and Surgency/Extraversion factors. Latent variables represent overlapping additive genetic effects (A), additive shared environment effects (C), and additive non-shared environment effects including error (E), as well as residual genetic (a), shared environmental (c), and non-shared environmental (e) variance. In this model, the pathways between latent variables representing genetic variance and covariance across twins are set at 1 for monozygotic (MZ, identical) twins and .5 for dizygotic (DZ, fraternal) twins. The pathways for shared environmental variance and covariance across twins are set at 1 for MZ and DZ twins, whereas the pathways for non-shared environmental variance and covariance across twins are set at 0 for MZ and DZ twins.
Fig. 3.

The psychometric model for child temperament based on mothers’ and fathers’ reports. Measured variables are represented by triangles and latent variables by circles. The upper part of the model (above the measured variables) contains a common factor of child temperament which captures the shared variance between mothers and fathers. A1, C1, and E1 (where 1 stands for twin 1) are the genetic and environmental estimates for this common factor. Double-headed paths represent the correlations between the additive genetic variance (MZ = 1.0; DZ = .50) and shared environmental variance (MZ/DZ = 1.0). The lower part of the model (below the measured variables) contains the effects on the variance that is unique to each rater: unique genetic variance (Am1 for mothers’ report), unique shared environment (Cm1), and unique non-shared environment (Em1). The paths representing the factor loadings for each of the informants on the common factor were fixed to one for model identification.
Fig. 4.

The Rater Bias model for child temperament according to mothers’ and fathers’ reports. The same convention as for the psychometric model is used in the Rater Bias model with the difference being in the lower part of the model. The set of unique estimates is composed of the rater bias estimates (e.g., bm where m stands for mothers’ report) and their corresponding residuals (e.g., M1). The single-headed paths (e.g., bm and bf) are the effects of the rater bias and the residuals estimates on the measured variables.
3. Results
Descriptive statistics of the study variables are shown in Table 1. Scores were normally distributed, showing only modest kurtosis or skew. The exception to this pattern (skewness or kurtosis > 1) was for mothers’ ratings of Smiling for twin 1 (negative skew and high kurtosis, suggesting a ceiling effect).
Table 1.
Sample sizes, means (standard deviations) and comparisons (paired t-tests) and agreement (correlations) for mother (n = 197) and father (n = 98) CBQ factor and sub-scale scores.
| Twin 1 |
Twin 2 |
|||||
|---|---|---|---|---|---|---|
| Mother | Father | r | Mother | Father | r | |
| Effortful Control | 5.36 (.59) | 5.13 (.63)* | .60 | 5.30 (.67) | 5.13 (.62)* | .62 |
| Attentional Focusing | 5.06 (.92) | 4.97 (.80)* | .66 | 4.98 (1.04) | 4.88 (.86) | .59 |
| Inhibitory Control | 5.13 (.87) | 4.87 (.86)* | .49 | 5.09 (.89) | 4.85 (.93)* | .57 |
| Low-Intensity Pleasure | 5.76 (.73) | 5.53 (.77)* | .52 | 5.78 (.77) | 5.59 (.69) | .42 |
| Perceptual Sensitivity | 5.48 (.83) | 5.14 (.90)* | .55 | 5.37 (.93) | 5.20 (.82)* | .38 |
| Surgency | 4.46 (.73) | 4.44 (.63) | .65 | 4.44 (.87) | 4.45 (.71) | .75 |
| Activity | 4.56 (.93) | 4.61 (.82) | .59 | 4.52 (1.03) | 4.65 (.88)* | .61 |
| High-Intensity Pleasure | 4.69 (.98) | 4.61 (.96) | .55 | 4.74 (1.14) | 4.70 (1.02) | .71 |
| Impulsivity | 4.21 (.89) | 4.18 (.83) | .43 | 4.17 (.99) | 4.16 (.86) | .60 |
| Shyness | 3.62 (1.32) | 3.63 (.99) | .60 | 3.66 (1.37) | 3.71 (.98) | .62 |
| Negative affect | 3.79 (.70) | 3.79 (.69) | .31 | 3.98 (.76) | 3.91 (.73) | .39 |
| Anger | 3.73 (1.16) | 3.80 (1.09) | .39 | 3.99 (1.22) | 3.93 (1.15) | .51 |
| Discomfort | 4.01 (1.13) | 4.01 (1.04) | .27 | 4.18 (1.26) | 4.18 (1.08) | .42 |
| Soothability | 4.67 (.95) | 4.54 (.86) | .39 | 4.49 (1.05) | 4.53 (.96) | .50 |
| Fear | 3.61 (1.12) | 3.53 (.99) | .27 | 3.85 (1.28) | 3.76 (1.07) | .34 |
| Sadness | 4.28 (.83) | 4.15 (.80) | .40 | 4.36 (.83) | 4.20 (.77) | .40 |
| Other scales | ||||||
| Approach | 5.16 (.73) | 4.85 (.65)* | .39 | 5.12 (.74) | 4.85 (.77)* | .48 |
| Smiling | 6.01 (.69) | 5.80 (.58)* | .21 | 5.84 (.75) | 5.62 (.70)* | .28 |
Note: all correlations (r) significant, two-tailed p < .05.
The mother–father paired t-test (91 degrees of freedom for each test) was significant, two-tailed p < .01.
We began by exploring potential associations between the temperament scales and factors and child sex (0 = female, 1 = male), age, and twin zygosity (MZ = 1, DZ = 2). For child age, we found only two significant correlations that replicated across twins 1 and 2, for mothers’ ratings—older children were rated lower in Discomfort, r(198) = −.18, p < .05 for twin 1 and r(197) = −.20, p < .01 for twin 2, and lower in Low-Intensity Pleasure, r(198) = −.21, p < .01 for twin 1 and r(197) = −.19, p < .05 for twin 2. There were no significant and replicated (across twins) correlations between child age and temperament scales or factors for fathers’ ratings.
We also explored child sex differences using bivariate Pearson correlations. When using a binary nominal variable like child sex (girls vs. boys) in which the two groups are independent, t-tests of the group means utilize the same estimate of probability as estimation of a correlation—with the latter providing a direct effect size estimate. For mothers’ ratings, there were four significant correlations with child sex that replicated across both twins—boys (coded as ‘1’) were rated lower in Low-Intensity Pleasure, Perceptual Sensitivity, Effortful Control, and Sadness compared to girls (coded as ‘0’); these correlations ranged from −.19 to −.32, p < .05 to .001. Like mothers, fathers also rated boys lower in Low-Intensity Pleasure, Perceptual Sensitivity, and Effortful Control compared to girls (again replicating across twins); these correlations ranged from −.30 to −.44, p < .01 to .001. However, unlike mothers, fathers also rated boys lower than girls in Inhibitory Control and Attentional Focusing; these correlations ranged from −.25 to −.35, p < .05 to .001.
Regarding zygosity, we used independent group t-tests to explore possible means differences for MZ vs. DZ twins. None was found that replicated across twins 1 and 2. There was one noteworthy finding for twin 2 however, because of its consistency across mother and father reports. Parents’ ratings of twin 2 (p < .05, two-tailed) showed that DZ twins were rated higher in Fear (mothers: M = 4.02, SD = 1.28; fathers: M = 4.00, SD = 0.97) compared to MZ twins (mothers: M = 3.66, SD = 1.24; fathers: M = 3.51, SD = 1.06).
To compare mothers’ and fathers’ ratings, we began by testing for mean differences for the 15 subscales and 3 factors (18 paired t-tests) once for twin 1 and again for twin 2, resulting in 36 tests (see Table 1). Because of the number of tests conducted, we used a more conservative p-value of .01 as a threshold for determining significance, and we only interpreted effects that replicated across the twins 1 and 2 sub-samples. Five significant mean differences replicated. Compared to fathers, mothers rated their children higher in Effortful Control (about one-third standard deviation), higher in Inhibitory Control (about one-quarter standard deviation), higher in Perceptual Sensitivity (about one-third to one-quarter standard deviation), higher in Approach/Positive Anticipation (about one-third standard deviation), and higher in Smiling (about onethird standard deviation).
We examined mother–father agreement by estimating bivariate Pearson correlations (see Table 1). Parent agreement was moderate to substantial, with correlations ranging from .21 to .75 depending on the scale and twin in question. Overall, agreement was lowest for Negative Affectivity and its facets (r = .27–.51, average r = .34 for twin 1 and .43 for twin 2), more substantial for Effortful Control and its facets (r = .38–.66, average r = .56 for twin 1 and .52 for twin 2), and highest for Surgency and its facets (r = .43–.75, average r = .56 for twin 1 and .66 for twin 2).
Next, we estimated bivariate Pearson correlations between the three CBQ-SF factors separately for mothers’ and fathers’ ratings for twins 1 and 2. For mothers’ ratings, there was a significant (p < .05) association between higher Effortful Control and lower Surgency that replicated across twin 1 (r = −.17) and 2 (r = −.28). For fathers’ ratings, there was a significant association between higher Effortful Control and lower Negative Affectivity that replicated across twin 1 (r = −.23) and twin 2 (r = −.29). No other correlation was significant. Only one of the four significant correlations was significantly different for mothers and fathers—the correlation between Effortful Control and Negative Affectivity for twin 2 was significantly higher for fathers’ ratings (−.29) compared to mothers’ ratings (−.04, z = −2.12, p < .03).
3.1. Behavioral genetic analyses
Before conducting behavioral genetic modeling, we estimated sibling similarity as a function of zygosity (MZ or DZ) using intra-class correlations (see Table 2). In general, the intra-class correlations for MZ twins were higher than those for DZ twins, although the degree of this difference in correlations depended on the informant and scale or factor in question. In addition, there was evidence of potential non-additive genetic effects or sibling contrast effects (or both)—seen as near zero or negative DZ twin correlations—for some scales, including the Attentional Focusing and Discomfort facets, and all of the facets of the Surgency factor. These apparent sibling contrast effects very likely reflect parent rating biases rather than effects due to sibling interactions (Saudino et al., 2000; Simonoff et al., 1998). Based on the patterns of twin similarity in Table 2, we estimated additive genetic models (ACE) for the Effortful Control and Negative Affectivity factors and facets. For the Surgency/Extraversion factor and facets, we also considered the non-additive genetic model (ADE) and the sibling interaction model.
Table 2.
Monozygotic (MZ) and dizygotic (DZ) twins: number of pairs and intra-class correlations.
| Mother |
Father |
|||
|---|---|---|---|---|
| MZ n = 88 |
DZ n = 109 |
MZ n = 44 |
DZ n = 54 |
|
| Effortful Control | .79 | .43 | .83 | .59 |
| Attentional Focusing | .57 | −.02 ns | .39 | −.19+ |
| Inhibitory Control | .70 | .24 | .84 | .43 |
| Low-Intensity Pleasure | .86 | .66 | .84 | .79 |
| Perceptual Sensitivity | .72 | .56 | .83 | .55 |
| Surgency | .69 | −.19 | .41 | −.51 |
| Activity | .72 | −.19 | .47 | −.39 |
| High-Intensity Pleasure | .75 | .06 ns | .51 | −.26 |
| Impulsivity | .45 | −.13 ns | .07 ns | −.36 |
| Shyness | .59 | .11 ns | .63 | −.02 ns |
| Negative Affectivity | .72 | .34 | .63 | .63 |
| Anger | .81 | .47 | .79 | .50 |
| Discomfort | .47 | .03 ns | .39 | .42 |
| Soothability | .59 | .23 | .57 | .38 |
| Fear | .72 | .47 | .71 | .36 |
| Sadness | .69 | .37 | .64 | .74 |
| Other scales | ||||
| Approach | .80 | .39 | .80 | .35 |
| Smiling | .66 | .41 | .72 | .49 |
Note: all intra-class correlations significant (two-tailed p < .05) unless indicated,
= p < .10 or “ns” = non-significant.
The results from the ACE model for Effortful Control factor (without the Attentional Focusing scale due to possible contrast effects) showed moderate heritability and more modest but still significant non-shared environment for both mothers’ and fathers’ reports (see Table 3). This was largely attributable to the pattern in the Inhibitory Control scale, which had substantial heritability. By comparison to Inhibitory Control, heritability estimates for Low- Intensity Pleasure and Perceptual Sensitivity were lower, and shared environmental variance estimates higher (.31–.71) and typically significant. Thus, the pattern of variance components for Effortful Control depended on the specific subscale in question, but not on rater.
Table 3.
Univariate models for mother (M) and father (F) ratings: percent variance (95% confidence intervals) for genetic (h2), shared environmental (c2), and non-shared environmental (e2) effects, and selected model with fit indices.
| Rater | h2 | c2 | e2 | Model | χ2 (df, p) | AIC | RMSEA | |
|---|---|---|---|---|---|---|---|---|
| Effortful Control | M | .69 (.40-.84) | .10 (.00-.36) | .21 (.16-.30) | ACE | 6.78 (3, .08) | 0.78 | .08 |
| F | .50 (.19-.87) | .34 (.00-.61) | .17 (.10-.27) | ACE | 0.68 (3, .88) | −5.32 | .00 | |
| Attentional Focusing | M | - | - | - | - | - | - | - |
| F | - | - | - | - | - | - | - | |
| Inhibitory Control | M | .69 (.48-.78) | .00 (.00-.16) | .31 (.22-.43) | ACE | 1.88 (3, .60) | −4.12 | .02 |
| F | .70 (.32-.88) | .12 (.00-.47) | .18 (.11-.27) | ACE | 2.05 (3, .56) | −3.95 | .00 | |
| Low-Intensity Pleasure | M | .26 (.08-.48) | .57 (.36-.73) | .16 (.12-.23) | ACE | 9.97 (3, .02) | 3.97 | .12 |
| F | .14 (.00-.39) | .71 (.47-.86) | .15 (.09-.24) | ACE | 4.03 (3, .26) | −1.97 | .08 | |
| Perceptual Sensitivity | M | .41 (.13-.70) | .34 (.07-.56) | .25 (.18-.36) | ACE | 6.26 (3, .12) | 0.26 | .10 |
| F | .52 (.21-.86) | .31 (.00-.60) | .17 (.10-.27) | ACE | 1.74 (3, .63) | −4.26 | .00 | |
| Negative affect | M | .71 (.39-.81) | .02 (.00-.31) | .27 (.19-.37) | ACE | 2.46 (3, .48) | −3.54 | .03 |
| F | .10 (.00-.51) | .57 (.21-74) | .33 (.21-.49) | ACE | 1.16 (3, .76) | −4.84 | .00 | |
| Anger | M | .66 (.41-.87) | .16 (.00-.40) | .17 (.12-.24) | ACE | 0.78 (3, .85) | −5.22 | .00 |
| F | .63 (.26-.87) | .18 (.00-.50) | .19 (.12-.32) | ACE | 1.21 (3, .75) | −4.79 | .00 | |
| Discomfort | M | - | - | - | - | - | - | - |
| F | 00# | .42 (.24-.57) | .58 (.43-.76) | CE | 0.92 (4, .92) | −7.08 | .00 | |
| Soothability | M | .61 (.47-.72) | 00# | .39 (.29-.53) | AE | 5.89 (4, .12) | −2.11 | .06 |
| F | .55 (.35-.70) | 00# | .45 (.30-.65) | AE | 2.14 (4, .71) | −5.87 | .00 | |
| Fear | M | .56 (.27-.81) | .19 (.00-.44) | .25 (.18-.35) | ACE | 7.23 (3, .07) | 1.23 | .11 |
| F | .50 (.02-.79) | .19 (.00-.56) | .31 (.20-.49) | ACE | 3.76 (3, .29) | −2.24 | .07 | |
| Sadness | M | .71 (.38-.79) | .00 (.00-.29) | .29 (.21-.40) | ACE | 4.41 (3, .22) | −1.59 | .06 |
| F | 00# | .71 (.60-.80) | .29 (.20-.40) | CE | 5.37 (4, .25) | −2.63 | .09 | |
| Other scales | ||||||||
| Approach | M | .77 (.69-.83) | 00# | .23 (.17-.31) | AE | 4.32 (4, .37) | −3.69 | .03 |
| F | .78 (.40-.86) | .00 (.00-.35) | .22 (.14-.34) | ACE | 4.69 (3, .20) | −1.31 | .09 | |
| Smiling | M | .48 (.14-.75) | .20 (.00-.47) | .32 (.24-.45) | ACE | 4.11 (3, .25) | −1.90 | .07 |
| F | .57 (.21-.86) | .23 (.00-.53) | .21 (.13-.34) | ACE | 7.21 (3, .07) | 1.21 | .16 |
Note: “-” is shown for those models that were not estimated because of evidence of sibling contrast rating bias (see Table 3). 00# indicates that the parameter was fixed at zero for model-fitting purposes. Selected models refer to estimated effects of A (additive genetic), C (additive shared environment), and E (additive non-shared environment).
The results for Negative Affectivity and its component scales were more complex (see Table 3). Within mothers’ ratings, the findings were consistent. At both the factor (NA) and facet (e.g., Fear, Anger) levels, heritable variance was moderate to substantial (.56–.71), non-shared environmental variance was modest to moderate (.17–.39 range), and shared environmental variance modest (.00–.19). However, father ratings were not consistent across scales. The variance components for father-rated Anger, Soothability, and Fear were similar to those for mothers’ ratings, but father-ratings on the Negative Affectivity factor and the Discomfort and Sadness scales showed negligible heritable variance and moderate shared environmental variance (.57–.71). Thus, unlike Effortful Control, the variance components for Negative Affectivity and its scales depended on informant as well as the particular scale in question.
Examination of the intra-class correlations (Table 2) indicated near zero or negative DZ correlations for the Attentional Focusing (EC) and Discomfort scales (NA-mothers’ ratings only) as well as the Surgency factor and its facets. We examined a series of models (i.e., ACE, ADE, sibling interaction models) to determine whether the low DZ correlations were best explained by contrast effects, non-additive effects (genetic dominance), or both. The results for mothers’ ratings are shown in Table 4, and for fathers’ ratings in Table 5. For Attentional Focusing, none of the models yielded adequate fit to the data. For Discomfort, the ADE model was the best fit to the data, χ2(3) = 4.38, p = .19, AIC = −1.63, RMSEA = .06, indicating moderate non-additive genetic and non-shared environmental influences.
Table 4.
Parameter estimates and fit statistics for alternative models describing mothers’ ratings of temperament in twin Siblings.
| a | c | d | e | b | χ2 (df, p) | AIC | RMSEA | |
|---|---|---|---|---|---|---|---|---|
| Attentional Focusing | ||||||||
| ACE | .48 | .00 | - | .52 | - | 15.67 (3, .00) | 9.67 | .16 |
| ADE | .00 | - | .55 | .45 | - | 9.12 (3, .03) | 3.12 | .11 |
| ACE + b | .73 | .00 | - | .27 | −.17 | 7.96 (2, .02) | 3.96 | .12 |
| ADE + b | .00 | - | .65 | .35 | −.08 | 6.85 (2, .03) | 2.85 | .11 |
| Discomfort | ||||||||
| ACE | .41 | .00 | - | .59 | - | 8.42 (3, .04) | 2.42 | .12 |
| ADE | .00 | - | .48 | .52 | - | 4.38 (3, .19) | −1.63 | .06 |
| ACE + b | .55 | .20 | - | .25 | −.24 | 2.82 (2, .24) | −1.18 | .06 |
| ADE + b | .68 | - | .00 | .32 | −.16 | 2.90 (2, .23) | −1.11 | .06 |
| Surgency/Extraversion | ||||||||
| ACE | .57 | .00 | - | .43 | - | 44.64 (3, .00) | 38.64 | .37 |
| ADE | .00 | - | .68 | .32 | - | 26.96 (3, .00) | 20.96 | .28 |
| ACE + b | .86 | .00 | - | .24 | −.30 | 14.85 (2, .25) | 10.85 | .25 |
| ADE + b | .00 | - | .81 | .19 | −.18 | 12.76 (2, .00) | 8.76 | .22 |
| Activity | ||||||||
| ACE | .63 | .00 | - | .37 | - | 35.91 (3, .00) | 29.91 | .31 |
| ADE | .00 | - | .68 | .32 | - | 26.96 (3, .00) | 20.96 | .28 |
| ACE + b | .86 | .00 | - | .14 | −.26 | 11.46 (2, .22) | 7.46 | .22 |
| ADE + b | .00 | - | .81 | .19 | −.15 | 8.36 (2, .02) | 4.36 | .18 |
| High-Intensity Pleasure | ||||||||
| ACE | .73 | .00 | - | .27 | - | 20.81 (3, .00) | 14.81 | .23 |
| ADE | .00 | - | .76 | .24 | - | 9.06 (3, .03) | 3.06 | .14 |
| ACE + b | .86 | .00 | - | .14 | −.19 | 6.83 (2, .33) | 2.83 | .16 |
| ADE + b | .11 | - | .70 | .19 | −.09 | 6.46 (2, .04) | 2.46 | .15 |
| Impulsivity | ||||||||
| ACE | .30 | .00 | - | .70 | - | 22.96 (3, .00) | 16.97 | .26 |
| ADE | .00 | - | .46 | .54 | - | 15.92 (3, .00) | 9.92 | .21 |
| ACE + b | .63 | .19 | - | .18 | −.37 | 4.03 (2, .13) | .03 | .09 |
| ADE + b | .78 | - | .00 | .22 | −.29 | 4.10 (2, .13) | .10 | .09 |
| Shyness | ||||||||
| ACE | .57 | .00 | - | .38 | - | 8.50 (3, .04) | 2.50 | .13 |
| ADE | .00 | - | .63 | .37 | - | 2.93 (3, .40) | −3.07 | .03 |
| ACE + b | .44 | .43 | - | .13 | −.36 | .38 (2, .83) | −3.62 | .00 |
| ADE + b | .78 | - | .00 | .22 | −.17 | .73 (2, .69) | −3.27 | .00 |
Table 5.
Parameter estimates and fit statistics for alternative models describing fathers’ ratings of temperament in twin siblings.
| a | c | d | e | b | χ2 (df, p) | AIC | RMSEA | |
|---|---|---|---|---|---|---|---|---|
| Attentional Focusing | ||||||||
| ACE | .29 | .00 | - | .70 | - | 8.58 (3, .04) | 2.58 | .18 |
| ADE | .00 | - | .34 | .66 | - | 7.43 (3, .06) | 1.43 | .15 |
| ACE + b | .61 | .00 | - | .39 | −.20 | 8.46 (2, .02) | 4.46 | .25 |
| ADE + b | .00 | - | .43 | .57 | −.05 | 7.09 (2, .03) | 3.09 | .22 |
| Surgency/Extraversion | ||||||||
| ACE | .06 | .00 | - | .94 | - | 29.70 (3, .00) | 13.71 | .40 |
| ADE | .00 | - | .26 | .74 | - | 27.36 (3, .00) | 21.36 | .31 |
| ACE + b | .78 | .00 | - | .22 | −2.69 | 12.86 (2, .00) | 8.86 | .32 |
| ADE + b | .00 | - | .71 | .29 | −3.45 | 10.83 (2, .00) | 6.83 | .28 |
| Activity | ||||||||
| ACE | .23 | .00 | - | .76 | - | 20.69 (3, .00) | 14.69 | .31 |
| ADE | .00 | - | .36 | .64 | - | 17.00 (3, .00) | 11.00 | .21 |
| ACE + b | .72 | .00 | - | .28 | −.30 | 11.88 (2, .00) | 7.88 | .31 |
| ADE + b | .00 | - | .65 | .35 | −.21 | 9.72 (2, .01) | 5.72 | .28 |
| High-Intensity Pleasure | ||||||||
| ACE | .32 | .00 | - | .68 | - | 13.12 (3, .00) | 7.12 | .24 |
| ADE | .00 | - | .46 | .54 | - | 8.60 (3, .04) | 2.60 | .15 |
| ACE + b | .77 | .00 | - | .23 | −.23 | 3.29 (2, .19) | −.71 | .11 |
| ADE + b | .00 | - | .70 | .30 | −.19 | 2.08 (2, .35) | −1.93 | .04 |
| Impulsivity | ||||||||
| ACE | .00 | .00 | - | 1.00 | - | 8.10 (3, .04) | 2.10 | .14 |
| ADE | .00 | - | .00 | 1.00 | - | 8.10 (3, .04) | 2.10 | .14 |
| ACE + b | .58 | .00 | - | .42 | −.34 | .83 (2, .66) | −3.17 | .00 |
| ADE + b | .00 | - | .48 | .52 | −.25 | .57 (2, .75) | −3.43 | .00 |
| Shyness | ||||||||
| ACE | .56 | .00 | - | .44 | - | 8.20 (3, .04) | 2.20 | .18 |
| ADE | .00 | - | .62 | .38 | - | 3.83 (3, .28) | −2.19 | .06 |
| ACE + b | .79 | .00 | - | .21 | −.19 | 2.81 (2, .25) | −1.19 | .07 |
| ADE + b | .00 | - | .71 | .29 | −.08 | 2.26 (2, .32) | −1.74 | .06 |
For Surgency/Extraversion and its facets, the findings were complex. For the Surgency factor and Activity facet scores, none of the models provided adequate fit to the data. For High-Intensity Pleasure, the ADE + sibling contrast effects model provided the best fit for fathers’ ratings, χ2(2) = 2.08, p = .35, AIC = −1.93, RMSEA = .04, and indicated substantial non-additive genetic and modest non-shared environment effects. In contrast, none of the models fit for mother-rated High-Intensity Pleasure. For Impulsivity, overall the best fitting model was the ADE + sibling contrast effects; this provided adequate fit for mothers’ ratings, χ2(2) = 4.03, p = .13, AIC = .10, RMSEA = .09, and excellent fit for fathers’ ratings, χ2(2) = .57, p = .75, AIC = −3.43, RMSEA = .00. For Shyness, the ADE + sibling contrast effects model was the best fit for mothers’ ratings, χ2(2) = .38, p = .83, AIC = −3.62, RMSEA = .00, with evidence of moderate additive and non-additive effects and modest non-shared environmental effects. For father ratings however, the ADE model was the best fit, χ2(2) = 3.83, p = .28, AIC = −2.19, RMSEA = .06, with moderate non-additive and non-shared environmental effects.
Lastly, we fit the mother and father temperament rating data for the three factors (Effortful Control, Negative Affectivity, and Surgency/Extraversion) to the Biometric (i.e., Cholesky) model to serve as a baseline of comparison for the Psychometric and Rater Bias models (see Table 6). For Effortful Control, the best fit was provided by the Biometric model, with nearly all (97%) of the genetic variance overlapping across mothers’ and fathers’ reports. For Negative Affectivity, the Rater Bias model provided the best fit. Reliable trait variance was accounted for by additive genetic factors (70%) and non-shared environment influences (30%). Bias estimates accounted for 40% (mothers) or 45% (fathers) of the variance, and unreliability estimates explained 27% (mothers) or 18% (fathers) of the variance. None of the models for Surgency/Extraversion fit the data.
Table 6.
Fit indices of multivariate models for mothers’ and fathers’ ratings of the highest-order temperament factors.
| χ 2 | df | p | AIC | RMSEA | |
|---|---|---|---|---|---|
| Effortful Control | |||||
| Biometric | 5.17 | 11 | .92 | −16.83 | .00 |
| Psychometric | 6.85 | 11 | .81 | −15.15 | .00 |
| Rater bias | 9.69 | 13 | .72 | −16.31 | .00 |
| Negative Affectivity | |||||
| Biometric | 6.13 | 11 | .86 | −15.87 | .00 |
| Psychometric | 4.75 | 11 | .94 | −17.25 | .00 |
| Rater bias | 5.20 | 13 | .97 | −20.80 | .00 |
| Surgency/Extraversion | |||||
| Biometric | 47.50 | 11 | .00 | 25.50 | .27 |
| Psychometric | 43.68 | 11 | .00 | 21.68 | .27 |
| Rater bias | 51.14 | 13 | .00 | 25.14 | .26 |
4. Discussion
Our goal was to extend the literature on temperament in childhood by examining genetic and environmental influences on temperament in middle childhood. To our knowledge, the current study is the first to use a twin design to examine and compare mothers’ and fathers’ ratings in middle childhood. We examined and compared mothers’ and fathers’ ratings of child temperament utilizing the most recently developed measure, the Child Behavior Questionnaire—Short Form or CBQ-SF (Putnam & Rothbart, 2006), which defines relevant dimensions of behavior and affect in regards to individual differences in reactivity and self-regulation (Rothbart & Bates, 1998).
For Effortful Control and its facets, significant genetic effects and non-shared environmental effects were indicated; shared environment effects were significant only for Low-Intensity Pleasure. Overall, the variance components were similar for mothers’ and fathers’ ratings, although there was a range in the point estimates depending on the particular scale in question. For Negativity Affectivity, the findings were more complex. Significant genetic and non-shared environment effects were found for mothers’ and fathers’ ratings of the Anger, Soothability, and Fear scales—and shared environment effects were negligible. In contrast, different results emerged for mothers’ and fathers’ ratings on the Negativity Affectivity factor scale. Mothers’ ratings yielded substantial genetic and negligible shared environmental variance estimates, but fathers’ ratings yielded negligible genetic and moderate shared environmental variance estimates. As discussed in more detail below, the results for Surgency and its facets were less straightforward.
In general, the magnitude of the heritability estimates for aspects of negative emotionality and self-regulation capacity in middle childhood were comparable to those reported for similar dimensions of temperament in infancy and early childhood (Buss & Plomin, 1984; Cherny et al., 1994; Cyphers et al., 1990; Goldsmith et al., 1997; Robinson et al., 2004; Saudino & Cherny, 2001; Stevenson & Fielding, 1985) as well as those reported by Matheny and Dolan (1980) for middle childhood. Whether or not the same or different genetic and environmental effects operate on temperament from infancy through middle childhood remains to be determined, but the overall effects appear to result in similar variance estimates over this period of development.
4.1. Sibling contrasts
Whenever parents are providing ratings of two children’s behaviors, sibling contrast effects are a potential concern. These effects—arising when the actual behavioral differences between DZ twins are inflated—emerged for the Surgency factor and facets, as well as the Attentional Focusing and Discomfort (mothers only) facets. Low DZ twin correlations are problematic; based on the basic ACE additive genetic and environmental effects model, DZ twin similarity should be at least half that of MZ twins. If not specified in the model, the presence of sibling contrast effects inflates heritability estimates.
Goldsmith and Hewitt (2003) noted that sibling contrast effects may be more acute when parents make global judgments (e.g., my child gets upset easily) compared to more specific judgments (e.g., my child sits quietly in the bathtub). Sibling contrast effects have been found for global measures such as the EAS (Buss & Plomin, 1984) and the CCTI (Rowe & Plomin, 1977), in studies of twins and non-twin siblings spanning infancy to adolescence (Saudino et al., 2000, 1995; Saudino, Wertz, Gagne, & Chawla, 2004; Spinath & Angleitner, 1998). In the current study, we used a short-form version of the CBQ, which has less global, more context-specific items in it. Consistent with Goldsmith and Hewitt, one study in early childhood that examined sibling contrast effects across the CCTI and CBQ indicated less evidence of contrast effects in the CBQ (Saudino et al., 2004). This may be because the CBQ uses context-specific items.
In the current study, the presence of sibling contrast effects was limited almost entirely to Surgency and its facets—a finding that replicates a previous study using the full-length CBQ in early childhood (Goldsmith et al., 1997). Evidence of sibling contrast effects for the Surgency factor and its subscales across mothers’ and fathers’ ratings was complex. The sibling contrast model simply did not fit the data for the Surgency factor. However, contrast effects were found for mothers’ and fathers’ ratings of Impulsivity, for mothers’ ratings of Shyness, and for fathers’ ratings of High-Intensity Pleasure. Furthermore, fathers’ ratings (of Impulsivity and High-Intensity Pleasure) also included non-additive genetic variance, suggesting that fathers (but not mothers) ratings of the facets of Surgency included sibling contrast as well as non-additive genetic effects whereas mothers (but not fathers) ratings included sibling contrast as well as additive genetic effects. Although the CBQ measures are proposed to be less sensitive to contrast effects, it is possible that this context specificity does not attenuate these effects for all behavioral indicators. Parents may find these particular behaviors as highly disruptive and challenging and therefore, even small differences may be highly discernable which could lead to this exaggerated anchoring effect.
The results for mothers’ ratings of the CBQ-SF are consistent with findings of sibling contrast effects on the CCTI in early childhood (Saudino et al., 2000). However, unlike Saudino et al., the contrast effects in the current study were not evident across all of the CBQ factors. These comparisons aside, a more general point is that study designs that include informants who are not directly comparing the twins (e.g., teachers, observers, testers) probably is necessary for estimating genetic and environmental effects that are free of sibling contrast effects. However, the presence of sibling contrast effects should not be used as an argument for completely substituting parents’ reports with other informants’ ratings. Parents are by far the most knowledgeable reporters of their children’s temperament.
4.2. Parent agreement and rater bias
Although we did see some distinct patterns in the findings for mothers and fathers, this was not because of poor agreement between parents’ perceptions of the same child. Overall, estimates of parental agreement were moderate to substantial in magnitude; agreement was lowest for Negative Affectivity, higher for Effortful Control, and highest for Surgency. The average correlation between mothers’ and fathers’ ratings was .51—comparable to the agreement found in early childhood (Field & Greenberg, 1982; Lyon & Plomin, 1981). However, this correlation also indicated that there was considerable parent-specific variance in their ratings. Therefore, we examined whether the parent-specific variance was attributable to systematic rater bias, measurement error, or potentially meaningful information about parents’ reliable yet different perspectives on the same children. We did this by examining the three CBQ-SF factors using the Biometric, Psychometric, and Rater Bias models.
None of the models fit the data for Surgency, so it was not considered further. For Effortful Control, the Biometric Model fit best. This model raises the possibility that parents may be assessing different but correlated phenotypes or that they are rating the same phenotype but are basing their ratings of behavior on different contexts (e.g., home, school, extracurricular activities). Yet another possibility is that mothers and fathers have different understandings of the behavioral indicators of Effortful Control. In contrast, the Rater Bias model was the best fitting model for Negative Affectivity. Similar bias (i.e., systematic) variance estimates were found for mothers (40%) and fathers (45%). Likewise, fairly similar unreliability (i.e., random error) variance estimates were found for mothers (27%) and fathers (15%). Overall, these results suggest that different patterns of rating bias are found for the distinct temperament factors, but within any given factor a similar pattern is found for mothers and fathers. This means that distinct dimensions of temperament behaviors may evoke distinct types of rating bias. Thus, any general statements about parents’ ratings being biased in a particular way probably are not warranted.
4.3. Caveats and conclusions
There are several limitations of the current study to bear in mind. Our analysis did not address potential gene–environment interaction effects, although there is some evidence from molecular genetic studies that environmental influences moderate genetic influences on temperament. For instance, various aspects of Surgency may be differentially related to harsh parenting or parental social support, for children with different dopamine receptor four alleles (Sheese, Voelker, Rothbart, & Posner, 2007) and different serotonin transporter gene alleles (Fox et al., 2005). The effects of these and other potential gene–environment interaction effects are not estimated in the models we used. Furthermore, the CBQ-SF is intended for 4–7 years old, but nearly half of our sample was 8–9 years old—although in preliminary analyses we found no differences in means, variances, or factor structures for the younger vs. older children in the sample. Another limitation is that these findings may not generalize beyond twins to non-twin siblings or to singletons. Finally, we found little evidence for shared environmental influences overall, but this could be because the twin design is underpowered for detecting such effects—a limitation given that we did not have a large sample.
These limitations aside, the findings lend support to and extend research on genetic and environmental influences on temperament in childhood. For the broad temperament factors of Negative Affectivity and Effortful Control, additive genetic influences accounted for one-fifth to nearly two-thirds of the variance in individual differences, which is consistent with the infancy and early childhood literature. Also consistent with previous findings, shared environmental influences were modest or negligible, with nearly all of the non-genetic variance appearing in the non-shared environment variance estimate. Genetic and non-shared environmental influences were similar across the majority of maternal and paternal reported temperament in middle childhood. Taken as a whole, these findings suggest that the etiology of temperament in middle childhood is similar to that of early childhood, and that the new short-form of the Child Behavior Questionnaire yields data with sound predictive validity with respect to detection of genetic and non-shared environmental influences.
Acknowledgments
We thank the study participants and research staff. This study was supported by Grants from NICHD (HD38075) and NICHD/OSERS (HD46167).
References
- Burnham KP, Anderson DR. Model selection and inference: A practical information-theoretic approach. Springer; New York: 1998. [Google Scholar]
- Buss A, Plomin R. Temperament: Early developing personality traits. Erlbaum; Hillsdale, NJ: 1984. [Google Scholar]
- Cherny SS, Fulker DW, Corley R, Plomin R, DeFries JC. Continuity and change in infant shyness from 14 to 20 months. Behavior Genetics. 1994;24:365–379. doi: 10.1007/BF01067538. [DOI] [PubMed] [Google Scholar]
- Cyphers LH, Phillips K, Fulker DW, Mrazek DA. Twin temperament during the transition from infancy to early childhood. Journal of the American Academy of Child & Adolescent Psychiatry. 1990;29:392–397. doi: 10.1097/00004583-199005000-00010. [DOI] [PubMed] [Google Scholar]
- Field T, Greenberg R. Temperament ratings by parents and teachers of infants, toddles, and preschool children. Child Development. 1982;53:160–163. [Google Scholar]
- Fox NA, Nichols KE, Henderson HA, Rubin K, Schmidt L, Hamer D, et al. Evidence for a gene–environment interaction in predicting behavioral inhibition in middle childhood. Psychological Science. 2005;16:921–926. doi: 10.1111/j.1467-9280.2005.01637.x. [DOI] [PubMed] [Google Scholar]
- Goldsmith HH. A zygosity questionnaire for young twins: A research note. Behavior Genetics. 1991;21(3):257–269. doi: 10.1007/BF01065819. [DOI] [PubMed] [Google Scholar]
- Goldsmith HH, Buss KA, Lemery KS. Toddler and childhood temperament: Expanded content, stronger genetic evidence, new evidence for importance of environment. Developmental Psychology. 1997;33:891–905. doi: 10.1037//0012-1649.33.6.891. [DOI] [PubMed] [Google Scholar]
- Goldsmith HH, Buss AH, Plomin R, Rothbart MK, Thomas A, Chess S, et al. Roundtable: What is temperament? Four approaches. Child Development. 1987;58:505–529. [PubMed] [Google Scholar]
- Goldsmith HH, Hewitt EC. Validity of parental report of temperament: Distinctions and needed research. Infant Behavior & Development. 2003;26:108–111. [Google Scholar]
- Goldsmith HH, Lemery KS, Buss KA, Campos JJ. Genetic analyses of focal aspects of infant temperament. Developmental Psychology. 1999;35:972–985. [PubMed] [Google Scholar]
- Hewitt JK, Silberg JL, Neale MC, Eaves LJ, Erickson M. The analysis of parental ratings of children’s behavior using LISREL. Behavior Genetics. 1992;22:293–317. doi: 10.1007/BF01066663. [DOI] [PubMed] [Google Scholar]
- Hu L, Bentler PM. Cutoff criteria for fit indexes in covariance structure analysis: Conventional criteria versus new alternatives. Structural Equation Modeling. 1999;6:1–35. [Google Scholar]
- Loehlin JC, Horn JM. Personality resemblance in adoptive families. Behavior Genetics. 1981;11:309–330. doi: 10.1007/BF01070814. [DOI] [PubMed] [Google Scholar]
- Lyon ME, Plomin R. The measurement of temperament using parental ratings. Journal of Child Psychology and Psychiatry. 1981;22:47–53. doi: 10.1111/j.1469-7610.1981.tb00530.x. [DOI] [PubMed] [Google Scholar]
- Matheny AP, Jr., Dolan AB. A twin study of personality and temperament during middle childhood. Journal of Research in Personality. 1980;14:224–234. [Google Scholar]
- Neale MC. Mx: Statistical modeling. 4th ed Medical College of Virginia, Department of Psychiatry; Richmond, VA: 1997. [Google Scholar]
- Neale MC, Stevenson J. Rater bias in the EASI temperament scales: A twin study. Journal of Personality and Social Psychology. 1989;55:446–455. doi: 10.1037//0022-3514.56.3.446. [DOI] [PubMed] [Google Scholar]
- Petrill SA, Deater-Deckard K, Thompson L, DeThorne L, Schatschneider C. Genetic and environmental effects of serial naming and phonological awareness on early reading outcomes. Journal of Educational Psychology. 2006;98:112–121. doi: 10.1037/0022-0663.98.1.112. [DOI] [PMC free article] [PubMed] [Google Scholar]
- Putnam SP, Rothbart MK. Development of short and very short forms of the Children’s Behavior Questionnaire. Journal of Personality Assessment. 2006;87:102–112. doi: 10.1207/s15327752jpa8701_09. [DOI] [PubMed] [Google Scholar]
- Robinson JL, Kagan J, Reznick JS, Corley R. The heritability of inhibited and uninhibited behavior: A twin study. Developmental Psychology. 2004;28:1030–1037. [Google Scholar]
- Rothbart MK, Bates JE. Temperament. Handbook of child psychology. 1998;Vol. 3:105–176. [Google Scholar]
- Rowe DC, Plomin R. Temperament in early childhood. Journal of Personality Assessment. 1977;41:150–156. doi: 10.1207/s15327752jpa4102_5. [DOI] [PubMed] [Google Scholar]
- Saudino KJ. Parent ratings of infant temperament lessons from twin studies. Infant Behavior & Development. 2003;26:100–107. [Google Scholar]
- Saudino KJ, Cherny SS. Parent ratings of temperament in twins. In: Emde RN, Hewitt JK, editors. The transition from infancy to early childhood: Genetic and environmental influences in the MacArthur Longitudinal Twin Study. Oxford University Press; New York, NY: 2001. pp. 73–88. [Google Scholar]
- Saudino KJ, Cherny SS, Plomin R. Parent ratings of temperament in twins: Explaining the ‘too low’ DZ correlations. Twin Research. 2000;3:224–233. doi: 10.1375/136905200320565193. [DOI] [PubMed] [Google Scholar]
- Saudino KJ, McGuire S, Reiss D, Hetherington EM, Plomin R. Parent ratings of EAS temperaments in twins, full siblings, half siblings, and step siblings. Journal of Personality and Social Psychology. 1995;68:723–733. doi: 10.1037//0022-3514.68.4.723. [DOI] [PubMed] [Google Scholar]
- Saudino KJ, Wertz AE, Gagne JR, Chawla S. Night and day: Are siblings as different in temperament as parents say they are? Journal of Personality and Social Psychology. 2004;87:698–706. doi: 10.1037/0022-3514.87.5.698. [DOI] [PMC free article] [PubMed] [Google Scholar]
- Schmitz S. Personality and Temperament. In: DeFries JC, Plomin R, Fulker DW, editors. Nature and nurture during middle childhood. Blackwell Publishers; Cambridge, MA: 1994. pp. 120–140. [Google Scholar]
- Schmitz S, Saudino KJ, Plomin R, Fulker DW, DeFries JC. Genetic and environmental influences on temperament in middle childhood: Analyses of teacher and tester ratings. Child Development. 1996;67:409–422. [PubMed] [Google Scholar]
- Sheese BE, Voelker PM, Rothbart MK, Posner MI. Parenting quality interacts with genetic variation in dopamine receptor D4 to influence temperament in early childhood. Development and Psychopathology. 2007;19:1039–1046. doi: 10.1017/S0954579407000521. [DOI] [PubMed] [Google Scholar]
- Silberg JL, San Miguel VF, Murrelle EL, Prom E, Bates JE, Canino G, et al. Genetic and environmental influences on temperament in the first year of life: The Puerto Rico Twin Study (PRINTS) Twin Research and Human Genetics. 2005;8:328–336. doi: 10.1375/1832427054936808. [DOI] [PubMed] [Google Scholar]
- Simonoff E, Pickles A, Hervas A, Silberg JL, Rutter M, Eaves L. Genetic influences on childhood hyperactivity: Contrast effects imply parental rating bias, not sibling interaction. Psychological Medicine. 1998;28:825–837. doi: 10.1017/s0033291798006886. [DOI] [PubMed] [Google Scholar]
- Spinath FM, Angleitner A. Contrast effects in Buss and Plomin’s EAS questionnaire: A behavioral-genetic study on early developing personality traits assessed through parental ratings. Personality and Individual Differences. 1998;25:947–963. [Google Scholar]
- Steiger JH. EzPath: Casual modeling. SYSTAT inc.; Evanston, IL: 1989. [Google Scholar]
- Stevenson J, Fielding J. Ratings of temperament in families of young twins. British Journal of Developmental Psychology. 1985;3:143–152. [Google Scholar]