Abstract
Background
Biventricular (BIV) pacing can improve cardiac function in heart failure by altering the mechanical and electrical substrates. We investigated the effect of BIV versus right ventricular (RV) pacing on the normal heart.
Methods and Results
Male New Zealand White rabbits (n=33) were divided into 3 groups: sham-operated (control), RV pacing, and BIV pacing groups. Four weeks after surgery, the native QT (p=0.004) interval was significantly shorter in the BIV group compared to the RV or sham-operated groups. Also, compared to rabbits in the RV group, rabbits in the BIV group had shorter RV ventricular effective refractory period (VERP) at all cycle lengths, and shorter LV paced QT interval during the drive train of stimuli and close to refractoriness (p<0.001 for all comparisons). Protein expression of the KVLQT1 was significantly increased in the BIV group compared to the RV and control groups, while protein expression of SCN5A and connexin43 was significantly decreased in the RV compared to the other study groups. Erg protein expression was significantly increased in both pacing groups compared to the controls.
Conclusions
In this rabbit model, we demonstrate a direct effect of BIV but not RV pacing on shortening the native QT interval as well as the paced QT interval during burst pacing and close to the VERP. These findings underscore the fact that the effect of BIV pacing is partially mediated through direct electrical remodeling and may have implications as to the effect of BIV pacing on arrhythmia incidence and burden.
Keywords: Rabbit, Right Ventricular Pacing, Biventricular Pacing, Cardiac Remodeling
Both mechanical and electrical reverse remodeling have been documented with biventricular pacing (BIV) in patients with advanced heart failure (HF) and systolic left ventricular (LV) dysfunction1-3. Other interventions that have significant salutary effects from the hemodynamic perspective, such as the insertion of LV assist devices, have also been shown to alter the electrical characteristics of the failing heart, as demonstrated by the surface electrocardiogram4. It is unclear however whether these electrical changes are a consequence of the reverse mechanical remodeling or whether they are a direct effect of the site of pacing and altered electrical and mechanical propagation.
We have previously5 demonstrated in a novel rabbit model of myocardial infarction and chronic epicardial pacing that, unlike right ventricular (RV) pacing or no pacing, BIV pacing reduces both LV end-systolic and end-diastolic volumes, increases the LV fractional area shortening, and restore the ether-a-gogo myocardial protein levels to their pre-infarction levels. BIV pacing also shortens the native QRS complex in rabbits 4 weeks after myocardial infarction5. Whether these electrical changes are secondary to the mechanical improvement in LV size and function or whether they are independent of these changes and possibly up-stream of them from the mechanistic standpoint remains unclear at this point.
The effect of pacing on altering the T wave vector of the normal heart in sinus rhythm has been termed ‘cardiac memory’ and is well described in the literature6, 7. Human reports and animal models have described this phenomenon in the context of RV pacing, anomalous ventricular preexcitation, or arrhythmias. To our knowledge, the differential effect of RV versus BIV pacing on cardiac electrical remodeling in the normal heart has not been described in the literature.
We therefore investigated the effect of BIV versus RV pacing on the normal heart, where significant changes in mechanical function are not expected, in order to elucidate which changes induced with BIV pacing may be a direct consequence of the altered electrical stimulation.
Materials and Methods
Study Design
The research protocol was approved by the Institutional Animal Care and Use Committee of the University of Pittsburgh. Male New Zealand White rabbits (n=33; weight=3.4-6.0 kg) were divided into 3 groups: sham-operated controls (C group, n=9), where the rabbits underwent pericardial stripping only; RV pacing group (RV group, n=11), where the rabbits underwent pericardial stripping and epicardial RV pacemaker implantation; and BIV pacing group (BIV group, n=13), where the rabbits underwent pericardial stripping and epicardial BIV pacemaker implantation. All paced rabbits (RV and BIV groups) had both RV and LV epicardial leads. Rabbits in the pacing groups were continuously paced at a rate of 270 beats per minute, which is slightly higher than the maximum ambulatory heart rate in the rabbit, for 4 weeks after surgery until they were sacrificed. Rabbits had baseline electrocardiograms and echocardiograms on the day of surgery. At 4 weeks, rabbits had a repeat electrocardiogram and echocardiogram done after the pacemaker was turned off for no less than 30 minutes. A total of eight rabbits (4 in each of the RV and BIV groups) underwent programmed ventricular stimulation 4 weeks after surgery. They were then sacrificed and their hearts were excised. Cardiac tissue was collected from the LV and RV of all 3 groups for molecular analyses.
Surgical preparation of rabbit
As previously described5, 8, rabbits were anesthetized using intramuscular injections of a mixture of ketamine (35 mg/kg) and xylazine (5 mg/kg). A 22 gauge intravenous catheter was inserted into the marginal ear vein for venous access. An arterial line was inserted into the middle ear artery for continuous hemodynamic monitoring. The rabbits were intubated with an endotracheal tube (3.0-mm ID) and mechanically ventilated (rate 40/min, tidal volume 15 ml) using room air enriched with oxygen. Isoflurane anesthesia (2.0-2.5%) was delivered to maintain general anesthesia during surgery. The rabbits were placed on a water blanket adjusted to 38° C. A pulse oxymeter was placed on the rabbit's tongue for continuous monitoring of oxygen saturation.
The chest was opened through the fourth left intercostal space. The heart was exposed through an incision of the pericardium and explored. Prophylactic antibiotic (Ancef 100mg IV) was administered before and after surgery.
Pacemaker Implantation
As previously described5, 8, pacemaker leads were sutured to the epicardial surface of both the RV and left ventricle (LV). The LV and RV leads were placed on the LV and RV free walls, respectively. The leads (model 4965 and model 4968, Medtronic, St Paul, MN) were connected to a permanent pacemaker configured to pace the RV alone or both the RV and LV simultaneously. In case of BIV pacing, a Y-connector (model 2872, Medtronic, St Paul, MN) was used to pace the RV and LV simultaneously from a single-chamber (Kappa KSR403, Medtronic, St Paul, MN) pacemaker, programmed through research software to pace at a fast rate of 270 beats per minute (slightly above the rabbits’ maximum ambulatory heart rate within a cage in order to ensure a high percentage of pacing). Prior to Y-adapting the RV and LV leads, they were both tested for sensing as well as pacing impedance and threshold and the morphology of the captured QRS complex from each lead was noted. Once connected to the pacemaker, a QRS morphology consistent with a fusion between RV and LV pacing was ascertained to confirm capture of both ventricles. Pacing was ascertained by weekly interrogation of the pacemaker. The pacemaker and leads were placed in a subcutaneous pocket in the abdominal area of the rabbit.
Echocardiography
Nineteen rabbits (9 C, 6 RV, and 4 BIV) underwent baseline and follow-up echocardiography 4 weeks after surgery. As previously described5, 8, following anesthesia with ketamine and xylazine, rabbits were placed supine on a warming plate and the chest shaved. Needle electrocardiographic leads were attached to each limb for continuous ECG monitoring. Echocardiography was performed with the pacemaker turned off with an Acuson Sequoia ultrasound machine using a dynamically focused 8 MHz transducer. Two-dimensional long and short axis images through the LV were obtained and the latter used to place the M-mode cursor perpendicularly through the LV septum and posterior wall, avoiding the papillary muscles and imaging at the level of maximum chamber dimension. Studies were recorded on 1/2" S-VHS videotape and freeze frame images, including ECG, printed on a color printer.
Off-line data analysis was performed on the echocardiographic images. Left ventricular cross-sectional areas at end-diastole (CSAd) and at end-systole (CSAs) were measured from freeze frame 2-D mode in the short axis view by planimetry. End-diastole was taken to be at the point of maximal cavity dimension, and end-systole at the point of maximal anterior excursion of the posterior wall. Three or more beats were measured and averaged. The LV percent fractional area change (%FAC) was calculated as (CSAd-CSAs)/CSAd × 100. All echocardiograms were read in random order by an observer masked to the experimental group of the rabbits.
Ventricular Stimulation Protocol
Premature ventricular stimulation was performed on 8 rabbits (4 RV and 4 BIV) 4 weeks after surgery. Inhaled isoflorane (2.5%) was used during the protocol. The pacemaker was turned off for no less than 30 minutes prior to ventricular stimulation. After disconnecting them from the pacemaker and the Y-adapter, the RV and LV leads were used for stimulation. Single premature ventricular stimuli (S2) were delivered from the RV and LV leads after a drive of 12 ventricular stimuli (S1) at cycle lengths of 260, 240, 220, 200, 180, 160, and 140 ms, until the ventricular effective refractory period (VERP) was reached. The QRS and QT intervals were measured while pacing from the RV and LV at each cycle length, both during the pacing drive and immediately before reaching the VERP (at the functional refractory period).
Optical Mapping
Optical mapping was performed on a subset of 4 control rabbits to assess the duration of the action potential at 75% repolarization (APD75) in RV compared to LV tissue. As previously described8, hearts excised from rabbits were hung on a Langerdorff apparatus and retrogradely perfused through the aorta. The hearts were stained with the voltage dye, RH-237, and action potential transients were recorded at 37°C from the epicardial surface of the LV and RV. The optical mapping array consists of 16×16 diodes, with each diode having a sensing area of 0.95×0.95 mm2, with a pitch of 1.1 mm (center of one diode to adjacent diode). Diodes at the 4 corners of the array are used as instrumentation data channels, resulting in 252 out of 256 diodes being monitored for voltage signals. Each diode detects light from an area of 0.8×0.8 mm2 from the epicardial layer. Various regions of the heart were scanned including in the LV and RV. The mean APD75 was calculated for each ventricle in the 4 control rabbits.
Cellular and Molecular Analysis of Cardiac Tissue
Hearts were removed from rabbits in each experimental group, and 200 mg samples were taken from the LV and RV free walls. We performed immunoblots (Western blots) using antibodies to the ether-a-go-go related gene (erg) [rabbit anti-erg (Kv11.1) polyclonal antibody from Chemicon International Inc., Temecula, CA], KVLQT1 [Alomone labs, Cat # APC-022, Jerusalem, Israel], Kv4.3 [Alomone labs, Cat# APC-017, Jerusalem, Israel], SCN5A [Alomone labs, Cat# ASC-005, Jerusalem, Israel], and connexin43 [Milipore, Cat # MAB3067, Temecula, CA] genes. As previously described5, 9, 10, crude membrane preparations were isolated by differential centrifugation from the same regions of the hearts described above. Channel proteins were dissolved in buffer containing SDS, quantitated (BioRad), and ~60 μg of protein per lane was ran on a 7.5% SDS-PAGE gel (ready tris-HCL gel from Bio-Rad Laboratories, Hercules, CA), transferred to PVDF membrane by semi-dry apparatus, blocked with PBS-5% milk, incubated overnight at 4°C with the primary antibody, washed with PBS-Tween, incubated with alkaline phosphatase (AP)-conjugated goat anti-mouse 2° antibody, and quantitated by chemiluminescence (Lumi-Phos). Coomassie Blue staining of SDS-PAGE blots was performed to confirm equal loading. The autoradiographs were scanned using a Visioneer OneTouch scanner (Visioneer Hardware, Pleasanton, CA) and Microsoft Scanner and Camera Wizard computer program. The images were digitized for quatification using Quantity One quantitation software (BioRad Laboratories, Hercules, CA). Bands of interest were delineated and densitometries were calculated based on the number of pixels. To allow comparison between blots, samples on each blot were normalized against the mean of the samples from the same ventricle of control rabbits on that blot. We performed Westerns on LV and RV tissues from 3 to 4 rabbits of each of the C, RV, and BIV groups.
Real Time Quantitative PCR
KVLQT1, ERG, SCN5A, and Connexin43 gene expression of mRNA levels were determined by fluorescence-based kinetic real-time PCR using a Perkin-Elmer Applied Biosystems model 7000 sequence detection system (Applied Biosystems Inc., Foster City, CA). As previously described11, total RNA was extracted from 50mg rabbit heart tissues using RNeasy kit (QIAGEN, Cat# 74134, Qiagen Inc., Valnecia, CA). The cDNA was synthesized with SuperScript™ II reverse transcriptase (Invitrogen Inc., Carlsbad, CA, USA) according to manufacturer's instructions. The real-time PCR was performed on 30ng cDNAs with gene specific primers (Erg sense 5'-CAGGCACCACGCATCCA-3' and Erg anti-sense 5'-CAGTCCCACACAGCCTTGAA-3'; KVLQT1 sense 5'-CCGCCAGGAGCTGATCAC-3' and KVLQT1 anti-sense 5'-TCTCAGCAGGTACACGAAGTAGGA-3'; SCN5A sense 5’-GGCAACCTGAGGCATAAGTG-3’ and SCN5A anti-sense 5’-GTCGGAGGTACCGTTCTTGA-3’; Connexin43 sense 5’-ATCAGGTGGACTGCTTCCTCT-3’ and Connexin43 anti-sense 5’-GCGGGTCTTGGGTGTGTAGA-3’) and Power SYBR Green PCR master mix (ABgene, Foster City, CA). All data were normalized to GAPDH (sense 5’-GCTTCTTCTCGTGCAGTGCT-3’ and anti sense 5’-TGGCGACAACATCCACTTTG 3’) which was used as an internal control.
Data Analysis
Data is presented as mean ± standard error unless otherwise indicated. Continuous variables were compared by analysis of variance (ANOVA) with Scheffe's multiple range test. Data before and after an intervention were compared using ANOVA for repeated measurements. All statistical analyses were performed using SPSS software (version 10.1, Chicago, IL). A p value ≤ 0.05 was considered statistically significant.
Results
Echocardiography
Echocardiograms were analyzed on 19 rabbits (9 C, 6 RV, and 4 BIV) at baseline and 4 weeks post surgery and are shown in table 1. As expected, there were no significant baseline differences amongst the 3 study groups in LV end-systolic and end-diastolic areas, or fractional area shortening. Four weeks after surgery, there was a modest increase in the LV end-systolic and end-diastolic areas and decrease in the fractional area shortening in both the RV and BIV groups compared to the sham-operated control group. There were no differences however in these parameters between the RV and BIV groups except for a marginally higher fractional area shortening in the BIV compared to the RV group (51±1 mm2 versus 42±2 mm2, p=0.042), primarily accounted for by baseline differences between these two groups. In fact, when the change from baseline in all parameters was compared between the groups, there were no statistically significant changes (table 1).
Table 1.
Echocardiographic Data
| CSAd | CSAs | FAC | |||||||
|---|---|---|---|---|---|---|---|---|---|
| Base | 4w | Δ | Base | 4w | Δ | Base | 4w | Δ | |
| C (n=9) | 196 (5) | 194 (3)* | −2 (7) | 102 (6) | 97 (4)* | −5 (4) | 48 (3) | 50 (2) | 2 (2) |
| RV (n=6) | 210 (8) | 214 (6) | 4 (8) | 115 (5) | 124 (6) | 9 (6) | 45 (1) | 42 (2) | −3 (3) |
| BIV (n=4) | 215 (11) | 226 (10) | 11 (13) | 111 (7) | 112 (5) | 1 (5) | 49 (1) | 51 (1)† | 2 (1) |
All measurements are represented as mean (standard error)
CSAd=cross-sectional area of LV in diastole (in mm2)
CSAs=cross-sectional area of LV in systole (in mm2)
FAC=fractional area change of LV (%)
Base = baseline pre-surgery value
4w = 4 weeks after surgery
Δ = change from baseline to 4 weeks after surgery (4w – base)
p<0.01 for the comparison of C with the RV and BIV groups
p<0.05 for the comparison of BIV versus RV group
Electrocardiography
Electrocardiograms (ECG) were obtained on all 33 rabbits at baseline and 4 weeks after surgery. All ECG were obtained while the pacemaker was turned off for no less than 30 minutes. The tracings were analyzed and the data is presented in table 2.
Table 2.
Electrocardiographic Data
| RR (ms) | PR (ms) | QRS (ms) | QT (ms) | QT index (%) | ||||||
|---|---|---|---|---|---|---|---|---|---|---|
| Base | 4w | Base | 4w | Base | 4w | Base | 4w | Base | 4w | |
| C (n=9) | 313 (11) | 324 (17) | 76 (5) | 81 (4) | 39 (3) | 36 (5) | 177 (7) | 175 (8) | 116 (3) | 111 (2) |
| RV (n=11) | 271 (14) | 295 (12) | 76 (3) | 87 (4) | 44 (1) | 39 (3) | 159 (8) | 174 (5) | 112 (2) | 112 (3) |
| BIV (n=13) | 313 (12) | 298 (10) | 76 (2) | 78 (3) | 41 (2) | 36 (2) | 174 (5) | 156 (3)* | 112 (3) | 102 (3)† |
All measurements are represented as mean (standard error)
Base = baseline pre-surgery value
4w = 4 weeks after surgery
QT index is the percentage of the ratio of the QT measured to the QT expected based on the heart rate. QT expected is calculated using the equation: QT exp = 86 + 0.22 × RR where RR is the cardiac cycle length.
p<0.01 for the comparison of BIV group versus C and RV groups
p<0.05 for the comparison of BIV group versus C and RV group
At baseline, there were no differences between groups in any of the measured parameters. At 4 weeks after surgery, there were no significant differences in RR, PR, or QRS intervals between the 3 study groups (table 2). Four weeks after surgery, the QT interval was significantly shorter in the BIV group compared to the RV or sham-operated groups. Using established methods of correction of the QT interval in non-transgenic rabbits12, the QT interval expected for the heart rate was calculated using the formula QT exp = 86+0.22 × RR where RR represents the cardiac cycle length in ms. The QT index which is the percentage of the ratio of the measured to the expected QT was then derived. As shown in table 2, the QT index in the BIV group was significantly smaller than in the RV or C groups.
Premature Ventricular Stimulation
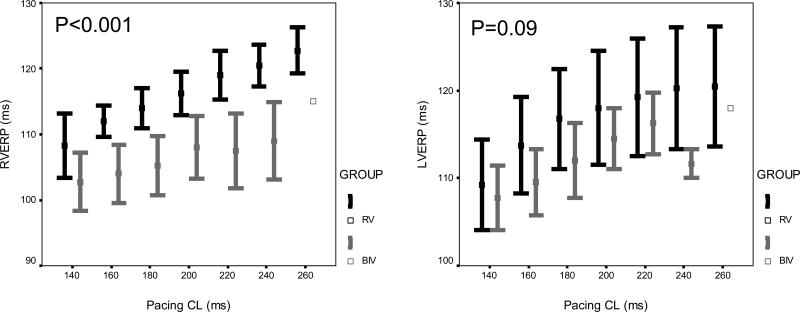
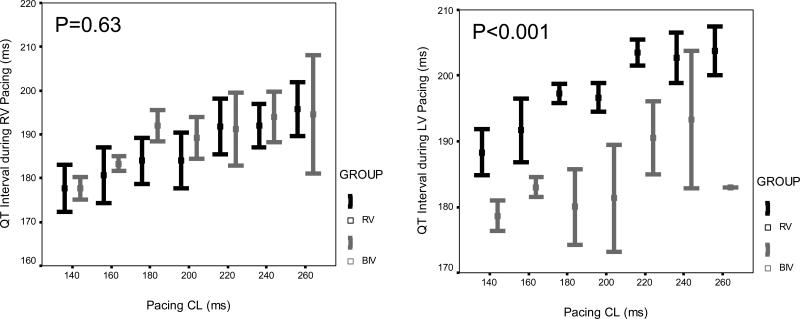
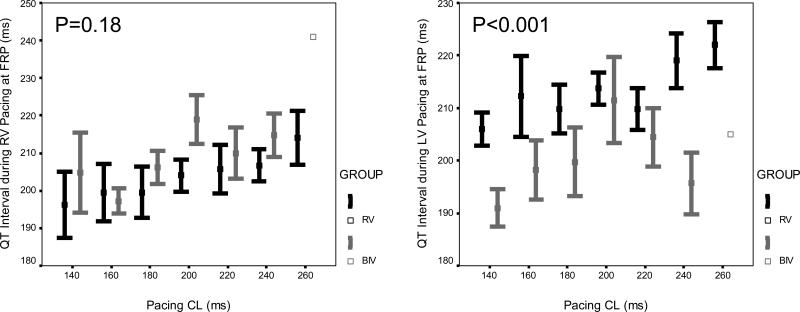
At baseline, there were no differences between the RV and BIV paced groups in any of the parameters including the ventricular refractory periods of the RV and LV as well as the QRS and QT intervals during drive pacing (S1) from the RV and LV as well as at the functional refractory period determined with premature ventricular stimulation (S2) at all cycle lengths. Four weeks after surgery, compared to rabbits in the RV group, rabbits in the BIV group had significantly shorter RV VERP at all cycle lengths, and shorter LV paced QT interval during the drive train of stimuli and at the functional refractory period during premature ventricular stimulation (figure 1). Also, 4 weeks after surgery, the paced QRS width at the functional refractory period was marginally narrower in the RV compared to the BIV group during RV pacing (94±1 ms vs. 98±1 ms, p=0.025 for the overall comparison between study groups) and trended towards marginally wider in the RV compared to the BIV group during LV pacing (98±2 ms vs. 93±2 ms, p=0.056 for the overall comparison between study groups) at all cycle lengths. All other parameters were comparable between the RV and BIV groups. No rabbits in any of the study groups were inducible into sustained ventricular arrhythmias with premature ventricular stimulation.
Figure 1.
Mean ± standard error of (A) ventricular effective refractory period, (B) QT interval, and (C) QT interval at the functional refractory period, pacing from the RV (left panel) and LV (right panel) at cycle lengths of 260 ms, 240 ms, 220 ms, 200 ms, 180 ms, 160 ms, and 140 ms, in both the RV (black) and BIV (gray) groups, after 4 weeks of pacing.
Action Potential Duration
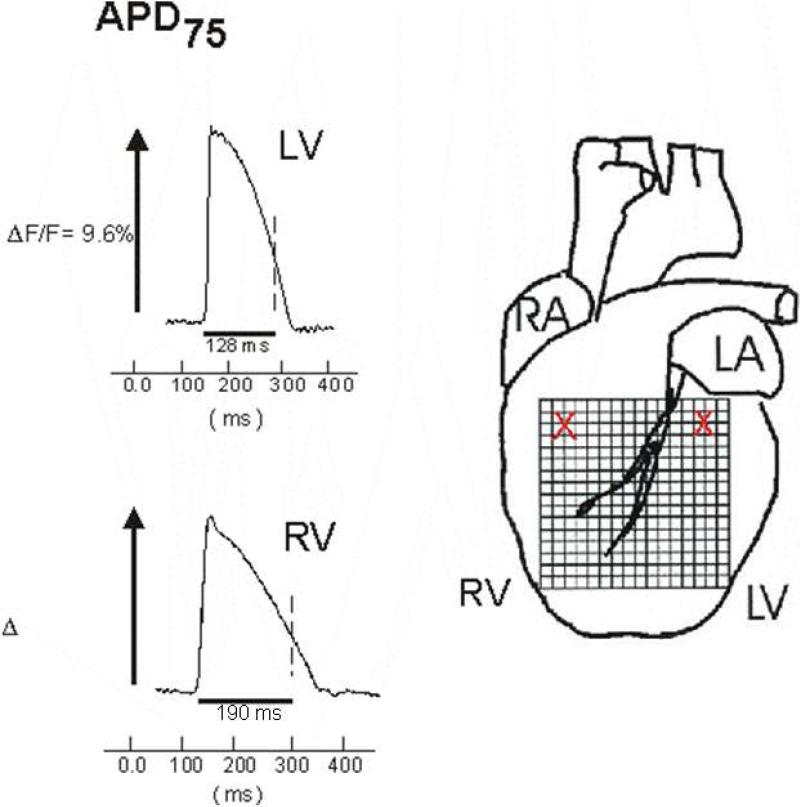
In 4 control rabbits the APD75 was measured in the RV and LV tissue using optical mapping techniques8. In the control rabbits, the mean APD75 duration was significantly longer in the RV compared to LV tissue (143±36 ms vs. 113±15 ms, p=0.001, figure 2).
Figure 2.
Sample action potentials from the RV and LV tissues of a control rabbit obtained by optical mapping. Note the longer baseline action potential duration in the RV compared to LV tissue.
Tissue Analysis
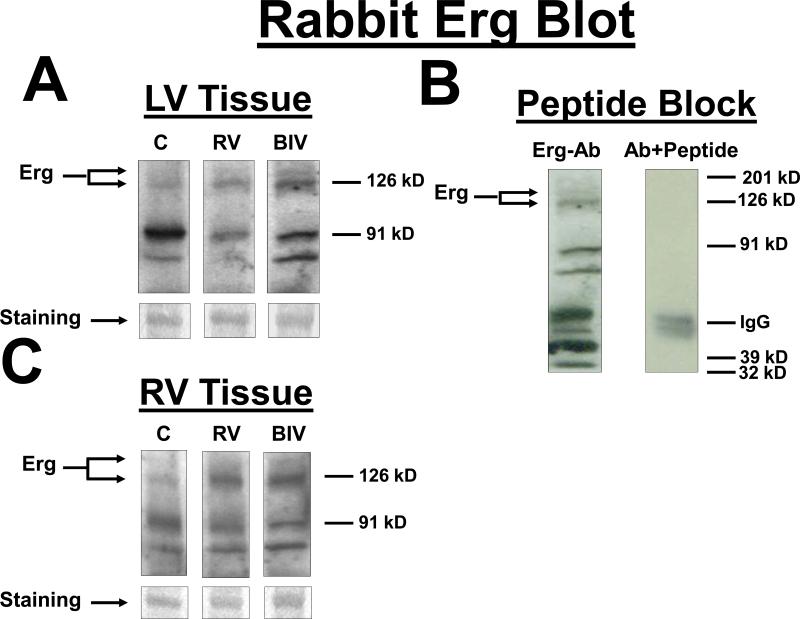
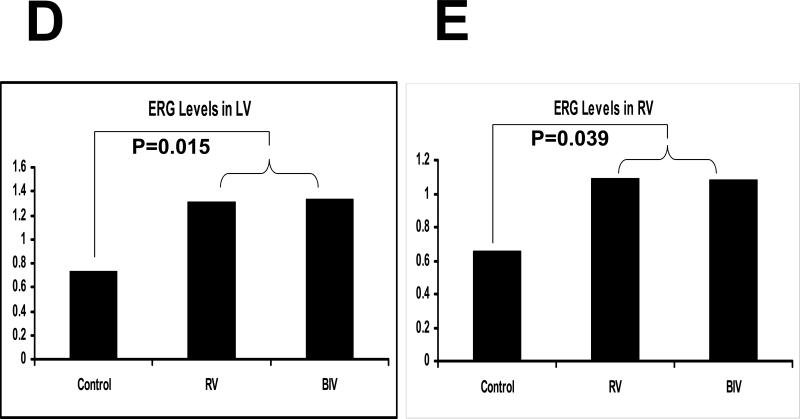
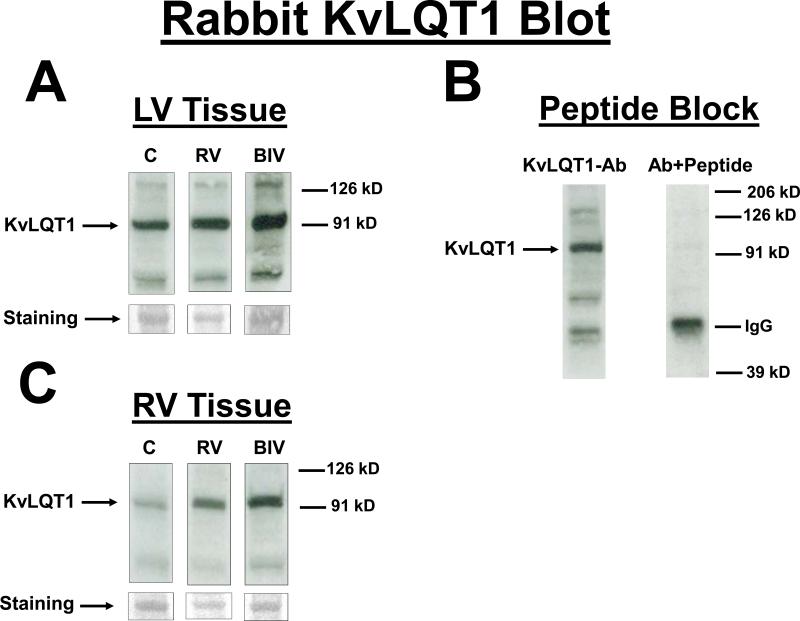
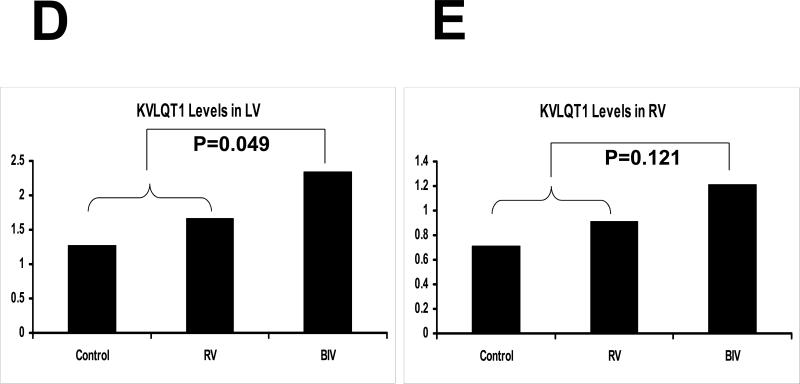
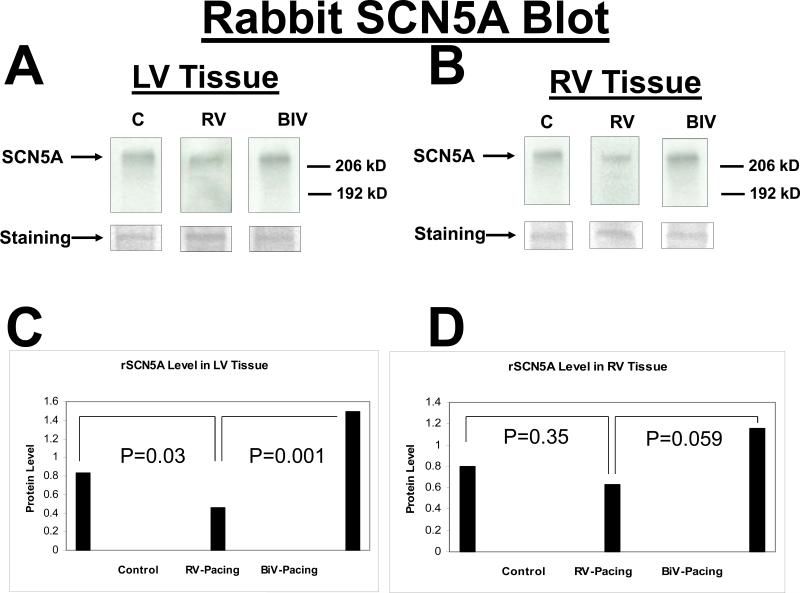
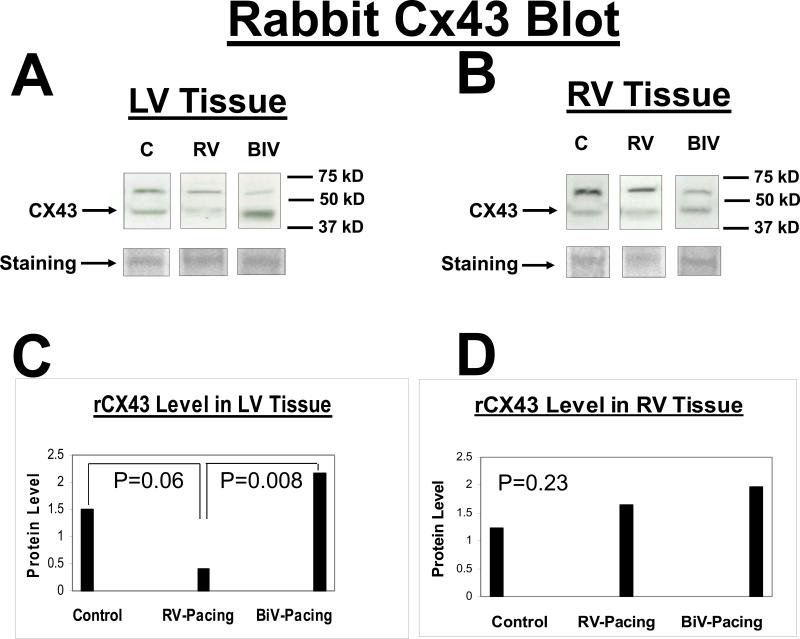
Protein expression of the Kv4.3 gene was similar between the 3 study groups (data not shown). With pacing, the protein expression of the Erg gene in the LV and RV was significantly increased in the RV and BIV groups compared to the sham-operated controls, but there was no difference in expression of the Erg protein between the RV and BIV groups (figure 3). With BIV pacing, the protein expression of the LV but not RV KVLQT1 gene was significantly increased compared to the RV pacing group and the C group, potentially accounting for the shorter repolarization time on surface ECG in the BIV group compared to the 2 other study groups (figure 4). With BIV pacing, the protein expression of SCN5A in the LV was significantly increased compared to the RV pacing group and the C group, and the expression in the RV pacing group was significantly reduced compared to C group. The protein expression of RV SCN5A did not demonstrate significant differences between the study groups (figure 5). Similarly, the protein expression of the LV but not RV connexin43 gene was significantly increased in the BIV pacing group compared to the RV pacing group (figure 6).
Figure 3.
Erg protein blots from LV (A) and RV (C) tissues for the 3 rabbit study groups (C, RV, and BIV). Erg bands as well as the coomessie-stained bands used to normalize for the protein load are shown. Also the Erg bands for the 3 study groups are from the same blot with identical exposure. B: Erg-peptide block, where the blot was exposed to anti-Erg+petide (1:3 ratio). Panels D and E are the graphic representation of the Erg protein levels from LV (D) and RV (E) tissues for the 3 study groups. Note the statistically significant increase in Erg levels in the 2 paced groups combined (RV and BIV) compared to the control group.
Figure 4.
KvLQT1 protein blot from the LV (A) and the RV (C) tissues for the 3 rabbit study groups (C, RV, and BIV). KVLQT1 bands as well as coomessie-stained bands used to normalize for the protein load are shown. Also the KVLQT1 bands for the 3 study groups are from the same blot with identical exposure. B: KVLQT1-peptide block, where the blot was exposed to anti- KVLQT1+petide (1:3 ratio). Panels D and E are the graphic representation of KVLQT1 protein levels from LV (D) and RV (E) tissues for the 3 study groups. Note the statistically significant increase in KVLQT1 levels in the BIV group compared to the combined RV paced and control groups in the LV but not RV extracted tissue.
Figure 5.
SCN5A protein blot from the LV (A) and the RV (B) tissues for the 3 rabbit study groups (C, RV, and BIV). Panels C and D are the graphic representation of SCN5A protein levels from LV (C) and RV (D) tissues for the 3 study groups. Note the statistically significant increase in SCN5A levels in the BIV paced group compared to the RV paced and control groups and the lower SCN5A levels in the RV paced group compared to the C group in the LV but not RV extracted tissue.
Figure 6.
Connexin43 protein blot from the LV (A) and the RV (B) tissues for the 3 rabbit study groups (C, RV, and BIV). Panels C and D are the graphic representation of Connexin43 protein levels from LV (C) and RV (D) tissues for the 3 study groups. Note the statistically significant increase in Connexin43 levels in the BIV paced group compared to the RV paced group in the LV but not RV extracted tissue.
Levels of mRNA for all 4 genes of interest (Erg, KVLQT1, SCN5A, and Connexin43) were not different among these 3 groups of rabbits (data not shown), suggesting a post-transcription mechanism for the differences seen in protein levels between the RV and BIV paced groups, possibly secondary to translation, protein trafficking, or degradation.
Discussion
In this study, we present data on the effect of biventricular pacing on electrical remodeling in the normal rabbit heart. Four weeks of biventricular pacing resulted in significant shortening of the native measured QT interval on the surface ECG as well as a significantly smaller QT index, suggesting a direct effect of the sites of pacing on the repolarizing currents in the ventricular myocardium. This is further supported by the results of the ventricular premature stimulation protocols which demonstrated shortening of the VERP as well as of the LV paced QT intervals at various cycle lengths with BIV versus RV pacing. The increased protein expression of both the KVLQT1 and erg genes provide a molecular correlate for the abbreviated repolarization time in the BIV rabbit hearts.
A possible mechanistic explanation for the findings during invasive electrophysiological testing is that RV as compared to BIV pacing further prolongs the local RV repolarization time beyond the baseline longer action potential duration of RV compared to LV tissue, thus leading to longer RV VERP in the former compared to the latter group. The lack of difference between the study groups in the QT interval during RV pacing is actually due to the early stimulation of the RV tissue with its longer repolarization time. During LV pacing, on the other hand, RV tissue is excited late and therefore its delayed repolarization contributes to the longer global QT interval. The demonstrated differences in the levels of SCN5A and connexin43 proteins mainly seen in LV tissue may also contribute to the shorter repolarization time in BIV compared to RV paced rabbits through mechanisms that may involve modification of the restitution of the sodium channel or alteration of the virtual electrode effect. These mechanisms are suggested by our findings but remain unproven.
A salutary effect of BIV pacing has been demonstrated in heart failure patients with advanced cardiac structural abnormalities1-3. In those patients, evidence of electrical remodeling in the form of shortened QRS duration has been demonstrated in conjunction with improved myocardial function and patient symptoms13. Whether the altered electrical substrate is the result of improved hemodynamics or whether it is a direct effect of altered electrical stimulation is not clear. Our data suggest that the electrical remodeling is at least in part due to a direct effect of pacing, since in our rabbit model, there were no observed structural abnormalities of the heart, except for a minor decrease in fractional area shortening in the RV compared to the BIV paced rabbits, which cannot account for the differences in repolarization parameters documented between the BIV and C groups.
Cardiac repolarization changes after pacing, commonly referred to as ‘cardiac memory’, have been extensively described in the literature6, 7. This phenomenon describes a change in the T wave vector in sinus rhythm on the surface ECG as a result of a preceding period of altered ventricular depolarization such as would happen during pacing or arrhythmia. The altered T wave vector in sinus rhythm reflects the direction of depolarization during pacing or arrhythmia, as if the T wave remembers the direction of the QRS complex during that period, thus the term ‘cardiac memory’. The underlying mechanisms for ‘cardiac memory’ have been studied at the cellular and molecular levels and shown to involve altered ion channel expression and function (mainly the transient outward current Ito) as well as altered myocardial gene expression7. Short term cardiac memory has been shown to induce uniform shortening of ventricular repolarization time by about 10 ms in open-chest dogs paced for 2 hours14. Long term cardiac memory has also been shown to induce T wave changes after 3 weeks of pacing that are maximal close to the site of pacing15. Put together, these results suggest an effect of pacing as well as its site on cardiac repolarization which is also shown by our present data. To our knowledge, however, there are no reports in the literature on the effects of BIV pacing on ‘cardiac memory’.
Whether the documented electrical changes seen with BIV pacing in our model can be attributed to ‘cardiac memory’ seems highly improbable. First, the changes seen with cardiac memory involve mainly a change in the direction of the T wave vector, rather than a change in the QT interval or measured ventricular refractory periods which are the main altered parameters in our current study. Second, rabbits in the control and RV groups did not exhibit the shortening of the native QT interval that was demonstrated in the BIV paced group, suggesting that this shortening was not driven by pacing per se, but rather by the sites of pacing. Whether the mechanisms involved in ‘cardiac memory’ are relevant to our findings cannot be completely ruled out and deserves further investigation.
We had previously demonstrated5 that in a rabbit model of chronic myocardial infarction, BIV pacing, unlike RV pacing or no pacing, restores Erg protein levels almost back to the normal levels documented in non-infarcted rabbits, but does not shorten repolarization time. In our current normal heart model, QT is shortened with BIV pacing but not RV pacing, presumably because of the combined effect of increased expression of both the KVLQT1 and Erg genes. Whether the scar areas present in infarcted hearts create regional delays in repolarzation times that preclude the shortening of the QT interval with BIV pacing despite favorable changes in gene expression is possible but not proven.
The effect of BIV pacing on the burden of ventricular arrhythmias in the failing heart has been investigated with discrepant results16-18. Some studies have suggested an anti-arrhythmic effect of BIV pacing16, 17 while others have reported a pro-arrhythmic effect from BIV pacing18, presumably due to pacing very close to the reentrant circuit in the LV, thus facilitating the induction of reentrant ventricular arrhythmias. Whether the shorter repolarization time documented in our rabbit model, albeit in a normal heart, constitutes one of the mechanisms of reduced ventricular arrhythmia burden with BIV pacing in heart failure patients remains unclear but deserves further investigation.
Due to several inherent characteristics, the rabbit heart has been used for many years as a model for studying the pathophysiology of the human heart19. The fact that the rabbit cardiac action potential is similar to that of humans and the underlying channels and currents are also homologous20-23 has made the rabbit a very attractive species for studying electrophysiological phenomena. Moreover, the rabbits’ size is large enough to accommodate the implantation of permanent pacemakers designed for humans but modified to pace at fast rates. For all these reasons, we chose to use the rabbit in our present study.
The present study has few limitations. First, in our model, pacing the right ventricle was done epicardially, which is different from the endocardial pacing typically used in clinical practice. It is unclear whether this difference affects the extrapolation of our results to humans. Second, we have empirically paced the rabbits in the RV and BIV groups at a rate of 270 beats per minute to ensure near continuous ventricular pacing. At this rate, we cannot rule out with certainty the possibility of a component of tachycardia-induced cardiomyopathy in the paced groups compared to the controls. This is partially supported by the fact that in both the RV and LV groups we documented slightly larger end-systolic and end-diastolic cross sectional areas compared to the control rabbits. There were, however, no significant differences in these parameters between the RV and LV groups, thus excluding the possibility that the observed differences in electrical remodeling between these two study groups are due to differences in myocardial mechanics.
In summary, we present a rabbit model of pacing in the normal heart and demonstrate a direct effect of BIV but not RV pacing on shortening the native QT interval on the surface ECG, shortening the LV paced QT interval during burst pacing at various cycle lengths as well as close to refractoriness, and increased expression of the KVLQT1 protein expression. These findings in a normal heart underscore the fact that the effect of BIV pacing is at least partially mediated through direct electrical remodeling, independent of mechanical phenomena, and may have implications as to the effect of BIV pacing on the incidence and burden of arrhythmias in the failing heart.
Funding Sources
This study was supported by NIH grant K08 HL080106-01 (to SS)
Footnotes
Journal Subject Codes: [106] Electrophysiology; [115] Remodeling; [120] Pacemaker; [130] Animal models of human disease
Conflict of Interest Disclosures: None
Publisher's Disclaimer: This is a PDF file of an unedited manuscript that has been accepted for publication. As a service to our customers we are providing this early version of the manuscript. The manuscript will undergo copyediting, typesetting, and review of the resulting proof before it is published in its final citable form. Please note that during the production process errors may be discovered which could affect the content, and all legal disclaimers that apply to the journal pertain.
References
- 1.Linde C, Leclercq C, Rex S, Garrigue S, Lavergne T, Cazeau S, McKenna W, Fitzgerald M, Deharo JC, Alonso C, Walker S, Braunschweig F, Bailleul C, Daubert JC. Long-term benefits of biventricular pacing in congestive heart failure: results from the MUltisite STimulation in cardiomyopathy (MUSTIC) study. J Am Coll Cardiol. 2002;40:111–118. doi: 10.1016/s0735-1097(02)01932-0. [DOI] [PubMed] [Google Scholar]
- 2.Bristow MR, Saxon LA, Boehmer J, Krueger S, Kass DA, De Marco T, Carson P, DiCarlo L, DeMets D, White BG, DeVries DW, Feldman AM. Cardiac resynchronization therapy with or without an Implantable defibrillator in advanced chronic heart failure. N Engl J Med. 2004;350:2140–2150. doi: 10.1056/NEJMoa032423. [DOI] [PubMed] [Google Scholar]
- 3.Cleland JG, Daubert JC, Erdmann E, Freemantle N, Gras D, Kappenberger L, Tavazzi L, Cardiac Resynchronization-Heart Failure (CARE-HF) Study Investigators The effect of cardiac resynchronization on morbidity and mortality in heart failure. N Engl J Med. 2005;352:1539–1549. doi: 10.1056/NEJMoa050496. [DOI] [PubMed] [Google Scholar]
- 4.Xydas S, Rosen RS, Ng C, Mercando M, Cohen J, DiTullio M, Magnano A, Marboe CC, Mancini DM, Naka Y, Oz MC, Maybaum S. Mechanical unloading leads to echocardiographic, electrocardiographic, neurohormonal, and histologic recovery. J Heart Lung Transplant. 2006;25:7–15. doi: 10.1016/j.healun.2005.08.001. [DOI] [PubMed] [Google Scholar]
- 5.Saba S, Mathier MA, Mehdi H, Gursoy E, Liu T, Choi BR, Salama G, London B. Prevention of adverse electrical and mechanical remodeling with biventricular pacing in a rabbit model of myocardial infarction. Heart Rhythm. 2008;5:124–30. doi: 10.1016/j.hrthm.2007.08.021. [DOI] [PMC free article] [PubMed] [Google Scholar]
- 6.Rosen MR. What is cardiac memory? J Cardiovasc Electrophysiol. 2000;11:1289–1293. doi: 10.1046/j.1540-8167.2000.01289.x. [DOI] [PubMed] [Google Scholar]
- 7.Rosen MR, Cohen IS. Cardiac memory: new insights into molecular mechanisms. J Physiol. 2006;570.2:209–218. doi: 10.1113/jphysiol.2005.097873. [DOI] [PMC free article] [PubMed] [Google Scholar]
- 8.Saba S, Mathier MA, Mehdi H, Liu T, Choi BR, London B, Salama G. Dual-dye optical mapping after myocardial infarction: does the site of ventricular stimulation alter the properties of electrical propagation? J Cardiovasc Electrophysiol. 2008;19:197–202. doi: 10.1111/j.1540-8167.2007.00998.x. [DOI] [PubMed] [Google Scholar]
- 9.Rose J, Armoundas AA, Tian Y, DiSilvestre D, Burysek M, Halperin V, O'Rourke B, Kass DA, Marban E, Tomaselli GF. Molecular correlates of altered expression of potassium currents in failing rabbit myocardium. Am J Physiol Heart Circ Physiol. 2005;288:H2077–H2087. doi: 10.1152/ajpheart.00526.2003. [DOI] [PMC free article] [PubMed] [Google Scholar]
- 10.Mehdi H, Manzi S, Desai P, Chen Q, Nestlerode C, Bontempo F, Strom SC, Zarnegar R, Kamboh MI. A functional polymorphism at the transcriptional initiation site in β2-glycoprotein I (apolipoprotein H) associated with reduced gene expression and lower plasma levels of β2-glycoprotein I. Eur J Biochem. 2003;270:230–238. doi: 10.1046/j.1432-1033.2003.03379.x. [DOI] [PubMed] [Google Scholar]
- 11.Rose J, Armoundas AA, Tian Y, DiSilvestre D, Burysek M, Halperin V, O'Rourke B, Kass DA, Marban E, Tomaselli GF. Molecular correlates of altered expression of potassium currents in failing rabbit myocardium. Am J Physiol Heart Circ Physiol. 2005;288:H2077–H2087. doi: 10.1152/ajpheart.00526.2003. [DOI] [PMC free article] [PubMed] [Google Scholar]
- 12.Brunner M, Peng X, Liu GX, Ren XQ, Ziv O, Choi BR, Mathur R, Hajjiri M, Odening KE, Steinberg E, Folco EJ, Pringa E, Centracchio J, Macharzina RR, Donahay T, Schofield L, Rana N, Kirk M, Mitchell GF, Poppas A, Zehender M, Koren G. Mechanisms of cardiac arrhythmias and sudden death in transgenic rabbits with long QT syndrome. J Clin Invest. 2008;118:2246–2259. doi: 10.1172/JCI33578. [DOI] [PMC free article] [PubMed] [Google Scholar]
- 13.Henrikson CA, Spragg DD, Cheng A, Capps M, Devaughn K, Marine JE, Calkins H, Tomaselli GF, Berger RD. Evidence for electrical remodeling of the native conduction system with cardiac resynchronization therapy. Pacing Clin Electrophysiol. 2007;30:591–595. doi: 10.1111/j.1540-8159.2007.00717.x. [DOI] [PubMed] [Google Scholar]
- 14.Janse MJ, Sosunov EA, Coronel R, Opthof T, Anyukhovsky EP, de Bakker JM, Plotnikov AN, Shlapakova IN, Danilo P, Jr, Tijssen JG, Rosen MR. Repolarization gradients in the canine left ventricle before and after induction of short-term cardiac memory. Circulation. 2005;112:1711–1718. doi: 10.1161/CIRCULATIONAHA.104.516583. [DOI] [PubMed] [Google Scholar]
- 15.Coronel R, Opthof T, Plotnikov AN, Wilms-Schopman FJ, Shlapakova IN, Danilo P, Jr, Sosunov EA, Anyukhovsky EP, Janse MJ, Rosen MR. Long-term cardiac memory in canine heart is associated with the evolution of a transmural repolarization gradient. Cardiovasc Res. 2007;74:416–425. doi: 10.1016/j.cardiores.2007.02.024. [DOI] [PubMed] [Google Scholar]
- 16.Ermis C, Seutter R, Zhu AX, Benditt LC, VanHeel L, Sakaguchi S, Lurie KG, Lu F, Benditt DG. Impact of Upgrade to Cardiac Resynchronization Therapy on Ventricular Arrhythmia Frequency in Patients with Implantable Cardioverter-Defibrillators. J Am Coll Cardiol. 2005;46:2258–2263. doi: 10.1016/j.jacc.2005.04.067. [DOI] [PubMed] [Google Scholar]
- 17.Voigt A, Barrington W, Ngwu O, Jain S, Saba S. Biventricular pacing reduces ventricular arrhythmic burden and defibrillator therapies in patients with heart failure. Clin Cardiol. 2006;29:74–77. doi: 10.1002/clc.4960290208. [DOI] [PMC free article] [PubMed] [Google Scholar]
- 18.Nayak HM, Verdino RJ, Russo AM, Gerstenfeld EP, Hsia HH, Lin D, Dixit S, Cooper JM, Callans DJ, Marchlinski FE. Ventricular Tachycardia Storm After Initiation of Biventricular Pacing: Incidence, Clinical Characteristics, Management, and Outcome. J Cardiovasc Electrophysiol. 2008 doi: 10.1111/j.1540-8167.2008.01122.x. [Epub ahead of print] [DOI] [PubMed] [Google Scholar]
- 19.Toyo-oka T, Kamishiro T, Fumino H, Masaki T, Hosoda S. Rabbit hearts for the critical evaluation of drugs to reduce the size of experimentally produced acute myocardial infarction. Jpn Heart J. 1984;25:623–632. doi: 10.1536/ihj.25.623. [DOI] [PubMed] [Google Scholar]
- 20.Yehia AR, Shrier A, Lo KC, Guevara MR. Transient outward currents contributes to Wenckebach like rhythms in isolated rabbit ventricular cells. Am J Physiol. 1997;273:H1–H11. doi: 10.1152/ajpheart.1997.273.1.H1. [DOI] [PubMed] [Google Scholar]
- 21.Salata JJ, Jurkiewicz NK, Jow B, Folander K, Guinosso PJ, Jr, Raynor B, Swanson R, Fermimi B. IK of rabbit ventricle is composed of two currents: evidence for lKs. Am J Physiol. 1996;271:H2477–H2489. doi: 10.1152/ajpheart.1996.271.6.H2477. [DOI] [PubMed] [Google Scholar]
- 22.Veldkamp MW, van Ginneken AC, Bouman LN. Single delayed rectifier channels in the membrane of rabbit ventricular myocytes. Circ Res. 1993;72:865–878. doi: 10.1161/01.res.72.4.865. [DOI] [PubMed] [Google Scholar]
- 23.Fedida G, Giles WR. Regional variations in action potentials and transient outward currents in myocytes isolated from rabbit left ventricle. J Physiol. 1991;442:191–209. doi: 10.1113/jphysiol.1991.sp018789. [DOI] [PMC free article] [PubMed] [Google Scholar]


