Abstract
Endovenous laser ablation (EVLA) is commonly used to treat saphenous varicosities. Very high temperatures at the laser fibre tip have been reported during EVLA. We hypothesized that the laser irradiation deposits a layer of strongly absorbing carbonized blood of very high temperature on the fibre tip. We sought to prove the existence of these layers and study their properties by optical transmission, optical coherence tomography (OCT) and microscopy. We analysed 23 EVLA fibres, 8 used at 810 nm, 7 at 940 nm and 8 at 1,470 nm. We measured the transmission of these fibres in two wavelength bands (450–950 nm; 950–1,650 nm). We used 1,310 nm OCT to assess the thickness of the layers and the attenuation as a function of depth to determine the absorption coefficient. Microscopy was used to view the tip surface. All fibres showed a slightly increasing transmission with wavelength in the 450–950 nm band, and a virtually wavelength-independent transmission in the 950–1,650 nm band. OCT scans showed a thin layer deposited on all 13 fibres investigated, 6 used at 810 nm, 4 at 940 nm and 3 at 1,470 nm, some with inhomogeneities over the tip area. The average absorption coefficient of the 13 layers was 72 ± 16 mm−1. The average layer thickness estimated from the transmission and absorption measurements was 8.0 ± 2.7 µm. From the OCT data, the average maximal thickness was 26 ± 6 µm. Microscopy of three fibre tips, one for each EVLA wavelength, showed rough, cracked and sometimes seriously damaged tip surfaces. There was no clear correlation between the properties of the layers and the EVLA parameters such as wavelength, except for a positive correlation between layer thickness and total delivered energy. In conclusion, we found strong evidence that all EVLA procedures in blood filled veins deposit a heavily absorbing hot layer of carbonized blood on the fibre tip, with concomitant tip damage. This major EVLA mechanism is unlikely to have much wavelength dependence at similar delivered energies per centimetre of vein. Optical–thermal interaction between the vein wall and the transmitted laser light depends on wavelength.
Keywords: Phlebology; Endovenous laser ablation; 810, 940, 1,470 nm; Deposited layer on fibre tip; Transmission; OCT; Layer thickness; Layer absorption; Fibre tip damage
Introduction
Endovenous laser ablation (EVLA) is now commonly used as a minimally invasive technique to treat saphenous varicose veins. EVLA has a high success rate of over 90% after several years of follow-up studies and a minimal complication rate compared with traditional ligation plus stripping [1]. Despite the excellent performance of EVLA the exact mechanism of action is still not fully identified. This uncertainty may have stimulated the current, commercially driven proliferation of different laser wavelengths (810 nm, 840 nm, 940 nm, 980 nm, 1,064 nm, 1,320 nm, 1,470 nm), powers and pullback velocities. We hypothesized that improved knowledge of the mechanism of action of EVLA would stimulate the achievement of a consensus on the best laser method. This would reduce costs and improve clinical outcomes.
Several potential mechanisms of EVLA have been proposed: first, the optical–thermal response of the vein wall to scattered laser light [2]; second, the thermal response of the vein wall to condensing steam bubbles [3]; third, the direct contact between the hot fibre tip and the wall [4, 5]; and fourth, the thermal response of the vein wall to heat diffusion from the hot fibre tip. The last of these mechanisms, recently proposed by our group [6], is based on measured tip temperatures close to or exceeding 1,000°C [7, 8], sometimes causing melting of the tip [5]. We hypothesized that such high temperatures can only occur when a strongly absorbing layer of carbonized blood is deposited on the fibre tip—and thus concomitantly heated by the laser irradiation—during EVLA procedures.
To date, such layers have not been described, let alone their properties such as thickness, homogeneity, and transmission and absorption measured. We sought to show the existence of these layers, examine their properties and derive the relationships with EVLA parameters.
Materials and methods
Clinical laser procedures
The EVLA wavelengths used were 810 nm (Diomed), 940 nm (Diomed) and 1,470 nm (BioLitec ELVeS). All catheters used a bare fibre of 0.6 mm core diameter. The clinical EVLA procedures were performed in accordance with the standard protocols used in our clinic, including tumescent anaesthesia. Laser parameters (pullback velocity, power) were such that on average 50–60 J/cm vein was administered. At the end of the procedure, the fibre was carefully withdrawn out of the treated vein and stored in a box. No contact was made between the fibre tip and the wall of the box. The next day, the fibre was transported from the clinical site (Rotterdam) to the laboratory (Amsterdam) for the optical measurements.
Optical transmission measurements
The transmission coefficient (T) of the clinical fibre was defined as the light intensity transmitted by the fibre divided by the light intensity transmitted by an identical but unused clean fibre. Fibre transmission was measured over two wavelength bands (450 to 950 nm and 950 to 1,650 nm) using two different set-ups available in our laboratory. To measure the transmission between 450 and 950 nm a tungsten-halogen light source (Ocean Optics, DH-2000) was used. A commercial CCD spectrometer (Ocean Optics, USB4000) was used for wavelength selection and photo detection. To measure the transmission between 950 and 1,650 nm another halogen light source (Dolan Jenner, PL800) with a wavelength range of 400 nm up to 2,000 nm was used. Wavelength selection was achieved by a monochromator (Oriel Monochromators, Cornerstone 130 1/8 m) with a spectral resolution of 10 nm. A long-pass filter (Thorlabs, FEL0950) with a cut-on wavelength of 950 nm was implemented in front of the monochromator input slit to minimize the effect of high-order diffraction. The light intensity was detected by a photoreceiver (New Focus, model 2011) and the output signal of the photoreceiver was captured by a data acquisition card (National Instrument, USB-6009) and stored on a personal computer (Dell).
OCT imaging
A Santec swept source optical coherence tomography (OCT) system was used in this study (HSL 2000). The system is based on a Michelson interferometer that measures the amplitude of the light back-scattered from the sample [9]. The swept light source has a central wavelength of 1,310 nm and a wavelength band of 110 nm. The scan speed is up to 50 kHz. The axial resolution is determined by the coherence length of the source, which was 11 µm in air. The lateral resolution is determined by the confocal image properties of the system and was about 10 µm. A three-dimensional scan had 155 × 400 × 249 pixels. Three-dimensional scans of the fibre tips were made to image the structure of the layers. A two-dimensional B-scan had 1,019 × 4,000 pixels. Two-dimensional scans where performed along lines over the fibre tip area versus depth to determine the attenuation coefficient and the thickness of the deposited layer. The attenuation coefficient of the layer was derived from the OCT data by fitting Beer’s law to the averaged A-scan within the region of interest in the OCT image (Fig. 1). The starting point was chosen as three pixels past the specular reflection peak.
Fig. 1.
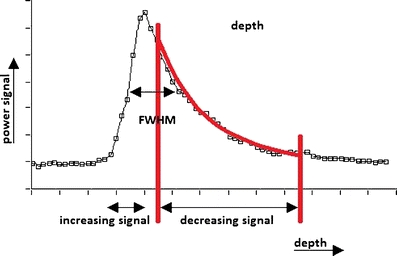
A typical deconvoluted OCT signal versus depth of a layer deposited on a fibre tip. The vertical axis is the amplitude signal and the horizontal axis is the depth. The red lines indicate the region of interest of the fit to Eq. 1. The maximum layer thickness, d max, was determined from the full-width at half-maximum (FWHM). The distance between the pixels (white squares) is 4.3 µm, based on a layer of assumed refractive index of 1.5
OCT signal analysis
The OCT signals were corrected for the noise level, defined as the average signal between pixels 10 and 30 before the specular reflection peak. Prior to fitting, all A-scans were aligned. We assumed that the spatial curve decay followed the first-order scattering approximation
 |
1 |
Here, A(z) is the back-scattered amplitude from depth z and µ a is the absorption coefficient, here expected to be virtually equal to the attenuation coefficient (but see Discussion).
Deconvolution and absorption coefficient
Because the thickness of the layers was in the order of or only a few times greater than the axial resolution of the OCT system, deconvolution processing was considered necessary. The measured OCT signal (m[p], p denotes pixels, see Fig. 1) of the clinical fibre is the convolution of the “true” nondistorted signal (x[p]) and the impulse response (y[p]) of the system; hence, m[p] = x[p]*y[p], where “*” denotes the convolution integral operator. The impulse response was the OCT signal of the clean fibre. We implemented discrete deconvolution, deriving x[p] from the inverse Fourier transform of m[ω]/y[ω] where m[ω] and y[ω] are the Fourier transforms of m[p] and y[p], respectively.
To determine the absorption coefficient, an average of 4,000 A-scans was performed over a tissue depth of 100 µm of the fibre tip. For each fibre, an average of three scans, from different positions on the fibre tip area, was used to determine the absorption coefficient by fitting the decreasing deconvoluted part of A(z) to Eq. 1 (Fig. 1).
Microscopy
Tips were detached from the fibre at a length of about 1.5 cm. They were cleaned for about 30 min in a strong acid and remains of the carbonized blood were manually removed by rubbing with paper tissues. The tip surfaces were viewed under a microscope and photographed.
Statistical analyses
ANOVA was used to compare the transmissions at the three EVLA wavelengths, and total energy administered versus wavelength and power. We used a multiple linear regression model to estimate the association between transmission and cumulative Joules administered after adjusting for wavelength. The Pearson correlation coefficients (r) were calculated between, respectively, mean thickness and maximum thickness of the layer and wavelength, total energy administered, and transmission. Significance was assumed if p < 0.05.
Results
A total of 23 clinical fibres were analysed. Table 1 shows the fibre number corresponding with EVLA wavelength, power, total delivered energy and transmission at 1,310 nm. Not all 23 fibres could be used for all optical measurements because not all equipment was always available the day after therapy.
Table 1.
Fibre number, EVLA wavelength, laser power, total delivered energy, and measured transmission at 1,310 nm
| Fibre number/patient | EVLA wavelength (nm) | Laser power (W) | Total delivered energy (J) | Transmission at 1,310 nm |
|---|---|---|---|---|
| 1/18 | 810 | 14 | 1,700 | 0.46 |
| 2/17 | 810 | 14 | 519 | 0.71 |
| 3/16 | 810 | 14 | 1,097 | 0.58 |
| 4/15 | 810 | 14 | 508 | 0.58 |
| 5/25 | 810 | 14 | 446 | 0.72 |
| 6/26 | 810 | 14 | 2350 | 0.63 |
| 7/27 | 810 | 14 | 1963 | 0.57 |
| 8/28 | 810 | 14 | 1270 | 0.48 |
| 9/21 | 940 | 20 | 626 | 0.70 |
| 10/20 | 940 | 20 | 2,515 | 0.56 |
| 11/14 | 940 | 20 | 1,898 | 0.57 |
| 12/13 | 940 | 20 | 2,178 | 0.33 |
| 13/5 | 940 | 20 | 1,640 | 0.57 |
| 14/4 | 940 | 20 | 2,108 | 0.44 |
| 15/2 | 940 | 20 | 1,886 | 0.67 |
| 16/23 | 1,470 | 8 | 1,450 | 0.61 |
| 17/12 | 1,470 | 8 | 1,144 | 0.65 |
| 18/11 | 1,470 | 8 | 1,140 | 0.69 |
| 19/10 | 1,470 | 8 | 1,880 | 0.56 |
| 20/9 | 1,470 | 8 | 817 | 0.55 |
| 21/8 | 1,470 | 8 | 2,105 | 0.46 |
| 22/7 | 1,470 | 8 | 1,103 | 0.40 |
| 23/6 | 1,470 | 5 | 1,746 | 0.53 |
| Average ± SD | 1,482 ± 627 | 0.57 ± 0.10 |
Transmission measurements
Figure 2 shows the transmissions in the 450–950 nm wavelength band of 13 fibres, 4 used at 810 nm, 2 at 940 nm and 7 at 1,470 nm. The transmission spectra increased slightly with wavelength, in a manner quite similar for each EVLA wavelength. Of the 13 transmission spectra, 3 (fibres 12, 17 and 21) showed signs of oxyhaemoglobin absorption at 542 nm and 577 nm. We hypothesized that this behaviour was caused by deposited blood that remained on the tip, either from noncoagulated blood still present in the vein or from leakage onto the sheets covering the patient’s leg during EVLA. Vaporization of the water out of the red blood cells between withdrawal and measurement the next day may have been the reason for the lack of the typical water absorption peaks at 1,230 and 1,450 nm [10].
Fig. 2.
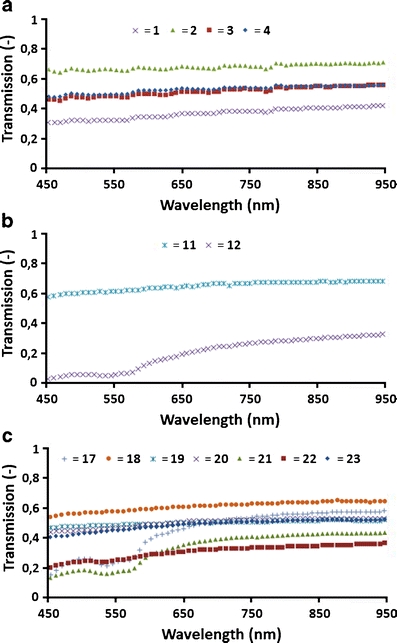
Transmission of 13 fibres in the 450 to 950 nm band. a Fibres 1–4 were used clinically at 810 nm. b Fibres 11 and 12 were used clinically at 940 nm. c Fibres 17–23 were used clinically at 1,470 nm
Figure 3 shows the transmissions in the 950–1,650 nm wavelength band of all 23 fibres. Each of the three EVLA wavelengths used showed virtually wavelength-independent transmission, with values between 0.33 and 0.72 at 1,310 nm, or 0.57 ± 0.10 (average ± SD).
Fig. 3.
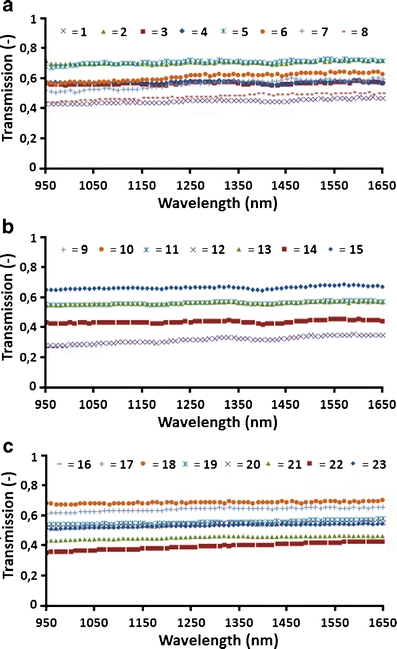
Transmission of 23 fibres in the 950 to 1,650 nm band. a Fibres 1–8 were used clinically at 810 nm. b Fibres 9–15 were used clinically at 940 nm. c Fibres 16–23 were used clinically at 1,470 nm
Three-dimensional OCT scans
Three-dimensional OCT scans were made of 13 fibres, 6 used at 810 nm, 4 at 940 nm, and 3 at 1,470 nm. Figure 4 shows scans of fibres used at 810 nm (Fig. 4a, b), at 940 nm (Fig. 4c, d), at 1,470 nm (Fig. 4e, f), and of an unused clean fibre (Fig. 4g, h). Some OCT scans showed inhomogeneous structures.
Fig. 4.
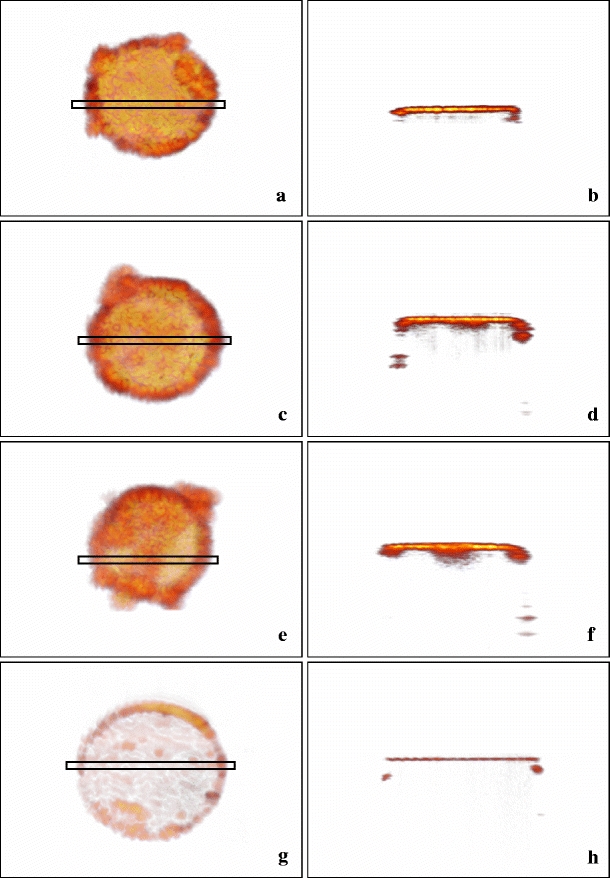
Three-dimensional OCT scans of clinical fibres: left column top views, right column cross sections (location indicated by the rectangles in the left images). a, b Fibre 3 used at 810 nm. c, d Fibre 6 used at 940 nm. e, f Fibre 13 used at 1,470 nm. g, h Unused fibre. The thickness (h) equals the OCT resolution of about 11 μm. The darker areas (left), corresponding with the deeper parts of the layers (right) are likely holes (as in Fig. 5), here filled with carbonized blood. These holes are the sites where d max was measured
Thickness and absorption coefficient of layers
The results for the 13 fibres are presented in Table 2. For convenience, we assumed a refractive index n of 1.5, first because the OCT scans lack clear Fresnel reflected peaks at layer–glass transitions, so the refractive index is probably close to the value of glass and second because refractive indices of tissues with a low water content are about 1.5 [11]. Then we obtained absorption coefficients between 36 mm−1 and 98 mm−1, or µ a=72 ± 16 mm−1 (average ± SD).
Table 2.
Fibre number, EVLA wavelength, average absorption coefficient, μ
a, of three measurements per fibre, the average value of the layer thickness,  , determined from Eq. 3, and the maximal thickness, d
max, determined from two-dimensional OCT images
| Fibre number | EVLA wavelength (nm) | µ a (mm−1) |
 (µm) (µm) |
d max (µm) |
|---|---|---|---|---|
| 3 | 810 | 72 | 7.6 | 19 |
| 4 | 810 | 80 | 6.8 | 23 |
| 5 | 810 | 52 | 6.3 | 27 |
| 6 | 810 | 44 | 10.5 | 28 |
| 7 | 810 | 90 | 6.2 | 31 |
| 8 | 810 | 74 | 9.9 | 31 |
| 9 | 940 | 78 | 4.6 | 17 |
| 10 | 940 | 66 | 8.8 | 23 |
| 11 | 940 | 80 | 7 | 25 |
| 12 | 940 | 82 | 13.5 | 36 |
| 16 | 1,470 | 72 | 6.9 | 22 |
| 17 | 1,470 | 98 | 4.4 | 26 |
| 19 | 1,470 | 52 | 11.2 | 28 |
| Average ± SD | 72 ± 16 | 8.0 ± 2.7 | 26 ± 6 |
Due to the inhomogeneous structure of some of the layers, layer thickness was not always constant. For example, the layer depicted in Fig. 4e shows variable transparency, indicating variable thickness. The average thickness  of the layer can be calculated, because the measured transmission, T, and the measured absorption coefficient, µ
a, both at 1,310 nm, are related by Beer’s law, i.e.
 |
2 |
Hence,
 |
3 |
The average thickness  was between 4.4 and 13.5 µm, or
  =8.0 ± 2.7 µm (average ± SD). Due to the lack of a good criterion, the maximum thickness of the layer, d
max, was defined as the full-width at half-maximum of the two-dimensional OCT images (Fig. 1). The d
max was between 17 and 36 µm, or d
max=26 ± 6 µm (average ± SD).
Microscopy
Three fibre tips were investigated, one for each EVLA wavelength. All showed a damaged, cracked irregular surface, two with clear depth irregularities. Figure 5 shows, as an example, an EVLA fibre used at 1,470 nm (fibre 20), with a severely damaged tip surface.
Fig. 5.
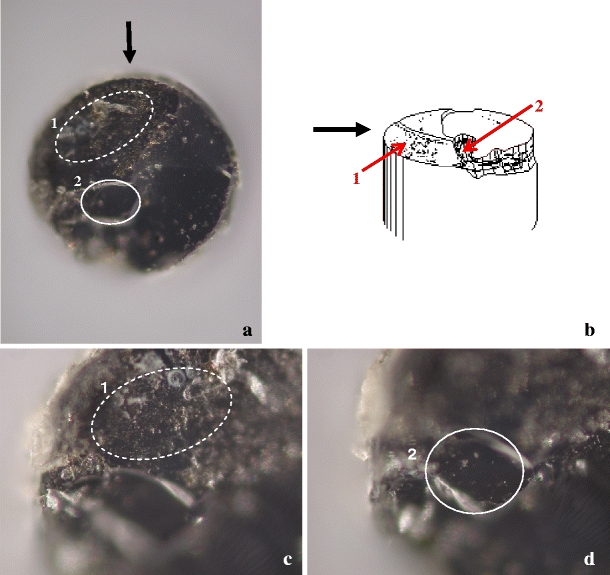
Tip of EVLA fibre 20 used at 1,470 nm photographed through a microscope; the fibre diameter is 0.6 mm. a Overview ( × 10). Two damaged areas (1 and 2) are indicated. b Artist’s impression. Black arrow indicates the direction of view indicated in a. The red arrows point to areas 1 and 2. c Image focused on irregular and cracked area 1 (×20). d Image focused 29 μm lower than c on area 2 (×20)
Correlation between parameters
The 23 transmissions measured at 1,310 nm (Table 1) showed no difference between the three EVLA wavelengths studied (ANOVA, p=0.71). However, transmission was significantly negatively associated with cumulative Joules after adjusting for wavelength (β=−0.47, p=0.028). Total delivered energy showed no correlation with wavelength (β=0.003), nor with laser power (β=−0.24). This implies an approximately inverse relationship between power and irradiation time (r=−0.55). In the 13 OCT measurements, mean thickness was not correlated with EVLA wavelength (r=−0.08), but was correlated moderately with cumulative Joules (r=0.61) and excellently with transmission (r=−0.77). For the maximum thickness versus wavelength, Joules and transmission, the r values were similar (r=−0.08, 0.45 and −0.65, respectively). The absorption coefficient was not correlated with EVLA wavelength (r=−0.03). Further, mean thickness was slightly negatively correlated with absorption coefficient (r=−0.42), which may suggest that a thinner layer has a more compact structure, but maximum thickness was not correlated with absorption coefficient (r=0.02).
Discussion
All 13 fibres available for OCT, from all three EVLA wavelengths used, had a thin layer of deposited carbonized blood, and neither the thickness nor the absorption coefficient of the layers correlated with the EVLA wavelength used. Further support for lack of EVLA wavelength dependence comes from the transmission spectra of all 23 fibres which also did not correlate with the EVLA wavelength. This strongly supports the assertion that the other ten fibres, also from the three EVLA wavelengths, had very similar deposited layers of carbonized blood on their tips. Even following EVLA at 1,470 nm (commercially introduced because of the hypothesized but unproven advantage of a very high absorption of the water component in blood and vein wall) a deposited layer was present with the same properties as the layers formed during EVLA at 810 and 940 nm. Some layers showed an inhomogeneous structure, implying that the average thickness,  =8.0 ± 2.7 µm, differs from the maximal thickness, d
max=26 ± 6 µm.
The average absorption coefficient of the layers was µ a=72 ± 16 mm−1. When irradiated with 5 to 20 W from 0.6-mm diameter fibres (irradiances, I, between 1,770 and 7,080 W/cm2), such very high absorptions would indeed be expected to cause the very high tip temperatures reported, i.e. at 810 nm [5, 8], 980 nm [12], and 1,064 nm [7]. At 1,320 nm, in vitro simulation of a serious complication of EVLA at 1,320 nm [13] strongly supports the conclusion that very high temperatures also occur during EVLA at 1,320 nm. Here, when the laser tip was located inside—rather than outside—a blood-filled catheter, explosive disconnection of the catheter occurred, whereas nothing happened when the catheter was filled with saline. Combining this observation with our findings that the layers deposited during EVLA at 1,470 nm are not different from the layers deposited at 810 and 940 nm warrants the conclusion that EVLA at 1,470 nm also causes very high temperatures at the fibre tip.
Consequences of these high temperatures were demonstrated by microscopy of some of the fibre tips For example, Fig. 5 shows the severely damaged tip of an EVLA fibre used at 1,470 nm, with a large and very rough surface part and a smaller rather flat part where focussing required a 29 μm upward movement of the tip area, implying that this tip volume was probably ejected during the EVLA procedure. Similar surface pictures of the two other fibres were obtained (not shown). We therefore hypothesize that the darker regions in the left parts of Fig. 4, which correspond to the deeper dark parts in the right pictures, indicate holes in the tip surface, as in Fig. 5, but filled with carbonized blood. In these holes the maximal thickness, d max, was measured.
The OCT scans and fits to Eq. 1 basically give the attenuation coefficients µ t=µ a+µ s, with scattering coefficient µ s, implying that the true absorption coefficients are smaller than those given in Table 2. Unfortunately, we had no means available to determine the scattering coefficient of the layers. However, assuming that our layers can be compared with compacted soot which has approximately the density of charcoal, our data agree reasonably well with the 30 mm−1 at a wavelength of 10 μm quoted under such circumstances by McKenzie [14]. Scattering coefficients of carbonized tissue are not available to the best of our knowledge but a scattering coefficient of about 21 mm−1 has been reported for coagulated bovine liver at a wavelength of 980 nm [15]. If carbonized blood can be assumed to have a similar value, which however is not certain, then our absorption coefficients would be smaller by about 30%.
Several candidate mechanisms have been proposed for EVLA. First, our transmission measurements prove that laser irradiation remains available for direct heating of the vein wall by absorption of light as analysed by Mordon et al. [2]. However, this mechanism can only account for a small proportion of EVLA efficacy because the layer of carbonized blood absorbs between 30% and 70% of the light exiting the fibre tip, except perhaps for veins emptied of blood (see next paragraph). Second, the presence of a thin, heavily absorbing layer on the fibre tip during EVLA, shown in this study, strongly suggests that measured fibre tip temperatures of up to 1,200°C occur for any EVLA wavelength clinically in use. Thus, a major EVLA mechanism of action is the vein wall’s thermal response to heat diffusion from the hot fibre tip, as we have previously proposed [6]. The remaining two mechanisms are consequences of these high tip temperatures. Third, steam bubbles developing at the tip which damage the vein wall centimetres away when condensing [3, 5]. The importance of this mechanism remained unproven until recently, when our group identified the underlying physics of the exceptional efficacy of boiling vapour bubbles in transferring the heat from the hot fibre tip to the vein wall (van der Geld et al., submitted for publication). Finally fourth, direct contact between the hot fibre tip and the wall [4, 5], actually also contributing to the development of the black layer on the fibre tip [16]. The wall perforations resulting from this contact are thus likely with all EVLA wavelengths in use.
Recently, Mordon and associates advocated that EVLA should be performed in a vein lumen drained of its blood by, for example, leg elevation and manual compression [17]. Obviously, our results only apply to EVLA performed in blood-filled veins.
In conclusion, we found strong evidence that all EVLA procedures in blood-filled veins deposit a heavily absorbing and thus exceedingly hot layer of carbonized blood on the fibre tip, causing concomitant tip damage. This major EVLA mechanism is not likely to have much wavelength dependence at similar delivered Joules per centimetre of vein. Optical–thermal interaction between the vein wall and the transmitted laser light depends on wavelength.
Acknowledgement
We acknowledge a fruitful discussion with Dr. Jeroen Kalkman (Amsterdam).
Open Access
This article is distributed under the terms of the Creative Commons Attribution Noncommercial License which permits any noncommercial use, distribution, and reproduction in any medium, provided the original author(s) and source are credited.
References
- 1.Van den Bos R, Arends L, Kockaert M, Neumann M, Nijsten T. Endovenous therapies of lower extremity varicosities: a meta-analysis. J Vasc Surg. 2009;49:230–239. doi: 10.1016/j.jvs.2008.06.030. [DOI] [PubMed] [Google Scholar]
- 2.Mordon SR, Wassmer B, Zemmouri J. Mathematical modeling of 980-nm and 1320-nm endovenous laser treatment. Lasers Surg Med. 2007;39:256–265. doi: 10.1002/lsm.20476. [DOI] [PubMed] [Google Scholar]
- 3.Proebstle TM, Lehr HA, Kargl A, Espinola-Klein C, Rother W, Bethge S, Knop J. Endovenous treatment of the greater saphenous vein with a 940 nm diode laser: thrombotic occlusion after endoluminal thermal damage by laser-generated steam bubbles. J Vasc Surg. 2002;35:729–736. doi: 10.1067/mva.2002.121132. [DOI] [PubMed] [Google Scholar]
- 4.Fan C-M, Anderson RR. Endovenous laser ablation: mechanism of action. Phlebology. 2008;23:206–213. doi: 10.1258/phleb.2008.008049. [DOI] [PubMed] [Google Scholar]
- 5.Disselhoff BC, Rem AI, Verdaasdonk RM, Kinderen DJ, Moll FL. Endovenous laser ablation: an experimental study on the mechanism of action. Phlebology. 2008;23:69–76. doi: 10.1258/phleb.2007.007038. [DOI] [PubMed] [Google Scholar]
- 6.Van den Bos RR, Kockaert MA, Neumann HAM, Bremmer RH, Nijsten T, Van Gemert MJC. Heat conduction from the exceedingly hot fiber tip contributes to the endovenous laser ablation of varicose veins. Lasers Med Sci. 2009;24:247–251. doi: 10.1007/s10103-008-0639-y. [DOI] [PubMed] [Google Scholar]
- 7.Verdaasdonk RM, Holstege FC, Jansen ED, Borst C. Temperature along the surface of modified fiber tips for Nd:YAG laser angioplasty. Lasers Surg Med. 1991;11:213–222. doi: 10.1002/lsm.1900110304. [DOI] [PubMed] [Google Scholar]
- 8.Weiss RA. Comparison of endovenous radiofrequency versus 810 nm diode laser occlusion of large veins in an animal model. Dermatol Surg. 2002;28:56–61. doi: 10.1046/j.1524-4725.2002.01191.x. [DOI] [PubMed] [Google Scholar]
- 9.de Bruin DM, Burnes DL, Loewenstein J, Chen Y, Chang S, Chen TC, Esmaili DD, de Boer JF. In vivo three-dimensional imaging of neovascular age-related macular degeneration using optical frequency domain imaging at 1050 nm. Invest Ophthalmol Vis Sci. 2008;49:4545–4552. doi: 10.1167/iovs.07-1553. [DOI] [PubMed] [Google Scholar]
- 10.Roggan A, Friebel M, Dörschel K, Hahn A, Müller G. Optical properties of circulating human blood in the wavelength range 400–2500 nm. J Biomed Opt. 1999;4:36–46. doi: 10.1117/1.429919. [DOI] [PubMed] [Google Scholar]
- 11.Bolin FP, Preuss LE, Taylor RC, Ference RJ. Refractive index of some mammalian tissues using a fiber optic cladding method. Appl Opt. 1989;28:2297–2303. doi: 10.1364/AO.28.002297. [DOI] [PubMed] [Google Scholar]
- 12.Meissner OA, Schmedt C-G, Hunger K, Hetterich H, Sroka R, Rieber J, Babaryka G, Steckmeier BM, Reiser M, Siebert U, Mueller-Lisse U. Endovascular optical coherence tomography ex vivo: venous wall anatomy and tissue alterations after endovenous therapy. Eur Radiol. 2007;17:2384–2393. doi: 10.1007/s00330-007-0593-2. [DOI] [PubMed] [Google Scholar]
- 13.van den Bos RR, Neumann M, de Roos K-P, Nijsten T. Endovenous laser ablation – induced complications: review of the literature and new cases. Dermatol Surg. 2009;35:1206–1214. doi: 10.1111/j.1524-4725.2009.01215.x. [DOI] [PubMed] [Google Scholar]
- 14.McKenzie AL. A three-zone model of soft tissue damage by a CO2 laser. Phys Med Biol. 1986;31:967–983. doi: 10.1088/0031-9155/31/9/003. [DOI] [PubMed] [Google Scholar]
- 15.Germer CT, Roggan A, Ritz J, Isbert C, Albrecht D, Muller G, Buhr HJ. Optical property of native and coagulated human liver tissue and liver metastases in the near infrared region. Lasers Surg Med. 1998;23:194–203. doi: 10.1002/(SICI)1096-9101(1998)23:4<194::AID-LSM2>3.0.CO;2-6. [DOI] [PubMed] [Google Scholar]
- 16.Vuylsteke M, Van Dorpe J, Roelens J, De Bo T, Mordon S, Fourneau I (2009) Intraluminal fibre-tip centring can improve endovenous laser ablation: a histological study. Eur J Vasc Endovasc Surg. doi:10.1016/j.ejvs.2009.09.013 [DOI] [PubMed]
- 17.Mordon S, Wassmer B, Servell P, Desmyttère J, Grard C, Stalnikiewicz G. Is a vein filled with blood a good model for studying endovenous laser ablation? Lasers Surg Med. 2009;41:543–544. doi: 10.1002/lsm.20809. [DOI] [PubMed] [Google Scholar]


