Summary
An abdominal aortic aneurysm (AAA) is the area of a localized widening of the abdominal aorta, with a frequent presence of thrombus. A ruptured aneurysm can cause death due to severe internal bleeding. Segmentation and quantitative analysis of the thrombus in AAA are of paramount importance for diagnosis, risk assessment, and determination of treatment options. Until now, only a small number of methods for thrombus segmentation and analysis have been presented in the literature, either requiring substantial user interaction or exhibiting insufficient performance. We propose a novel method offering minimal user interaction and high accuracy. The thrombus segmentation method utilizes the power and flexibility of double surface 3-D graph search using a triangular mesh. Edge-based cost functions for the luminal and thrombotic surfaces are used for the graph search. For situations, in which local image ambiguity causes local failures, interactively defined control points are used to guide the computer thrombus segmentation without the need to manually trace thrombus contours slice by slice. The method was tested in 9 3-D MDCT angiography datasets (9 patients with AAA, 1300 image slices), and the mean unsigned errors for the luminal and thrombotic surfaces were 0.99 ± 0.18 mm and 1.90 ± 0.72 mm. To achieve these results, 9.9 ± 10.3 control points needed to be interactively entered on 2.1 ± 2.2 image slices per 3-D CTA dataset.
Keywords: Abdominal aortic aneurysm (AAA), Thrombus, Segmentation, 3-D graph search, Computed tomography angiography (CTA)
1. Introduction
Abdominal aortic aneurysm (AAA) is an abnormal expansion of the abdominal aorta resulting from a weakening of the vessel wall and is typically defined as a greater than 50% increase in normal blood vessel diameter. It is a major source of morbidity and mortality for those 65 years of age and older with approximately 200,000 people diagnosed annually in the United States alone. The risk factors for AAA are similar to those for heart disease with smoking being a main risk factor. Atherosclerosis is a common associated finding, and statin therapy has been shown to significantly decrease rate of aneurysm growth and risk for rupture. While hypertension has not been a consistently identified risk factor, angiotensin-converting-enzyme inhibitors have been associated with decreased risk of aneurysm rupture [1]. Aneurysms are typically slow to develop and are often asymptomatic prior to rupturing. Mortality increases dramatically after rupture with only 10% survival to surgery [2]. The risk of rupture increases ten-fold for aneurysms 5.5 cm in diameter making this a measurement at which surgical repair is considered [3]. There are two approaches to aneurysm repair. The traditional surgical approach involves a portion of the abnormal vessel being resected and replaced with a graft. This is an extensive procedure requiring cross clamping of the aorta and carries an operative mortality rate in excess of 40%. Those that survive the surgery are faced with long recovery times and high perioperative morbidity. The alternative method is minimally invasive and involves placement of a stent in the segment of abnormal vessel using an endovascular catheter. This has the advantage of shortened recovery times and eliminates the risks associated with open-chest surgery. While the short term advantages of endovascular repair are evident, studies have failed to show clear long term survival a benefit. Endovascular repair also carries a higher risk of need for re-intervention due to complications such as graft leak, migration or stenosis. The American College of Cardiology guidelines for management of AAA currently recommend endovascular repair as favorable for patients with high surgical risks based on co-morbidities [2]. Unfortunately, not all patients for which endovascular repair is recommended will be good candidates because of certain anatomical characteristics. Factors such as: shape and location of aneurysm in relation to other vessels, size and condition of vessels used for access, and presence of thrombosis or calcification at the site of intended stent placement need to be evaluated. These characteristics are usually evaluated by means of high resolution three-dimensional computed tomography angiography (CTA) [2]. CTA provides detailed anatomical information about the aortic lumen, thrombus and calcifications (Fig. 1) [4]. The highly detailed information obtained is also used to prepare the endograft which must be done with precision prior to insertion since it cannot be modified once deployed.
Figure 1.
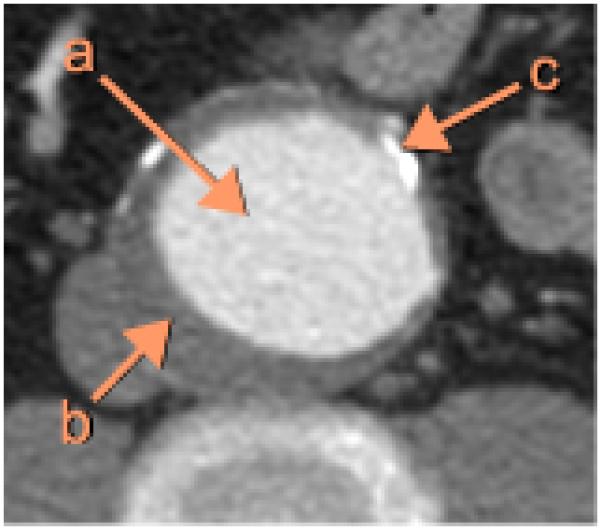
Example of an abdominal CTA image in AAA, cropped to show a section of the aorta. (a) Lumen. (b) Thrombus. (c) Calcification.
Segmentation of the aortic lumen in AAA is simplified in CTA images since contrast materials produce the obvious difference in image intensity between the lumen and surrounding structures. However, segmentation of the thrombus in CTA images is challenging due to the following reasons: (a) the thrombotic surface is locally obscured in some cases; (b) the geometric structure of the thrombus is highly irregular; (c) the proximity of the spine, the heart, and the lungs has pronounced surface intensity gradients, which may cause mis-segmentation (Fig. 2).
Figure 2.
CTA image variability makes thrombus segmentation challenging. (a) Poorly visible thrombotic surface. (b) Irregular thrombus geometry. (c) Strong image intensity gradients near the spine, the heart and the lungs.
In the past, a thrombus was manually traced by an expert, which is a tedious and time-consuming task. To reduce user interaction as well as get accurate thrombus segmentation results, several studies exploring segmentation and quantitative analysis of the thrombus in AAA have been performed.
Tek et al. proposed a mean shift-based ray propagation method combined with a smoothness constraint for 2-D lumen segmentation [5]. The primary advantage of this approach is fast processing speed that the ray propagation is much faster than active contour update or level set evolution.
Subasic et al. proposed a 3-D deformable model-based technique using a level set algorithm [6]. While minor user intervention was required such as providing the center and radius of the sphere to define an initial surface for the 3-D level set algorithm, their thrombus segmentation results were not locally accurate.
Bruijne et al. introduced an active shape model (ASM) [7] segmentation scheme, in which a statistical shape model composed of landmark points was fitted to the thrombotic surface iteratively [8, 9]. Although the reported thrombus segmentation results were promising, this approach required substantial user interaction. The manual segmentation of the first image slice was required for the initialization of the ASM, and if thrombotic contours in subsequent slices were not reasonable, they needed to be manually modified by the user.
Olabarriaga et al. proposed a nonparametric statistical gray level appearance model-based method for 3-D thrombus segmentation [4, 10]. This approach required manual collection of training data being voxel intensities inside, outside and at the thrombotic boundary to train a k-NN classifier.
Li et al. developed a 3-D/4-D graph-based optimal surface detection method, which is capable of segmenting multiple interacting surfaces simultaneously [11, 12]. This method is appropriate for segmentation of a tubular object once original data are unfolded based on the centerline of the object to construct a graph.
The purpose of this study is to develop a novel and highly accurate method for segmentation and quantitative analysis of the thrombus in AAA from 3-D MDCT angiography images requiring minimal user interaction while providing a tool to aid in diagnosis, risk assessment, and determination of treatment options.
2. Methods
The proposed method for thrombus segmentation from CTA images consists of the following main steps: 1) approximate segmentation of the aortic lumen, 2) simultaneous segmentation of the luminal and thrombotic surfaces and 3) user-guided re-segmentation (if needed).
2.1. Initial luminal surface segmentation
Initial luminal surface segmentation is a pre-processing step for the proposed thrombus segmentation method, which requires a triangular mesh of the approximate luminal surface for graph construction. The initial luminal surface segmentation method is composed of anisotropic diffusion [13, 14], region growing, marching cube isosurface definition [15] and vertex smoothing.
As a noise-reducing step with preserving the boundary between the luminal and thrombotic regions, an anisotropic diffusion filter was applied to the original 3-D CTA dataset. The anisotropic diffusion constant (k) was calculated as:
| (1) |
where Ilumen and Ithrombus are average image intensities of the luminal and thrombotic regions, respectively, which are manually indicated by the user. The number of iterations for the anisotropic diffusion filter was set as 5, and the time step was 1/7.
An approximate luminal region was identified by employing region growing to the smoothed dataset. A seed point for the region growing is the point mouse-clicked at the luminal region by the user, and the region growing should satisfy the following 2 stopping criteria simultaneously.
| (2) |
| (3) |
where I is the original 3-D CTA dataset, and |∇I| is the gradient magnitude of I. Condition 1 accounts for 50% uncertainty of (Ilumen – Ithrombus) since Ilumen and Ithrombus represent the average image intensities of the local luminal and thrombotic regions, respectively. In addition, the image intensity of the luminal region should be larger than Ilumen – (Ilumen – Ithrombus) × 25% to prevent leakage in the regions having small gradient magnitudes (Condition 2). The triangular mesh of the initial luminal surface was built using a marching cube algorithm [15]. Finally, the luminal surface was smoothed by averaging adjacent vertices to avoid local roughness (Fig. 3). The parameters presented in this section were empirically determined and were kept constant for all analyses reported here.
Figure 3.
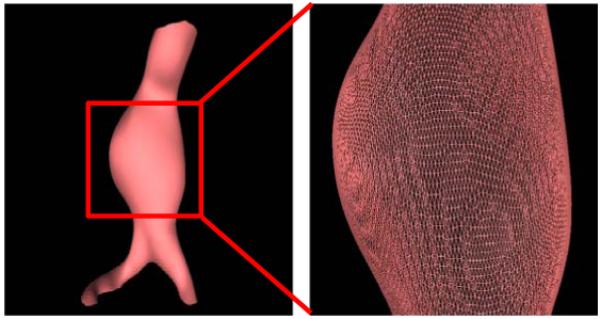
Approximate luminal surface represented by a triangular mesh.
2.2. Double surface 3-D graph search using a triangular mesh
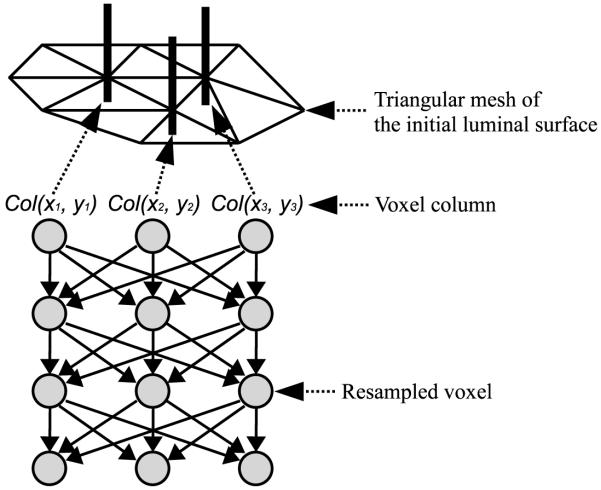
Following the preliminary segmentation of the lumen, a double surface graph search method using a triangular mesh was applied to determine accurate locations of luminal and thrombotic surfaces in 3-D [12]. Let a weighted graph G = (V, E) be composed of a node set V and an arc set E. The nodes v ∈ V correspond to image voxels, and the arcs < vi, vj >∈ E connect the nodes vi and vj. Every arc < vi, vj >∈ E has a cost (or weight) which represents some measure of preference that the corresponding voxels belong to the segmentation surface of interest. Fig. 4 shows the structure of the triangular mesh-based graph, in which voxel columns are resampled using tri-linear interpolation along the average normal directions of surrounding triangles at the vertices of the triangular mesh of the initial luminal surface in Section 2.1. The adjacencies of the columns were previously known from the triangular meshes of the initial luminal surface, and the arcs between two adjacent columns were determined by a surface smoothness constraint to segment a feasible surface. For double surface detection, two triangular mesh-based graphs with a cost function for each surface were combined with the arcs controlled by a surface separation constraint. In this study, the surface smoothness constraint and surface separation constraint were set as 1 voxel and 2 voxels, respectively. Segmentation of two coupled surfaces was formulated as computing a minimum closed set in the 3-D geometric graph constructed from the cost functions as described in Section 2.3 [11, 12]. This can be solved by computing the minimum s – t cut of the graph using a Boykov-Kolmogorov maximum-flow algorithm [16] with a low-order polynomial time complexity. The advantage of the triangular mesh-based graph search compared to the conventional centerline-and-unfold graph search [12] is that complex object surfaces can be segmented, including surfaces at bifurcations.
Figure 4.
Structure of the triangular mesh-based graph.
2.3. Cost functions for the luminal and thrombotic surfaces
The triangular mesh-based 3-D graph search method requires two separate cost functions for the luminal and thrombotic surfaces. Generally, aortic thrombi can be identified by the image intensity differences between the luminal and thrombotic regions, and between the thrombotic and surrounding regions. Consequently, edge-based cost functions of the graph search were used for detection of the luminal and thrombotic surfaces.
The cost function for the luminal surface (Clumen) was defined as:
| (4) |
where I is the original 3-D CTA dataset, h is a smoothing filter, and ω is a weighting coefficient (0 ≤ ω ≤ 1). The gradient magnitude (|∇I|) calculated using a Sobel operator was smoothed by a 3 × 3 × 3 averaging filter (h) to improve connectivity and smoothness of the surface edge representations. |∇I|local is the gradient magnitude locally emphasized by employing local histogram equalization [17] within a 5 × 5 × 5 kernel. Weighted combination of these two terms was used, controlled by ω, which was set as 0.3. The regions located more than 1 voxel inside of the initial luminal surface (finitial lumen) and 3 voxels outside of it were ignored since the real luminal surface is expected to be located close to the initial luminal surface.
In addition, the cost function for the thrombotic surface (Cthrombus) was defined as:
| (5) |
where DT(I, finitial_lumen) is a distance transform map [18] based on finitial_lumen, and α is a constant. To incorporate information about the proximity of the luminal and thrombotic surfaces, the gradient magnitudes were linearly reduced with increasing distance from the initial luminal surface, and α = 20. |∇I|local was used to reduce strong edge responses around the spine, heart, lungs and other tissues as well as locally enhance weak edge responses of the thrombotic surface. The responses located less than 1 voxel outside of the initial luminal surface were ignored since these regions were likely related to the luminal surface than the thrombotic surface.
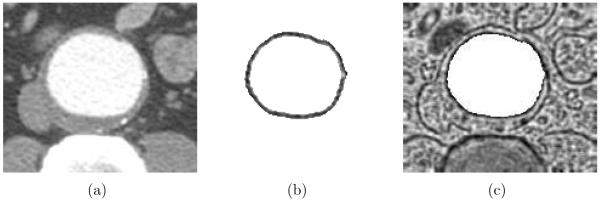
Finally, both cost functions (Clumen and Cthrombus) were inverted since the double surface 3-D graph search method detects two interacting surfaces having the minimum cost. The parameters presented in this section were constants experimentally determined. Fig. 5 shows examples of the calculated cost functions values for the luminal and thrombotic surfaces.
Figure 5.
Examples of cost functions for the luminal and thrombotic surfaces. (a) Original CTA image. (b) Cost function image for the luminal surface. (c) Cost function image for the thrombotic surface.
2.4. Interactive guidance of the thrombus segmentation
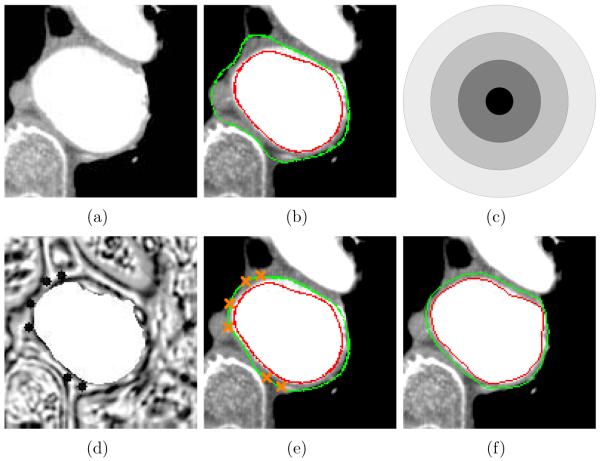
Segmentation of thrombus in CTA images is challenging since the lack of contrast between the thrombotic surface and surrounding tissues may cause local failures of the thrombus segmentation. When needed, a small number of control points are required to modify the cost function to guide the thrombotic surface detection. The shape of the control point is a sphere whose radius is 4 voxels (Fig. 6c). The center of the sphere has the minimum gradient magnitude (i.e., 0), and the gradient magnitude out of the center of the sphere linearly increases according to the radius of the sphere. Fig. 6 shows the effect of the control points. The thrombotic surface distracted by the spine and the lungs in Fig. 6b was modified by the control points in Fig. 6e.
Figure 6.
Effect of control points. (a) Original CTA image. (b) Thrombus segmentation result without any control point. Luminal and thrombotic surfaces are in red and green, respectively. (c) The shape of the region modified by inserting a control point. It is scaled up to describe the modified region. (d) Cost function image for the thrombotic surface modified by 6 control points. (e) Thrombus segmentation result with 6 control points. (f) Independent standard.
3. Experiments
The reported thrombus segmentation method was tested in 9 3-D MDCT angiography datasets from 9 patients with AAA imaged using both 16 and 64-slice MDCT scanners (Brilliance CT, Philips Healthcare, Cleveland, OH, U.S.A.). 8 datasets exhibited AAA, and 1 dataset depicted an aneurysm in the iliac artery. The dimensions of the datasets were between 512 × 512 × 100 and 512 × 512 × 255 voxels, and the voxel size ranged from 0.53 × 0.53 × 1.0 to 0.86×0.86×1.0 mm. The total number of image slices analyzed for 9 subjects was 1300.
To validate the method, our thrombus segmentation results were compared to expert-defined independent standards. In randomly selected 10 image slices per 3-D CTA dataset, luminal and thrombotic contours were manually delineated by an expert (RKJ). The mean unsigned error was calculated by averaging the closest distances between pairs of points, the first located on the computer-determined surface and the other on the independent standard. To measure reproducibility of the method according to the variation of the points in the luminal and thrombotic regions indicated by the user in Section 2.1, the same experiment was performed with independently-defined lumen and thrombus initialization mouse clicks while same control points were used as in the first experiment to keep the test confined to the test of the initialization only. Significance of the segmentation differences was assessed by a paired t-test, and p value of 0.05 was considered significant.
4. Results
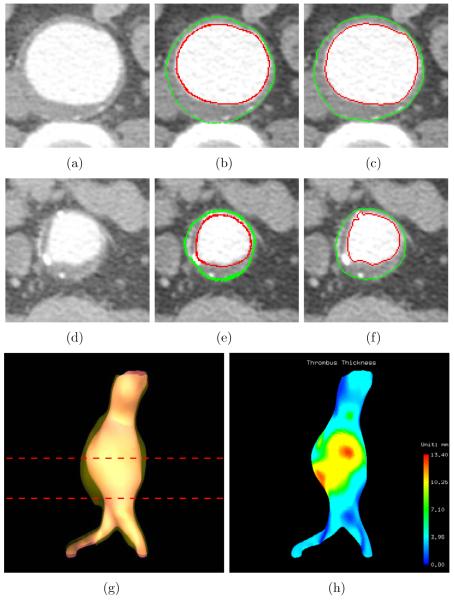
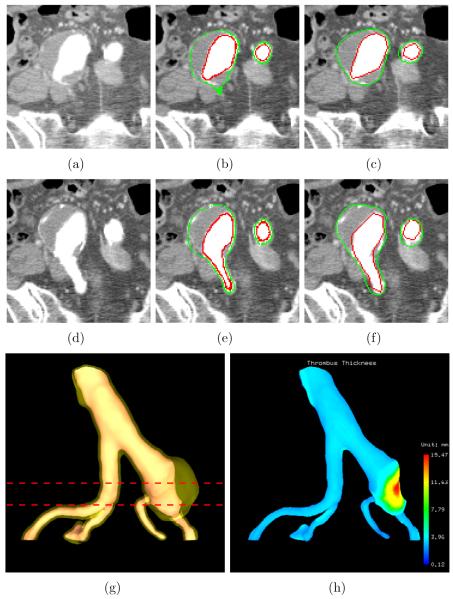
In 4 out of 9 datasets, successful 3-D thrombus segmentations were obtained without any need for interactive definition of control points (Table 1). In the remaining 5 datasets, the method locally failed due to image ambiguity and 9.9 ± 10.3 control points in 2.1 ± 2.2 image slices per 3-D CTA dataset were required to achieve complete 3-D thrombus segmentations so that no local surface failures were present. The mean unsigned errors of the luminal and thrombotic surfaces in the first experiment were 0.99 ± 0.18 mm and 1.90 ± 0.72 mm, respectively. The method’s performance was not affected by initialization. The segmentation reproducibility assessed by the mean absolute difference of the unsigned errors resulting from two independent experiments was 0.01 ± 0.01 mm and 0.03 ± 0.04 mm for the luminal and thrombotic surfaces, respectively. The segmentations resulting from two initializations were statistically identical for both surfaces (p = NS). Figs. 7 and 8 show our thrombus segmentation results of two 3-D CTA datasets (datasets 1 and 3) and 3-D visualizations of thrombus thicknesses color-coded on the luminal surfaces.
Table 1.
Control points
| Dataset | Slices | Slices on which control points were put | Control points |
|---|---|---|---|
| 1 | 100 | 0 | 0 |
| 2 | 135 | 4 | 21 |
| 3 | 105 | 0 | 0 |
| 4 | 156 | 0 | 0 |
| 5 | 255 | 6 | 24 |
| 6 | 135 | 3 | 19 |
| 7 | 120 | 3 | 17 |
| 8 | 165 | 3 | 8 |
| 9 | 129 | 0 | 0 |
Figure 7.
Aortic thrombus segmentation results and thrombus thickness visualization (dataset 1). (a) Original CTA image corresponding to the top line in panel (g). (b) Computer segmentation results of panel (a). Luminal and thrombotic surfaces are in red and green, respectively. (c) Independent standard of panel (a). (d) Original CTA image corresponding to the bottom line in panel (g). (e) Computer segmentation results of panel (d). (f) Independent standard of panel (d). (g) 3-D rendering of the luminal and thrombotic surfaces. (h) 3-D visualization of color-coded thrombus thickness.
Figure 8.
Iliac thrombus segmentation results and thrombus thickness visualization (dataset 3). (a) Original CTA image corresponding to the top line in panel (g). (b) Computer segmentation results of panel (a). Luminal and thrombotic surfaces are in red and green, respectively. (c) Independent standard of panel (a). (d) Original CTA image corresponding to the bottom line in panel (g). (e) Computer segmentation results of panel (d). (f) Independent standard of panel (d). (g) 3-D rendering of the luminal and thrombotic surfaces. (h) 3-D visualization of color-coded thrombus thickness.
5. Discussion and Conclusions
We have proposed a novel method for segmentation of the thrombus in the abdominal aorta from 3-D CTA images. The method utilizes the power and flexibility of the 3-D graph search method based on a triangular mesh. The new technique provides a tool for thrombus segmentation eliminating the need for labor intensive manual image analysis. This method requires two mouse clicks, one at the luminal region and the other at the thrombotic region. For dealing with local failures caused by image ambiguity, a point- and-click segmentation guidance feature was implemented to correct locally failed computer segmentation without the need to manually trace thrombus contours slice by slice. The detected thrombus characteristics could be quantitatively described by reporting local thrombus thickness (Fig. 7h and Fig. 8h).
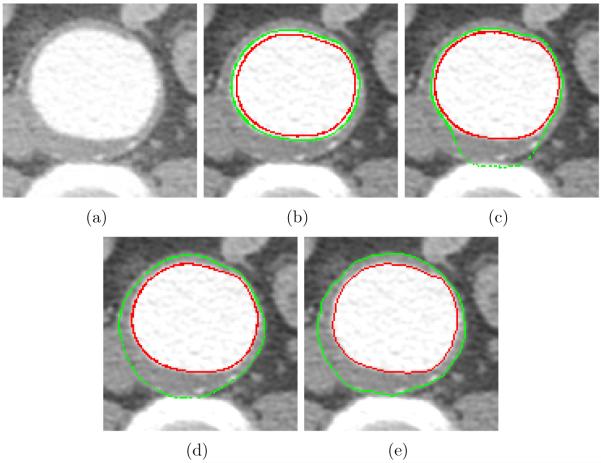
The method uses a 3-D graph search approach which can detect luminal and thrombotic surfaces simultaneously in the graph constructed based on the triangular mesh of the approximate luminal surface. To validate the double surface graph search against two single surface graph searches, another experiment was performed. The same cost functions were used for the two single surface graph searches and the double surface graph search. The minimum surface separation constraints for the two single surface graph searches were 1 and 2 voxels (Fig. 9b and c, respectively), and that for the double surface graph search was 2 voxels (Fig. 9d). As can be seen in Fig. 9b and c, the segmented thrombotic surface was distracted by the luminal surface and the spine due to their strong edge responses when a pair of independent single surface segmentations were applied. When employing the simultaneous double surface segmentation approach, the segmentation failure was avoided as seen in Fig. 9d.
Figure 9.
Effect of double surface graph search. (a) Original CTA image. (b) Two single surface graph searches, in which the minimum surface separation constraint is 1 voxel. Luminal and thrombotic surfaces are in red and green, respectively. (c) Two single surface graph searches, in which the minimum surface separation constraint is 2 voxels. (d) Double surface graph search, in which the minimum surface separation constraint is 2 voxels. (e) Independent standard.
The reported method was compared to some of the previously published approaches mentioned in Section 1. It is impossible to truly compare our method to the mean shift-based ray propagation method [5] and Subasic et al. level set algorithm [6] since they do not provide quantitative assessment of the thrombus segmentation performance. Based on published example segmentation figures, local failures of the thrombus segmentation are readily identifiable. A previously published active shape model approach of Bruijne et al. [8, 9] reported a reduction of user interaction by a factor of 6. Using the same logic, our method reduced the user interaction level by a factor of 68 (19 out of 1300 image slices). Comparing quantitative border positioning errors, Olabarriaga et al.’s nonparametric statistical gray level appearance model-based method [4, 10] showed more accurate thrombus segmentation results (mean unsigned error for the thrombotic surface: 1.3 ± 0.4 mm) than our method (1.9 ± 0.7 mm). However, their method required manual collection of training voxel intensities inside, outside, and at the thrombotic boundary in the analyzed CTA images. More importantly, their method did not support segmentation of the thrombus in the iliac artery bifurcation.
In general, our method shows good segmentation accuracy and reproducibility with dataset 2, in which the thrombus is highly eccentric, showing larger unsigned errors for both luminal and thrombotic surfaces than the other datasets (Fig. 10). The reason is that the columns of the graph perpendicular to the the approximate luminal surface cannot cover the thrombotic regions in this highly eccentric case. This is the limitation of the proposed approach and further study is required to solve these somewhat atypical cases. To complement the current gradient-based cost function, incorporating an intensity and/or texture-based cost terms may be useful to further reduce user interaction and obtain even better segmentation results. Finally, the computer segmentations were evaluated in comparison with the independent standards obtained from one expert. More objective validation would be possible using the reference standard acquired from multiple experts.
Figure 10.
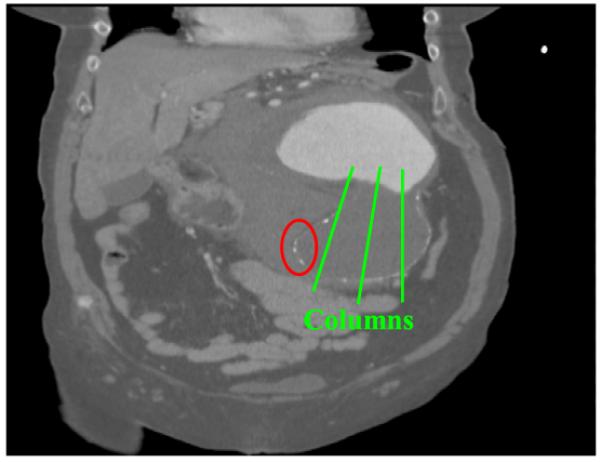
Coronal view of dataset 2. The thrombotic surface cannot be detected in the region marked by the ellipse since the columns of the graph cannot cover this region.
Acknowledgment
This research was supported, in part, by research grants from Philips Health-care and NIH R01 EB004640.
Footnotes
Publisher's Disclaimer: This is a PDF file of an unedited manuscript that has been accepted for publication. As a service to our customers we are providing this early version of the manuscript. The manuscript will undergo copyediting, typesetting, and review of the resulting proof before it is published in its final citable form. Please note that during the production process errors may be discovered which could affect the content, and all legal disclaimers that apply to the journal pertain.
Conflict of interest statement
None declared.
References
- [1].Hackam DG, Thiruchelvam D, Redelmeier DA. Angiotensin-converting enzyme inhibitors and aortic rupture: a population-based case-control study. Lancet. 2006;368:659–665. doi: 10.1016/S0140-6736(06)69250-7. [DOI] [PubMed] [Google Scholar]
- [2].Greenhalgh RM, Powell JT. Endovascular repair of abdominal aortic aneurysm. The New England Journal of Medicine. 2008;358:494–501. doi: 10.1056/NEJMct0707524. [DOI] [PubMed] [Google Scholar]
- [3].Lederle FA, Johnson GR, Wilson SE. Rupture rate of large abdominal aortic aneurysms in patients refusing or unfit for elective repair. The Journal of the American Medical Association. 2002;287:2968–2972. doi: 10.1001/jama.287.22.2968. [DOI] [PubMed] [Google Scholar]
- [4].Olabarriaga SD, Rouet J-M, Fradkin M, Breeuwer M, Niessen WJ. Segmentation of thrombus in abdominal aortic aneurysms from CTA with non-parametric statistical grey level appearance modelling. IEEE Transactions on Medical Imaging. 2005;24(4):477–486. doi: 10.1109/tmi.2004.843260. [DOI] [PubMed] [Google Scholar]
- [5].Tek H, Comaniciu D, Williams JP. Vessel detection by mean-shift based ray propagation; Proceedings of IEEE Workshop on Mathematical Methods in Biomedical Image Analysis; 2001.pp. 228–235. [Google Scholar]
- [6].Subasic M, Loncaric S, Sorantin E. 3D image analysis of abdominal aortic aneurysm; Proceedings of SPIE Medical Imaging; 2001; pp. 388–394. [PubMed] [Google Scholar]
- [7].Cootes TF, Hill A, Taylor CJ, Haslam J. The use of active shape models for locating structures in medical images. Image and Vision Computing. 1994;12(6):355–366. [Google Scholar]
- [8].de Bruijne M, van Ginneken B, Niessen WJ, Loog M, Viergever MA. Active shape model based segmentation of abdominal aortic aneurysms in CTA images; Proceedings of SPIE Medical Imaging; 2002; pp. 463–474. [DOI] [PubMed] [Google Scholar]
- [9].de Bruijne M, van Ginneken B, Viergever MA, Niessen WJ. Interactive segmentation of abdominal aortic aneurysms in CTA data. Medical Image Analysis. 2004;8(2):127–138. doi: 10.1016/j.media.2004.01.001. [DOI] [PubMed] [Google Scholar]
- [10].Olabarriaga SD, Breeuwer M, Niessen WJ. Segmentation of abdominal aortic aneurysms with a nonparametric appearance model; Computer Vision and Mathematical Methods in Medical and Biomedical Image Analysis; 2004.pp. 257–268. [Google Scholar]
- [11].Li K, Wu X, Chen DZ, Sonka M. Globally optimal segmentation of interacting surfaces with geometric constraints; IEEE Computer Society Conference on Computer Vision and Pattern Recognition (CVPR); 2004.pp. 394–399. [Google Scholar]
- [12].Li K, Wu X, Chen DZ, Sonka M. Optimal surface segmentation in volumetric images - a graph-theoretic approach. IEEE Transactions on Pattern Analysis and Machine Intelligence. 2006;28(1):119–134. doi: 10.1109/TPAMI.2006.19. [DOI] [PMC free article] [PubMed] [Google Scholar]
- [13].Perona P, Malik J. Scale-space and edge detection using anisotropic diffusion. IEEE Transactions on Pattern Analysis and Machine Intelligence. 1990;12(7):629–639. [Google Scholar]
- [14].Yu Y, Acton ST. Speckle reducing anisotropic diffusion. IEEE Transactions on Image Processing. 2002;11(11):1260–1270. doi: 10.1109/TIP.2002.804276. [DOI] [PubMed] [Google Scholar]
- [15].Lorensen W, Cline H. Marching cubes: a high resolution 3D surface construction algorithm; Proceedings of the 14th annual conference on Computer graphics and interactive techniques; 1987.pp. 163–169. [Google Scholar]
- [16].Boykov Y, Kolmogorov V. An experimental comparison of mincut/max-flow algorithms for energy minimization in vision. IEEE Transactions on Pattern Analysis and Machine Intelligence. 2004;26(9):1124–1137. doi: 10.1109/TPAMI.2004.60. [DOI] [PubMed] [Google Scholar]
- [17].Dale-Jones R, Tjahjadi T. A study and modification of the local histogram equalization algorithm. Pattern Recognition. 1993;26(9):1373–1381. [Google Scholar]
- [18].Sonka M, Fitzpatrick JM. Handbook of medical imaging. Vol. 2. SPIE-The International Society for Optical Engineering; 2000. [Google Scholar]


