Summary
The prospect of establishing serum metabolomic profiles offers great clinical significance for its potential to detect human lung cancers at clinically asymptomatic stages. Patients with suspicious serum metabolomic profiles may undergo advanced radiological tests that are too expensive to be employed as screening tools for the mass population. As the first step to establishing such profiles, this study investigates correlations between tissue and serum metabolomic profiles for squamous cell carcinoma (SCC) and adenocarcinoma (AC) in the lungs of humans. Tissue and serum paired samples from 14 patients (five SCCs and nine ACs), and seven serum samples from healthy controls were analyzed with high-resolution magic angle spinning proton magnetic resonance spectroscopy (HRMAS 1HMRS). Tissue samples were subjected to quantitative histological pathology analyses after MRS. Based on pathology results, tissue metabolomic profiles for the evaluated cancer types were established using principal component and canonical analyses on measurable metabolites. The parameters used to construct tissue cancer profiles were then tested with serum spectroscopic results for their ability to differentiate between cancer types and identify cancer from controls. In addition, serum spectroscopic results were also analyzed independent of tissue data. Our results strongly indicate the potential of serum MR spectroscopy to achieve the task of differentiating between the tested human lung cancer types and from controls.
Keywords: Lung squamous cell carcinoma, Lung adenocarcinoma, Diagnosis, Magnetic Resonance Spectroscopy, Magic Angle Spinning, Metabolomics, Blood Serum
Introduction
Despite extensive research and clinical efforts toward the prevention and management of lung cancer in the past decade, the prognosis remains unchanged. It is still the leading cause (more than 28%) of cancer death for both men and women in the United States, killing more people than breast, prostate, colon, and pancreatic cancers combined [1]. More alarmingly, data shows that most lung cancers are diagnosed at late, symptomatic stages, resulting in the deaths of more than 75% of patients who develop lung cancer; the same ratios for breast and prostate cancers are less than 22% and 15%, respectively [1]. It is commonly accepted that this grave reality is the result of a lack of early screening tests for lung cancer at asymptomatic stages for the general population, and the vast majority of patients seeking medical advice only after the presence of symptoms demonstrating locally advanced or metastatic disease. For this reason, any significant change in the distribution of the patient population achieved with advancements in lung cancer screening may have profound impacts on the reduction of cancer death rates [2].
Diagnostic radiology techniques, such as CT and FDG-PET, have shown abilities to identify cancerous lesions in the lung. However, in addition to a number of technical inhibiting factors, the most daunting roadblock preventing these tests from being incorporated into the annual physical examinations of general public is their high cost, which effectively prohibits their usage as screening tools under any healthcare system. Thus, currently these tests are only provided to symptomatic patients whose diseases tend to be at late, metastatic stages where treatment is rarely curative in nature [3-8].
Recent developments in molecular biology, particularly in cancer genomics, proteomics, and metabolomics, have renewed hopes in discovering blood-borne molecular markers for lung cancer early detection. Cancer metabolomics, the study of the global variations of metabolites and metabolic profiles under the influence of oncological developments and progressions, may present potential and promising markers in cancer detection. Such markers have demonstrated better sensitivity in revealing malignant status than those measured with morphology-based tissue pathology [9]. At present, for technical and historical reasons, the majority of metabolomic studies on cancer are accomplished using magnetic resonance spectroscopy (MRS).
The ultimate aim of our study is to establish serum metabolomic profiles for human lung cancer that may have the sensitivity to indicate the potential existence of clinically asymptomatic lung cancer in a screened individual and therefore direct the patient to further, more comprehensive medical testing. To achieve this aim, we designed the first phase of the study by using high-resolution magic angle spinning (HRMAS) proton MRS to investigate the correlations between tissue and serum metabolomic profiles simultaneously measured for the same patients of lung squamous cell carcinoma (SCC) and adenocarcinoma (AC). With sera from healthy controls, we measured the potential of these serum profiles to differentiate between these two cancer types, and from controls.
Materials and Methods
Tissue protocol
Paired tissue and serum samples from 14 patients without identifiers who underwent surgical treatment at the Massachusetts General Hospital (five SCCs and nine ACs) and serum samples from seven control subjects were acquired from the Harvard/MGH lung cancer susceptibility study repository at the Harvard School of Public Health approved by the MGH and Harvard School of Public Health IRBs for molecular and genetic analyses of human lung cancer. Detailed information of patients and control subjects are listed in Table 1. Although relationship with smoking status are not the focus of the current study, smoking status for the analyzed patients and control subjects are also listed in the table. Tissue samples were snap-frozen at the time of surgery and stored at −80°C. A serum sample was drawn on or just before the day of surgery, and samples were unaltered and remained frozen until spectroscopic measurements were carried out.
Table 1.
Clinical information of patients and healthy control subjects. “Packyrs”: measure of smoking history – Pack-years; “Smok Stat”: smoking status; “Ca, Stroma, Necrosis, Lymph, Cart”: volume percentages of pathological features of the analyzed tissue samples.
| Case | Ca Type | Ca. Stage | Packyrs | SmokStat | Ca | Stroma | Necrosis | Lymph | Cart |
|---|---|---|---|---|---|---|---|---|---|
| AC1 | Adeno | 1 | 0 | never | 24.2 | 69.4 | 6 | 0 | 0 |
| AC2 | Adeno | 1 | 37.3 | current | 4.2 | 95.6 | 0 | 0 | 0 |
| AC3 | Adeno | 1 | 36 | current | 28 | 72 | 0 | 0 | 0 |
| AC4 | Adeno | 1 | 54 | current | 33.33 | 66.66 | 0 | 0 | 0 |
| AC5 | Adeno | 1 | 51.4 | current | 5 | 95 | 0 | 0 | |
| AC6 | Adeno | 2 | 118.2 | current | 20 | 34 | 42 | 4 | 0 |
| AC7 | Adeno | 3 | 35 | current | 0 | 100 | 0 | 0 | 0 |
| AC8 | Adeno | 3 | 45 | current | 50 | 50 | 0 | 0 | 0 |
| AC9 | Adeno | 4 | 98.0 | current | 38.9 | 55.6 | 5.5 | 0 | 0 |
| SCC1 | SCC | 1 | current | 12 | 88 | 0 | 0 | 0 | |
| SCC2 | SCC | 1 | 40.6 | current | 14.3 | 31.4 | 8.6 | 5.7 | 40 |
| SCC3 | SCC | 1 | 110 | current | 0 | 86 | 0 | 12 | 2 |
| SCC4 | SCC | 1 | 101.4 | current | 0 | 0 | 100 | 0 | 0 |
| SCC5 | SCC | 3 | current | 0 | 0 | 100 | 0 | 0 | |
| Ctrl1 | Ctrl | 0 | never | ||||||
| Ctrl2 | Ctrl | 0 | never | ||||||
| Ctrl3 | Ctrl | 0 | never | ||||||
| Ctrl4 | Ctrl | 76 | former | ||||||
| Ctrl5 | Ctrl | 57.5 | former | ||||||
| Ctrl6 | Ctrl | 73.8 | former | ||||||
| Ctrl7 | Ctrl | 75.2 | current |
HRMAS Proton MRS
MR experiments were carried out on a Bruker (Billerica, MA) AVANCE spectrometer operating at 600 MHz (14.1T). A 4 mm zirconia rotor was used with Kel-F plastic inserts which created a spherical sample space of ∼10 μl located at the center of the detection coil. For tissue samples, approximately 10 mg were used, while for sera, 10 μl were injected in the rotor. For both tissue and sera, 1.0 μl of D2O was added into the rotor for 2H field locking. All spectroscopic measurements were carried out at 4°C for better tissue metabolite preservation. The rotor-spinning rate was regulated by a MAS controller (Bruker), and verified by the measurement of inter-SSB distances from spectra with an accuracy of ±1.0 Hz. A repetition time of five seconds and 128 transients were used to acquire each spectrum.
Spectra were collected with a spinning rate of 3600 Hz, with a rotor-synchronized CPMG filter to reduce broad resonances associated with probe background and/or macromolecules. Three hundred sixty CPMG cycles were applied, with one π-pulse between two rotor cycles in each CPMG cycle to result in a filter time of 200 ms.
Spectroscopic data were processed with Nuts software (Acorn NMR Inc. Livermore, CA) according to the following procedures. All free induction decays were subjected to 1Hz apodization before Fourier transformation, baseline correction, and phase adjustments of both zero and first order. Resonance intensities reported here represent integrals of curve-fittings with Lorentzian-Gaussian line-shapes normalized by the total spectral intensities measured between 0.5 and 4.5 ppm. After curve-fittings of the 28 spectra from the 14 pairs of samples, without any knowledge of tissue pathology, 40 spectral regions were selected for their presentation in the majority of the spectra. Twenty-one spectral regions that presented quantifiable resonances (signal-to-noise ratios above four) in both tissue and serum spectra with no more than one missing spectral data point were defined as spectral regions of interest and subjected to further statistical analyses. Details of the intensities of these regions for each sample can be found in Supplemental Data I.
Histopathology
After spectroscopic analyses, tissue samples were fixed in formalin, embedded in paraffin, cut in 5 μm sections, and stained with hematoxylin and eosin. Sets of serial-sections cut 100 μm apart were obtained from each sample. Volume percentages of histological features (cancer, stroma, necrosis, lymphatic structures, and cartilage) were analyzed by a pathologist and quantified from images with an Olympus BX41 Microscope Imaging System (Melville, NY), in conjunction with the image analyzer SoftImaging-MicroSuite™ (Lakewood, CO) [10].
Statistical Analysis
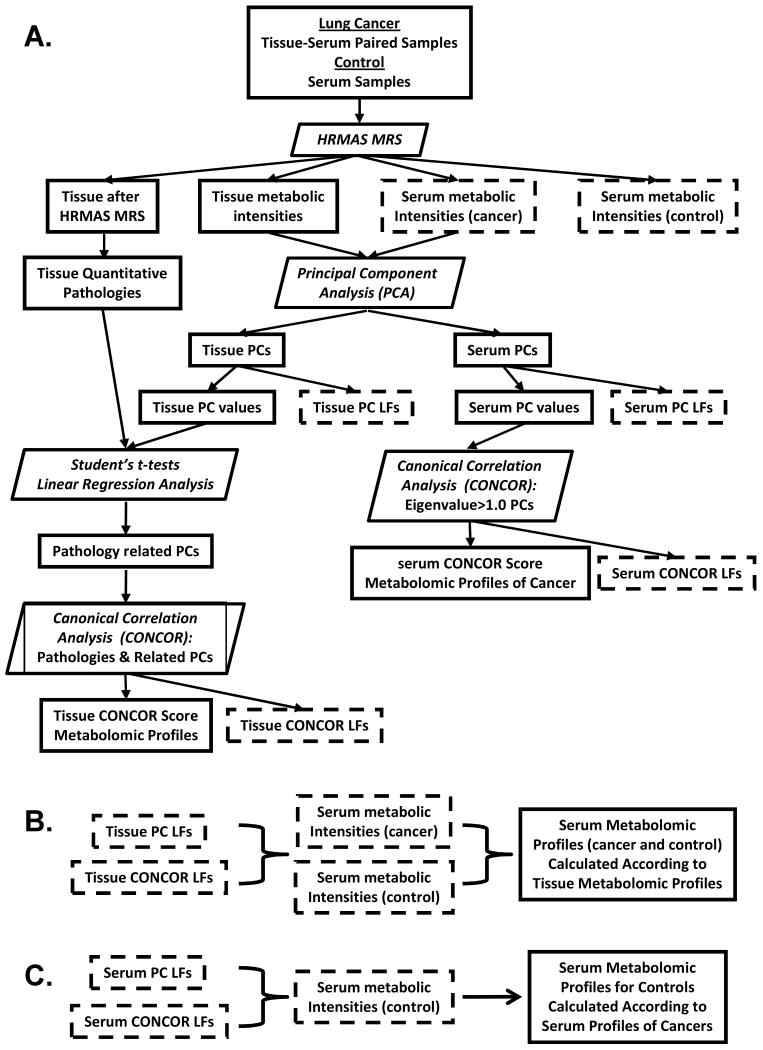
The aim of the present work was to identify serum metabolomic profiles that can distinguish cancer types and differentiate cancer from controls. The study is designed in two phases: serum profiles established with and without tissue analyses. First, tissue metabolomic profiles that could differentiate between cancer types were determined according to tissue pathologies, and the structures of these profiles were then applied to serum spectral data to produce serum profiles; and second, serum spectral data from cancer patients were also analyzed independent of tissue results to generate another set of serum metabolomic profiles. To construct these metabolomic profiles, the metabolite matrices were subjected to statistical data treatment – principal component analysis (PCA) to reduce the dimension of spectral data matrices of tissue and serum, respectively.
The hypothesis that different pathological features possess different metabolite profiles can be tested for correlations with pathologies by using linear regression analysis and Student's T-test against these PCs. Discriminant analyses of PCs showing correlations of or close to statistical significances (p<0.05) were included in canonical analysis aimed to achieve the maximum separation between the two cancer types measured from tissue samples. The coefficients obtained from both PCA and canonical analysis of tissues were then applied to serum spectral data, including those of controls. The resulting values of these calculated serum profiles were analyzed for their ability to differentiate SCC from ACs with accuracy evaluated by receiver operating characteristic (ROC) curves, and differentiating cancer from controls by ANOVA.
Canonical analysis of PCs obtained from PCA of cancer patient serum spectral data independent of tissue analysis involved the first n PCs of eigenvalue ≥ 1.0. The aim of the canonical analysis was to produce another set of serum metabolomic profiles that could separate the two tested cancer types based only on serum data without collaboration of tissue analysis. The coefficients obtained from both PCA and canonical analysis of cancer sera were applied to serum spectral data of controls. Finally, the combination of serum profiles calculated both with and without collaborations of tissue analysis was analyzed by nominal logistic regression to generate linear discriminant functions to differentiate between two cancer and one control serum groups. Statistical analyses were carried out using SAS-JMP (Cary, NC). Flowcharts are presented in Figure 1 to assist visualization of the study design and analytical procedures.
Figure 1.
Flowcharts illustrating the design of the study and its analytical procedures. In these charts parallelograms indicate process/analyses, and rectangles represent input/output among which rectangles with dashed outlines denote outputs in Chart A that will be the inputs in Charts B and C.
Results
Intact lung tissue and serum spectra and histopathology
Figure 2 represents the HRMAS MR spectra obtained with intact tissues and paired sera of the same patients of SCC and AC. The images of tissue histopathology obtained from the exact tissue samples after the measurements of the presented spectra are also shown in the figure. From these images, tissue pathologies were quantified.
Figure 2.
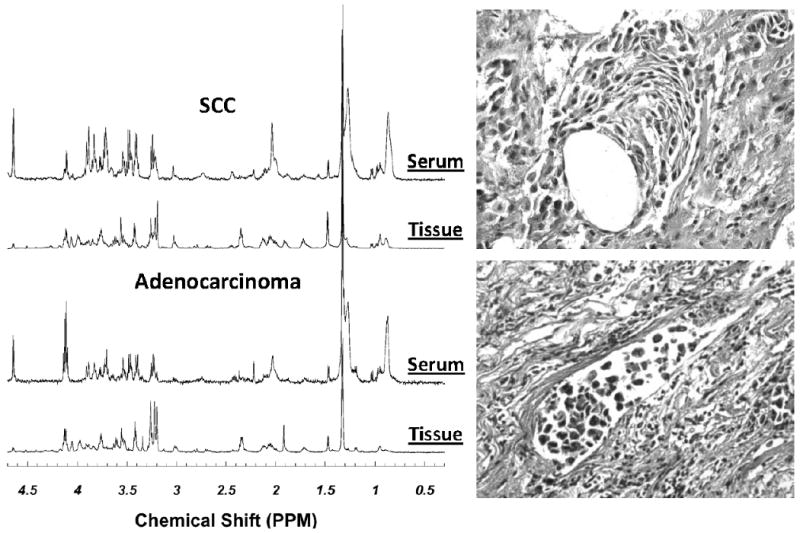
Examples of HRMAS MR spectra of intact tissues and paired sera from the same patients with either SCC or AC of the lung. The tissue histopathology images obtained from the tissue samples after spectroscopic measurements are also presented. From these images, tissue pathologies were quantified.
Principal component analysis
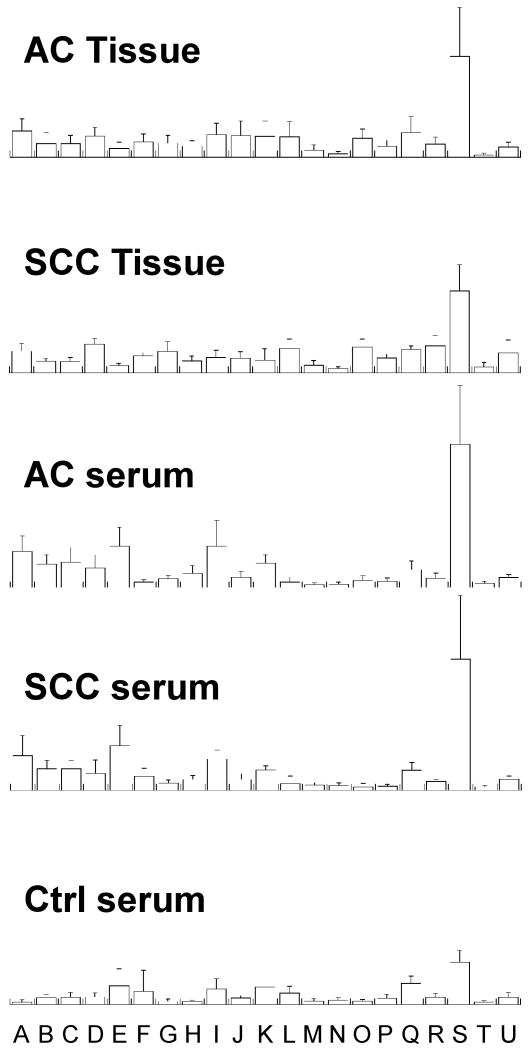
PCA calculations were carried out with the aforementioned 21 spectral regions identified from spectra exemplified in Figure 2. The means and standard deviations for tissue groups (SCC and AC) and serum groups (SCC, AC, and control) calculated from Supplemental Data I are plotted in Figure 3. Detailed information of the resulted principal components is provided in Supplemental Data II for both tissue and serum.
Figure 3.
The means and standard deviations of metabolic intensities normalized by the total spectral intensities measured between 0.5 and 4.5 ppm for tissue groups (SCC and AC) and serum groups (SCC, AC, and control) calculated from Supplemental Data I. The 21 regions (in ppm of chemical shifts) analyzed in the study are represented by letter A through U for: A, 4.14∼4.09; B, 3.93∼3.87; C, 3.86∼3.81; D, 3.78∼3.74; E, 3.73∼3.69; F, 3.66∼3.60; G, 3.56∼3.54; H, 3.53∼3.50; I, 3.45∼3.39; J, 3.26∼3.24; K, 3.23∼3.21; L, 3.20∼3.18; M, 3.04∼3.01; N, 2.46∼2.40; O, 2.39∼2.31; P, 2.15∼2.10; Q, 2.09∼2.03; R, 1.48∼1.45; S, 1.33∼1.31; T, 1.04∼1.02; and U, 0.96∼0.92.
Generating serum metabolomic profiles from paired tissue results
Evaluating the PCs obtained from PCA of cancer tissues, we noticed the potential powers of PCs 1, 2, 7, and 12 to differentiate SCC from ACs and correlate with pathological features, as shown in Table 2. While some of the tested relationships were statistically significant, defined as p < 0.05, others could only be defined as approaching this significance level.
Table 2.
Summary of observed correlations and potential correlations between PCs and cancer pathologies.
| PC1 | PC2 | PC7 | PC12 | |
|---|---|---|---|---|
| T-Test (p=) | ||||
| SCC vs. Adeno | 0.027 | 0.149 | ||
| Linear Regression Analysis (p=) | ||||
| Cancer (All) | 0.089 | |||
| Stroma (All) | 0.004 | |||
| Necrosis (All) | 0.001 | |||
| Cancer (Adeno) | 0.047 | |||
| Stroma (Adeno) | 0.039 | |||
| Necrosis(Adeno) | 0.095 | 0.072 | ||
| Cancer (SCC) | 0.073 | |||
| Stroma (SCC) | 0.082 | 0.066 | ||
| Necrosis (SCC) | 0.015 | |||
Canonical analysis involving these four PCs (PC1, 2, 7, and 12) and the volume % of cancer were calculated to reveal potential discriminants, as shown in Figure 4 (left, bottom) with details listed in Table 3. In addition, the details of canonical analysis data can be found in Supplemental Data III. The metabolomic profile thus obtained as a canonical score can differentiate tissue samples between the two tested cancer groups with an overall accuracy of 96% according to the ROC curve inserted in Figure 4 (left, top). By applying the coefficients established through tissue PCA and canonical analysis to the spectral data of serum samples from 14 lung cancer patients and seven controls, we observed a statistically significant differentiating power of ANOVA p<0.0001 among the three serum groups. These serum metabolomic profiles can differentiate between two tested cancer groups with an overall accuracy of 89%, as shown in Figure 4 (right, top), as well as differentiate them from the healthy controls, as detailed in Table 4. Comparing the canonical scores, it is apparent that for tissues and sera, shown in the bottom of Figure 4 at left and right, respectively, the score values for AC tissues are higher than those for SCC. But for the score values for sera calculated with the coefficients obtained from tissues, the opposite is observed. This reversal of profile values can only be the result of the differences in the metabolomic distributions between tissues and sera in the two tested cancer groups. This difference, although still not fully understood based on the currently available data, we tested and found it to be unrelated to the volume % of cancer measured in tissues. Our results show a linear relationship (r2=0.863, p<0.0001) between tissue score values presented in Figure 4 (left, bottom), with inclusions of volume % of cancer, and score values calculated with the same coefficients (from Table 4a) but excluding the term of the volume % of cancer.
Figure 4.
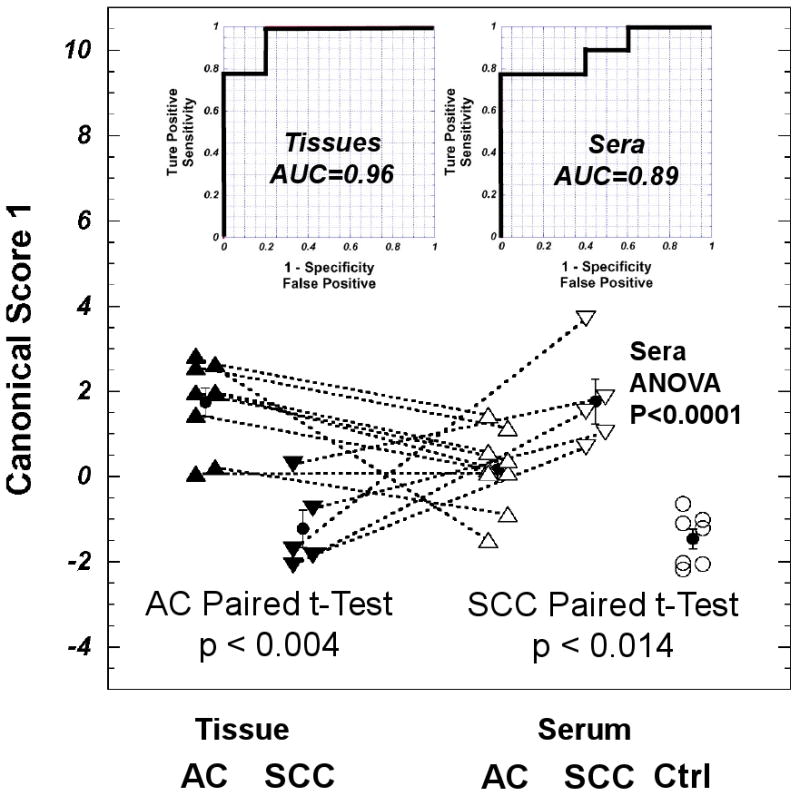
Tissue metabolomic profiles can differentiate SCCs from ACs, and when applied to serum spectra the resulting analogous serum profiles can differentiate between the sera of these cancers and from controls. Canonical Score 1, obtained from discriminant calculation conducted with PCs 1, 2, 7, and 12, and the volume % of cancer measured with tissue samples, can discriminate SCC from AC with an overall accuracy of 96% shown in the tissue ROC curve. Applying the coefficients of tissue canonical score 1 to serum spectral data, the resulting serum metabolomic profiles can differentiate among SCC, AC and control (Ctrl) groups with statistical significance (p < 0.0001) and an overall accuracy of 89%, as shown in serum ROC curve. With AC, tissue profiles are higher than serum profiles (paired t-test: p < 0.004); with SCC, the reverse appears with statistical significance (p < 0.014). The red close cycles and vertical bars denote means and standard errors measured for the corresponding groups.
Table 3.
Eigenvectors (loading factors) obtained from canonical analyses for tissue and serum that reveal potential discriminants between SCC and AC.
| Tissue | |||||||
|---|---|---|---|---|---|---|---|
| Vol % Ca | PC1 | PC2 | PC7 | PC12 | |||
| Eigenvectors | 0.041 | 0.107 | 0.453 | 0.664 | 2.468 | ||
| Serum | |||||||
| PC1 | PC2 | PC3 | PC4 | PC5 | PC6 | PC7 | |
| Eigenvectors | 0.052 | 0.289 | 0.617 | 0.621 | 1.205 | 0.083 | 1.076 |
Table 4.
Summary of statistical significance of serum metabolomic results in differentiation between SCC, AC, and healthy controls (Ctrl). Means and Standard Errors present values calculated from canonical scores for each sample.
| SCC | AC | Ctrl | |
|---|---|---|---|
| Sample Size n= | 5 | 9 | 7 |
| Mean | 1.741 | 0.173 | -1.466 |
| Standard Error | 0.404 | 0.301 | 0.342 |
| ANOVA p<0.0001 | |||
| t-test: p< | |||
| AC | 0.0173 | ||
| Ctrl | 0.0001 | 0.0012 | |
By including multiple PCs in the canonical analyses, the final coefficients (combining coefficients both from PCA and canonical analysis) related to the standardized metabolite intensities may be evaluated to disseminate the degrees of contributions of various metabolites. From such evaluations, we found that the intensity changes in taurine (∼3.42 ppm), myo-inositol (∼3.52 ppm), phosphorylcholine (∼3.22 ppm), glutamate (∼2.33-2.35 ppm), lactate (∼1.33 ppm) and possible combinations of resonance contributions from various metabolites at ∼3.7 ppm might have the most effect in structuring the discriminants. A histogram plot of the final coefficients for all 21 regions is shown in Figure 5a.
Figure 5.
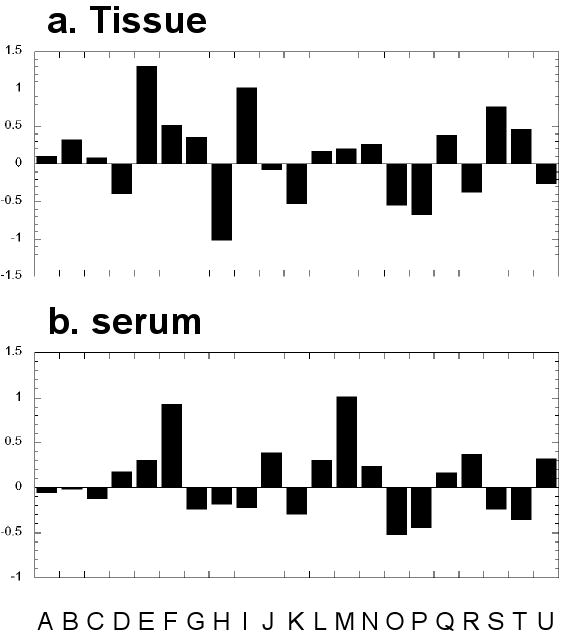
The final coefficients (combinations of eigenvectors obtained from both principal component analysis and canonical analysis) for all 21 regions that result in lung cancer metabolomic profiles differentiating SCC from AC. See Figure 3 for region labeling information.
Generating serum metabolomic profiles from serum spectral data
In addition to the above procedures of constructing lung cancer serum metabolomic profiles through the discovery of lung cancer tissue metabolomic profiles, lung cancer serum spectroscopic data can be analyzed independent of tissue results to discover cancer specific profiles.
We analyzed the above-mentioned 21 metabolic intensities measured from the 14 lung cancer serum samples with PCA. Because no additional pathological or clinical data can be used to evaluate these resulting PCs, by using 1.0 as the threshold of the eigenvalue for PC selections, we include the first seven PCs for further analysis (cf. Table 2b). Canonical analysis using these seven PCs resulted in a score that can separate SCCs from ACs with statistical significance (p<0.0001, cf. Table 5, where p=0.0173). Results of the analysis are listed in Table 3, with the details of canonical analysis data included also in Supplemental Data III, and a histogram plot of the final coefficients for all 21 regions is shown in Figure 5b.
We tested the utility of the resulting score obtained from these 14 serum samples from cancer patients on the seven control sera. We calculated the scores for these controls with coefficients of PCA and canonical analysis obtained from cancer sera and obtained a much better differentiation, i.e. less overlaps, between controls and ACs (p<0.0005, cf. Table 5, where p=0.0012). More interestingly, by combining the lung cancer tissue-derived serum profile in Figure 4 with the current independently obtained serum profile, we obtained differentiation among the three tested serum groups on a two dimensional plot with statistical significance (p<0.0001) based on nominal logistic regression analysis, as shown in Figure 6, where the nominal logistic regression equations for each group are presented in the figure. While there were still some minor overlaps among groups, the separations among these groups were clearly presented by three linear discriminant functions shown in the figure.
Figure 6.
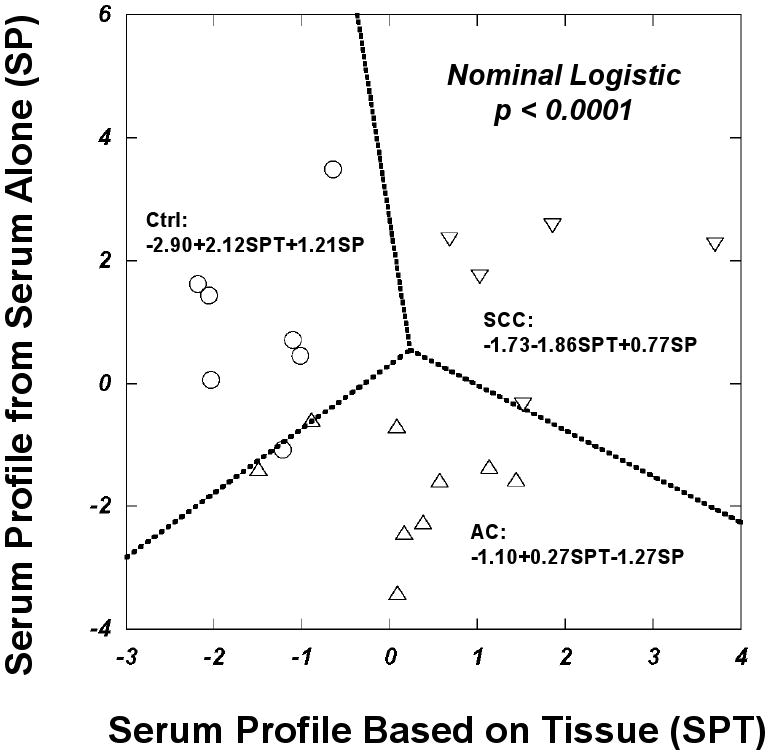
Differentiations among three tested serum groups based on nominal logistic and linear discriminant analyses of serum metabolomic profile presented as canonical scores calculated based on profile coefficients obtained from tissue analyses (SPT) and using serum spectral data independently (SP). Up-triangles represent ACs, down-triangles denote SCCs, and open-circles are control sera. Nominal logistic regression equations for each group are presented in the figure.
Discussion
The strength of the study design is the direct comparison of paired tissue and serum metabolomic profiles obtained from the same lung cancer patients, as shown in Figure 4, through paired t-test with tissue and serum results for each case. To achieve the aim of establishing discriminating serum metabolomic profiles, tissue metabolomic profiles calibrated by tissue quantitative pathologies were used as the first step of approximation.
The benefits of utilizing the HRMAS method to measure serum samples are multifold. Scientifically, although they are liquids, sera containing macromolecules are not aqueous solutions in the classical-NMR sense and produce spectra of low resolution similar to those of intact tissue samples. To obtain high resolution spectra for sera without using HRMAS, ultrafiltrations and more than 500 μl samples were required to produce a meaningful spectrum [11]. However, the use of HRMAS on untreated serum samples has reduced the required sample size to 10 μl native sera and eliminated possible losses of original metabolites during treatment procedures.
In a PCA calculation, PCs are required to be independent. This requirement may not reflect the actual underlying pathological processes where changes in different metabolites are interconnected. For this reason, canonical analyses involving multiple PCs that presented variable degrees of associations with the observed disease pathologies were applied to discover discriminants. In this study, we observed that by applying the sensitive discriminant structure discovered from tissue analyses to serum data, the resulting discriminative powers with serum data for different cancer groups and between cancer and controls held statistical significance.
As it is a preliminary study, the results presented here are confined by limitations. The number of cases studied is very limited. Therefore, during the process of PC selection for canonical analysis to generate canonical scores as tissue metabolomic profiles, we relaxed the level of statistical significance (p<0.05). Furthermore, it is well understood that in any single medical and biological test of empirical nature, while the results of the test may be able to differentiate among the concerned groups with statistically significant differences, overlaps are common. For this reason, it is often necessary to use multiple independent tests to form differential diagnoses in medical practices. Such overlaps between sera from ACs and controls can be seen in Figure 4. Because the aim of this project is to assess lung cancer risk in order to initiate advanced radiological tests on at-risk groups without treatments causing morbidity, it can afford to have a threshold of higher false-positive rates. However, the advantage of measuring multiple metabolites to form various metabolomic profiles is that it may increase the differentiation among groups and reduce such false-positive rates, as shown by combining results from Figures 4 and 6, which shows overlaps between ACs and controls are greatly reduced.
Finally, we wish to note that as a preliminary study of limited resources we are not able to control and match many clinical, pathological and behavioral conditions. For instance, we realized and are concerned by the fact that while our cancer populations are mostly current smokers, our control cases are either non-smoking or former smokers. Although the potential confounding effects of smoking towards serum metabolomic profiles are extremely important and worthy for additional studies, our current observation of profile separations between SCC and AC among smokers may somewhat alleviate such a concern.
Conclusion
We have demonstrated by simultaneously measuring tissue and serum metabolomic profiles from human SCC and AC patients of lung cancer with the statistical assistance of PCA and canonical analyses, we are able to establish metabolomic profiles that can differentiate between the tested cancer types and correlate these with the relative volumes of tumor in the sample. Additionally, comparison of quantitative pathology and coefficients of malignancy observed by spectroscopy of tissue with serum profiles leads to even greater discrimination between the types of cancer.
Supplementary Material
Acknowledgments
Authors acknowledge partial support by NIH grants CA115746 (LLC), CA095624 (LLC), CA092824 (DCC), CA074386 (DCC), CA090578 (DCC), and MGH A. A. Martinos Center for Biomedical Imaging.
Footnotes
We wish to dedicate this work to Lance W. Crocker (1944–2004), beloved father of KWJ, and Wei Zheng (1962-1991), courageous sister of LLC. Their losses to lung cancer and loving memories have made this work possible.
Conflict of interest statements: Authors acknowledge no conflict of interest.
Publisher's Disclaimer: This is a PDF file of an unedited manuscript that has been accepted for publication. As a service to our customers we are providing this early version of the manuscript. The manuscript will undergo copyediting, typesetting, and review of the resulting proof before it is published in its final citable form. Please note that during the production process errors may be discovered which could affect the content, and all legal disclaimers that apply to the journal pertain.
References
- 1.Jemal A, Siegel R, Ward E, Hao Y, Xu J, Murray T, Thun MJ. Cancer statistics, 2008. CA Cancer J Clin. 2008;58:71–96. doi: 10.3322/CA.2007.0010. [DOI] [PubMed] [Google Scholar]
- 2.Report of the NCI Lung Cancer Progress Review Group. 2001 http://planning.cancer.gov/pdfprgreports/2001lung.pdf.
- 3.Coleman RE. PET in lung cancer. J Nucl Med. 1999;40:814–820. [PubMed] [Google Scholar]
- 4.Higashi K, Matsunari I, Ueda Y, Ikeda R, Guo J, Oguchi M, Tonami H, Yamamoto I. Value of whole-body FDG PET in management of lung cancer. Ann Nucl Med. 2003;17:1–14. doi: 10.1007/BF02988253. [DOI] [PubMed] [Google Scholar]
- 5.Higashi K, Ueda Y, Ayabe K, Sakurai A, Seki H, Nambu Y, Oguchi M, Shikata H, Taki S, Tonami H, Katsuda S, Yamamoto I. FDG PET in the evaluation of the aggressiveness of pulmonary adenocarcinoma: correlation with histopathological features. Nucl Med Commun. 2000;21:707–714. doi: 10.1097/00006231-200008000-00002. [DOI] [PubMed] [Google Scholar]
- 6.Higashi K, Ueda Y, Yagishita M, Arisaka Y, Sakurai A, Oguchi M, Seki H, Nambu Y, Tonami H, Yamamoto I. FDG PET measurement of the proliferative potential of non-small cell lung cancer. J Nucl Med. 2000;41:85–92. [PubMed] [Google Scholar]
- 7.Hicks RJ, Kalff V, MacManus MP, Ware RE, Hogg A, McKenzie AF, Matthews JP, Ball DL. (18)F-FDG PET provides high-impact and powerful prognostic stratification in staging newly diagnosed non-small cell lung cancer. J Nucl Med. 2001;42:1596–1604. [PubMed] [Google Scholar]
- 8.Guo J, Higashi K, Yokota H, Nagao Y, Ueda Y, Kodama Y, Oguchi M, Taki S, Tonami H, Yamamoto I. In vitro proton magnetic resonance spectroscopic lactate and choline measurements, 18F-FDG uptake, and prognosis in patients with lung adenocarcinoma. J Nucl Med. 2004;45:1334–1339. [PubMed] [Google Scholar]
- 9.Cheng LL, Burns MA, Taylor JL, He W, Halpern EF, McDougal WS, Wu CL. Metabolic characterization of human prostate cancer with tissue magnetic resonance spectroscopy. Cancer Res. 2005;65:3030–3034. doi: 10.1158/0008-5472.CAN-04-4106. [DOI] [PubMed] [Google Scholar]
- 10.Burns MA, He W, Wu CL, Cheng LL. Quantitative pathology in tissue MR spectroscopy based human prostate metabolomics. Technol Cancer Res Treat. 2004;3:591–598. doi: 10.1177/153303460400300609. [DOI] [PubMed] [Google Scholar]
- 11.Maillet S, Vion-Dury J, Confort-Gouny S, Nicoli F, Lutz NW, Viout P, Cozzone PJ. Experimental protocol for clinical analysis of cerebrospinal fluid by high resolution proton magnetic resonance spectroscopy. Brain Res Brain Res Protoc. 1998;3:123–134. doi: 10.1016/s1385-299x(98)00033-6. [DOI] [PubMed] [Google Scholar]
Associated Data
This section collects any data citations, data availability statements, or supplementary materials included in this article.


