

Abstract
Lung surfactant (LS) is a mixture of lipids and proteins that line the alveolar air-liquid interface, lowering the interfacial tension to levels that make breathing possible. In acute respiratory distress syndrome (ARDS), inactivation of LS is believed to play an important role in the development and severity of the disease. This review examines the competitive adsorption of LS and surface-active contaminants, such as serum proteins, present in the alveolar fluids of ARDS patients, and how this competitive adsorption can cause normal amounts of otherwise normal LS to be ineffective in lowering the interfacial tension. LS and serum proteins compete for the air-water interface when both are present in solution either in the alveolar fluids or in a Langmuir trough. Equilibrium favors LS as it has the lower equilibrium surface pressure, but the smaller proteins are kinetically favored over multi-micron LS bilayer aggregates by faster diffusion. If albumin reaches the interface, it creates an energy barrier to subsequent LS adsorption that slows or prevents the adsorption of the necessary amounts of LS required to lower surface tension. This process can be understood in terms of classic colloid stability theory in which an energy barrier to diffusion stabilizes colloidal suspensions against aggregation. This analogy provides qualitative and quantitative predictions regarding the origin of surfactant inactivation. An important corollary is that any additive that promotes colloid coagulation, such as increased electrolyte concentration, multivalent ions, hydrophilic non-adsorbing polymers such as PEG, dextran, etc. or polyelectrolytes such as chitosan, added to LS, also promotes LS adsorption in the presence of serum proteins and helps reverse surfactant inactivation. The theory provides quantitative tools to determine the optimal concentration of these additives and suggests that multiple additives may have a synergistic effect. A variety of physical and chemical techniques including isotherms, fluorescence microscopy, electron microscopy and X-ray diffraction show that LS adsorption is enhanced by this mechanism without substantially altering the structure or properties of the LS monolayer.
Keywords: charge reversal, chitosan, inhibition, depletion attraction, albumin, polyethylene glycol, Debye length
Introduction: Why Lung Surfactant?
The human lung bifurcates into numerous channels (bronchi and bronchioles) terminating in sub-millimeter diameter spherical, liquid-coated chambers [1], called alveoli, in which gas exchange occurs. The surface area in adult lungs is ~ 70 m2, about half the area of a tennis court [2–5]. This enormous surface area maximizes the exchange of oxygen and carbon dioxide between air and blood, but air-water interfaces of this size contribute a potentially significant drain on metabolic energy as the interface expands and contracts against surface tension. Nature has minimized this energy drain by coating the lung air-water interface with a thin film of lipids and proteins, collectively called lung surfactant (LS).
LS is composed of 90% lipids (primarily dipalmitoylphosphatidylcholine, DPPC) and 10% of four lung surfactant specific proteins (SP-A, B, C, and D) [2–9]. Lung surfactant, like other surface-active substances, adsorbs spontaneously to an air-water interface because doing so lowers the energy of the interface [10]. Lung surfactant continues to adsorb until the normal air-water surface tension, γ, of ~ 70 mN/m (dyne/cm) decreases to ~ 30 mN/m at equilibrium [11, 12]; this equilibrium surface tension is similar for native and most clinical replacement surfactants [13]. In normal lungs, after secretion of LS in the form of multilamellar bodies from alveolar type II cells [14–16] surfactant must unpack, move across the alveolar hypophase, adsorb to the air-water interface, and then transform from bilayer to monolayer and spread over the interface [4]. Similarly, exogenous surfactant, introduced into the airway of a patient with lung disease, must travel to the periphery of the lung, adsorb and spread to cover the air-liquid interface, despite the presence of any other surface-active materials present in the alveoli. For both normal and exogenous surfactant, adsorption through the liquid subphase is the primary route of surfactant accumulation at the interface.
Why is this reduction in equilibrium surface tension so important to breathing? Surface tension causes the pressure in an air bubble (Pin) of radius, R, (a simple model for an alveolus with radius R) within a confining liquid (Pout) to increase according to Laplace’s equation: Pin − Pout = ΔP ≈ 2γ/R. Breathing is initiated by motion of the diaphragm, which induces a negative pressure (vacuum) on the outsides of the alveoli (Pout); during breathing, the ambient pressure, Pam, must be less than the pressure inside the alveoli, Pin, so that air can flow into the alveoli and gas exchange can occur. During breathing, the increase in pressure in the alveolus due to surface tension, ΔP ≈ 2γ/R, must be such that an overall negative pressure (Pin − Pam < 0) remains between the air inside and outside the body so that air flows into the lungs. Hence, surface tension requires that the diaphragm generate a lower pressure (greater vacuum) so that Pout + 2γ/R = Pin < Pam, a lower pressure than would be necessary in the absence of surface tension. The lower the surface tension, γ, the less force (Force = Pressure × surface area of lung) must be developed by the motion of the diaphragm, and the less work (Work = Force × Distance) is necessary for breathing. If the diaphragm cannot generate the necessary vacuum, air no longer flows into the lungs; if too much work is required to generate this vacuum, little energy is left for anything else. Simply put, the evolution of air-breathing required the co-evolution of lung surfactant [17].
A second consideration necessitating lung surfactant is that at any given time during breathing, different alveoli will be in different states of inflation. This means different values of R, different Laplace pressures, ΔP ≈ 2γ/R, and different values of Pin in different alveoli, with the less inflated, smaller alveoli having the larger Pin. Hence, the smaller alveoli tend to get even smaller and eventually collapse, and their high-pressure gas contents flow to the larger alveoli with their smaller pressures [18]. The corresponding liquid layer thickens in the less inflated alveoli, because the corresponding Laplace pressure inside the liquid in the deflated alveoli is less than in the liquid lining more inflated alveoli. The net result is that the smallest alveoli can collapse and fill with liquid and become difficult to re-inflate. While part of the lung collapses, other parts are over-extended.
Lung surfactant solves this second problem by reducing the surface tension as the air-epithelial fluid interface in the alveolus shrinks during expiration. Surfactant molecules are effectively insoluble in the alveolar liquids, which traps the surfactant at the interface (at least over the time scales relevant to breathing). The area available per surfactant molecule at the interface decreases along with the decrease in the alveolar interfacial area. As the interfacial density of the surfactant increases, the surfactant molecules bump into each other more and more, which induces a force opposing the surface tension of the liquid. This “surface pressure”, Π (Π = γw−γ; γw is the surface tension of a clean air-water interface, 72 mN/m, and γ the measured surface tension) exerted by the surfactant acts to expand the interfacial area in opposition to the surface tension of the liquid-air interface, which acts to decrease the interfacial area. These opposing forces cause the net interfacial tension to decrease during compression of the interface; a good lung surfactant can lower this dynamic interfacial tension to near zero. The minimum dynamic interfacial tension is limited ultimately by the strength and cohesion of the monolayer film. Eventually, the monolayer “collapses” and the film folds, buckles, deforms, cracks, etc. into either the subphase or the air [19–25] (See Fig 7). After this monolayer collapse, enough lung surfactant must remain at the interface (or re-adsorb to the interface) to respread and cover the expanding alveolar interface during inspiration to restore the equilibrium surface tension and the low dynamic surface tension during the subsequent breath.
Figure 7.
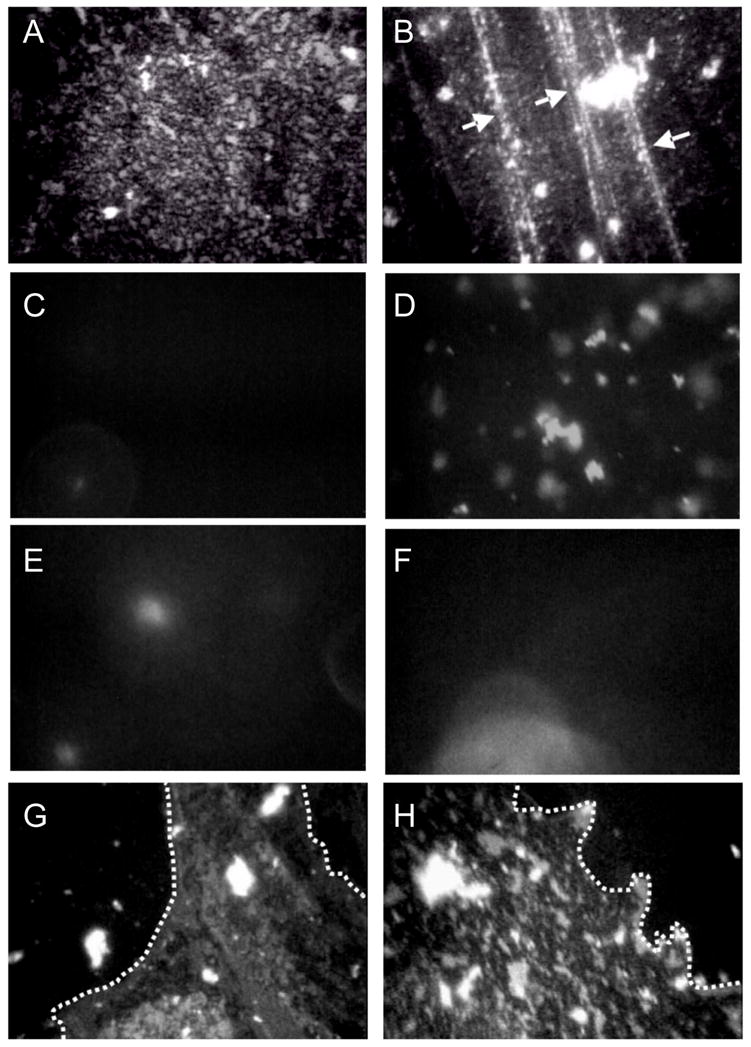
Fluorescence images of 800 μg Survanta spread at varying subphase compositions. Images are 180 μm by 250 μm. The left column is for each subphase composition at Π = 18 mN/m (a, c, e, g) and the right column is for each subphase at the maximum surface pressure reached during the cycle (66,40,31,38 mN/m, respectively for b, d, f, h). Row 1-Survanta on a clean, buffered subphase. (a) shows the mottled texture typical of a phase separated lipid/protein monolayer. The mottled texture is found at all surface pressures from 0 to collapse. (b) Arrows denote cracks where material is forced from the interface at the collapse plateau at 66 mN/m.
Row 2-Survanta on buffer containing 2 mg/mL albumin. (c) At low surface pressure, no fluorescence is visible showing that the albumin prevents Survanta from adsorbing to the interface. (d) After several expansion and compression cycles (see Fig. 1b), Survanta comes close to the interface, but does not spread due to the albumin film at the interface. (Compare to e – h)
Row 3- (e) During the first cycle for Survanta spread on buffer containing 2 mg/mL albumin and 0.12% wt. PEG, small areas of the interface are starting to become covered with Survanta. (f) The Survanta monolayer begins to displace the albumin (arrow).
Row 4- (g) By the third expansion-compression cycle for Survanta spread on buffer containing 2 mg/mL albumin and 0.12% wt. PEG larger areas have a morphology similar to Survanta on a clean interface (Row 1, a,b) in coexistence with areas similar to albumin (Row 2, c, d). The dotted white lines denote the borders between the Survanta and albumin regions. 0.12 wt% PEG is not sufficient to allow for sufficient Survanta adsorption to completely displace the albumin (See Fig. 3). For ~ 1 wt% PEG, the images are identical to Row 1 for all cycles (not shown) Figure adapted from [83].
A good lung surfactant, therefore, provides both a low equilibrium surface tension and an even lower dynamic interfacial tension which minimizes the work of breathing, stabilizes alveoli against atelectasis during expiration, prevents excess liquid from accumulating in the lung, and insures uniform inflation on inspiration [2–6, 8, 9, 18]. Every air-breathing mammal has some form of lung surfactant, often very similar in composition to human lung surfactant [17, 26–29]. This is why replacement surfactants for diseases associated with surfactant deficiency or inhibition are harvested from cows (Survanta), calves (Infasurf) and pigs (Curosurf), the most common large mammals raised for food in the US and Europe.
Although essential to breathing, lung surfactant [2, 30–33] and its importance in the development of neonatal respiratory distress syndrome (NRDS; known as hyaline membrane disease at that time) [8, 34] was only begun to be appreciated in the late 1950’s. In NRDS, the lack of functional surfactant results in a progressive failure of the lungs, which is manifested clinically by atelectasis (alveolar collapse), decreased lung compliance (stiff lungs that require a greater pressure differential to inflate), decreased functional residual capacity (a measure of the amount of air left in the lungs after exhalation), systemic hypoxia (oxygen starvation), and lung edema (accumulation of fluid in the lungs) [2–4, 8, 30–32, 34, 35]. Only since the 1980’s have infants with NRDS been treated with replacement surfactants, which has significantly reduced neonatal mortality [9, 36]. Surfactant-deficient infants typically have less than 5 mg/kg of LS in their lungs, while typical healthy newborns have approximately 100 mg/kg. In 2002, RDS affected an estimated 24,000 newborns in the US [9]. Surfactant replacement is an expensive therapy; but it is cost-effective relative to neonatal intensive care [37] and has contributed to a decline in the infant mortality rate in the US.
The first clinically approved replacement lung surfactant, Exosurf, was a synthetic mixture of dipalmitoylphosphatidylcholine (DPPC, the major lipid component of native LS), hexadecanol, and the non-ionic surfactant, tyloxapol. Although efficacious, Exosurf does not contain the lung surfactant specific proteins SP-B and SP-C or any synthetic replacement peptide or protein [2]. Survanta, Curosurf and Infasurf, currently the three most-used clinical surfactants in the US, are organic solvent extracts from minced cow (Survanta) or pig (Curosurf) lungs, or extracted with organic solvents from the aqueous lavage of calf lung (Infasurf) [3, 4]. The compositions of all four clinically approved surfactants vary widely in lipid composition; there still is no generally accepted lipid composition for a replacement surfactant, although DPPC is the major lipid species of all of the replacement surfactants.
As yet, there is no clinical surfactant replacement that is as effective as whole, native lung surfactant collected directly from lavage. Whole surfactant from lavage cannot be used in human therapy due the potential for contamination by water-soluble non-surfactant proteins or infectious agents. In addition, the hydrophilic surfactant proteins SP-A and SP-D can be highly immunogenic. While the lung surfactant specific proteins SP-B and SP-C are essential to surfactant function, none of the animal extract surfactants contains even half the levels of SP-B and SP-C as native surfactant due to losses during organic solvent extraction and purification [28]. Although there is no clinical surfactant that contains SP-A, this hydrophilic protein makes up the largest fraction of LS protein, and is believed to be important to LS adsorption as well as to lung host-defense. SP-A is hydrophilic, so it cannot be harvested by organic extraction.
One goal of research in LS is to develop an entirely synthetic replacement surfactant that should reduce costs of NRDS treatment, improve uniformity, and decrease the likelihood of contamination with infectious agents [4, 9]. However, as the myriad functions and properties of lung surfactant are still being discovered and the relationship between lung surfactant composition and function is only slowly being revealed, there is likely a great deal of room for improvement and new lung surfactant formulations are in the pipeline.
Surfactant Inactivation
In certain cases, meconium aspiration syndrome being an example, neonatal replacement surfactant therapy is less effective because surfactant somehow loses the ability to reduce surface tension and is said to be “inactivated” [3, 9, 13, 38–42]. Surfactant inactivation is a qualitative term for the inability of nominally sufficient amounts of surfactant to lower surface tension to levels necessary for lung function [3, 9]. Surfactant inactivation likely contributes to the severity of acute lung injury (ALI) and acute respiratory distress syndrome (ARDS) in both children and adults. ARDS, the more acute form of ALI, [43] was first described in 1967 and shares many symptoms with NRDS, although ARDS occurs as a rapid onset of respiratory failure that can affect patients regardless of age [9, 44–47]. ARDS has an incidence of 150,000 cases per year (U.S.) and a mortality rate of 30–40% [48–50]. The pathophysiology of ARDS involves injury to the alveolar-capillary barrier, lung inflammation, atelectasis, surfactant dysfunction, and intrapulmonary shunting. The disorder typically appears within 12 to 24 hours of an identifiable clinical event such as gastric content aspiration, pneumonia, near-drowning, toxic gas inhalation, or chest/lung trauma. In addition, ARDS may be associated with systemic processes such as sepsis, non-thoracic trauma, acute pancreatitis, major surgery, multiple blood transfusions, fat embolism, or shock. No specific therapy for ARDS currently exists.
While ARDS has a more complicated pathology than the simple absence of surfactant responsible for NRDS, ARDS shares many NRDS symptoms such as diminished lung compliance, marked restriction of functional lung volume, and hypoxemia. Hence, it was hoped ARDS might respond favorably to surfactant replacement therapy. So far, results have been mixed. Early clinical trials with the most effective formulations used in NRDS provided modest and transient improvement in adult ARDS patients [3, 44, 47, 48, 50, 51], suggesting that ARDS involves not only a lack of functional surfactant, but a mechanism of inactivation that renders both endogenous and exogenous surfactant ineffective. However, recent trials conducted with pediatric acute lung injury patients have shown significant and positive impacts on mortality after treatment with large doses of exogenous surfactant, especially those containing SP-B and SP-C [52–55].
There are many ways surfactant can be inactivated at various points in the surfactant life cycle; from transcription and protein translation, during multivesicular and lamellar body formation in the type II cell [14–16, 56], secretion into the alveolar liquid layer (subphase) from the type II cells, transformation from lamellar bodies to tubular myelin to membrane vesicles [3], re-uptake by type II cells or macrophages, losses due to transport out of the alveoli to the airways [3], or chemical degradation [9, 41, 57–59]. However, most of these mechanisms should respond favorably to surfactant replacement therapy [41]. Other abnormalities include modification of the phospholipid composition of LS, with decreased relative amounts of phosphatidylcholine and phosphatidylglycerol and an increase in cholesterol [60–62]. These biochemical abnormalities correlate with the severity of respiratory failure [35]. One reason is that increased cholesterol levels increase the minimum surface tension on monolayer compression [60, 61, 63, 64]. Lipase [65] or oxidative [57, 58, 66] damage to lipids or SP-B or C [58, 67] may also contribute to inhibition. These forms of inactivation are often slow to develop and are permanent, and could also result in degradation of exogenous surfactant over time.
However, in ARDS and ALI, inactivation is rapid. Understanding how this inactivation occurs might explain why exogenous surfactant does not have the dramatic effect in treating adult lung injuries that are seen in treating premature infants with surfactant deficiency [9, 13, 44–46, 49, 68–74]. In vivo, rapid surfactant inactivation in ARDS patients often correlates with the presence of a variety of water-soluble and surface-active substances normally absent from the alveoli [3, 44, 68, 72, 75, 76] including serum proteins, bile salts, lysolipids, and other contaminants [46, 68–70]. For example, reports of the average albumin concentrations in the alveolar fluid of ARDS patients and healthy patients vary widely, but consistently suggest an increase during ARDS: from 0.5 mg/mL for ARDS patients compared to 0.03 mg/mL for healthy patients in one reference [72] to 25 mg/mL for ARDS patients compared to 5 mg/mL for healthy patients in another report [76]. Protein concentration in the alveolar fluids of ARDS patients has been shown to correlate with the severity of the disease [77]. Da Silva et al. [62] have shown that serum proteins leaking into a ventilated rat lung led to significant decreases in surfactant performance and lung compliance; the effects on the surfactant were less when the lung was flushed to remove blood and reduce cholesterol. In vitro, there is an ARDS-like depression of LS activity when serum proteins are added to a LS-covered interface [68–70, 74, 78], LS is added to a serum-covered interface [13, 79–84] or both LS and serum proteins are presented simultaneously [85–87].
A common feature of these inhibitors of LS activity is a competing surface-activity; serum proteins, lysolipids, bile salts, etc. also spontaneously adsorb to the air-water interface and lower the surface tension. Surfactant inactivation is known to be strongly dependent on both the species and concentration of inhibitor [13, 42, 68, 88, 89], as is the surface activity. Unlike lung surfactants, which are insoluble in saline, these inhibitors can exist both at the interface and in solution; as a result, the surface tension does not drop appreciably on compression of the interface [74, 90, 91]. Serum proteins, lysolipids and bile salts have a surface pressure that is a logarithmic function of concentration up to a saturation concentration, i.e. they form Gibbs-type monolayers in many ways similar to simple detergents such as sodium dodecyl sulfate (SDS) [74, 91].
In Figure 1, the surface pressures of fibrinogen, albumin and IgG, three serum proteins commonly implicated in surfactant inhibition, are given as a function of concentration. Regardless of the protein or the concentration beyond saturation, the surface pressure does not increase to more than ~ 25 mN/m for any serum protein at equilibrium [91]. From Figure 1, albumin and fibrinogen reach the saturation surface pressure at concentrations ~ .1 mg/ml, while IgG requires 100 times that concentration to reach saturation. This concentration dependence of surface activity correlates with earlier work [92] establishing the relative inhibitory capacity of serum proteins. In Seeger et al. [92], albumin and fibrinogen were shown to be potent inhibitors requiring concentrations of just .1 and .01 mg/ml respectively, while IgG had little effect even at 1 mg/ml. This relationship between inhibitory power and surface activity appears to hold for non-protein inhibitors as well. For lysopalmitoylphosphatidylcholine, the surface pressure at the surface saturation concentration of .004 mg/ml is 34 mN/m. Holm et al. showed that lysophosphatidylcholine is a more potent inhibitor than albumin [70, 88]. Cockshutt has shown that lysolipids increase the sensitivity of lung surfactants to inhibition by serum proteins, even at very low concentrations [93], consistent with the higher surface activity of the lysolipids.
Figure 1.

Surface pressure π vs. protein concentration for bovine albumin, fibrinogen and IgG at 25 ± 1 C in buffered saline; this behavior is consistent with the serum proteins forming Gibbs-type monolayers. Fibrinogen and albumin exert a higher surface pressure than IgG at all concentrations measured. Fibrinogen and albumin reach their saturation concentrations at ~ .1 – 1.0 mg/ml, while the IgG concentration at saturation is ~ 10 mg/ml. The lower the concentration required to reach the saturation concentration, the more surface-active is the molecule and the greater is its ability to inactivate lung surfactant. However, the saturation surface pressure, Πsat, never goes much beyond 20 – 25 mN/m for all surface active serum proteins [91] and the surface pressure does not increase significantly on compression of the interface [74].
Equilibrium vs Kinetic Effects
The equilibrium surface pressure, Πeq, is the negative derivative of the Gibbs free energy, G, with respect to the interfacial area, A: [10]; therefore, the higher the equilibrium surface pressure of a given surface-active species, the more thermodynamically stable it is at the interface, and the more likely this species will occupy the interface relative to another of lower equilibrium surface pressure. For LS, Πeq (~ 40 mN/m [13]) is much higher than that of serum proteins (Πeq ~ 20 mN/m [74, 91]) or lysolecithins (Πeq ~ 30 mN/m). Therefore, LS should always be the dominant species at the air-water interface under equilibrium conditions.
However, in the expanding and contracting lung, it is doubtful if interfacial equilibrium is ever established; hence, kinetics plays the dominant role in determining which species adsorbs to the air-water interface. In vivo, LS likely never adsorbs to a pristine air-saline interface, even though this is how almost all in vitro experiments with LS begin. It is inevitable that other surface-active species (in addition to LS) compete for the interface, or must be displaced from the interface if present. New interface is created continuously during the expansion of the alveoli that accompanies inspiration, interface that must be coated with surfactant for proper breathing. Hence, if surfactant adsorption and/or spreading are slow relative to inhibitor adsorption, surfactant may not reach the interface in the concentrations needed to properly reduce surface tension, and “inactivation” is a possible result [74].
For example, [9, 13, 41, 42, 68, 70, 74, 79–85, 94–96] serum proteins can slow or even prevent LS from reaching the interface and lowering surface tension. Figure 2 shows that the time necessary for the clinical surfactant Curosurf to reach its equilibrium surface pressure, Πeq of ~ 42 mN/m, dramatically increases with increasing concentrations of human serum in the subphase. What is curious is that the rate of increase in Π is slowed only for surface pressures below the serum Πeq of ~ 20 mN/m and the slowing is proportional to the serum concentration. However once the serum equilibrium surface pressure was exceeded, further increases in Π up to the equilibrium surface pressure of LS were similar to that of the serum-free interfaces, and independent of serum concentration [13]. Πeq of the LS (~ 42 mN/m) was also independent of the serum concentration, suggesting that the composition of the adsorbed LS film was independent of the serum presence or concentration [13]. The shape of the adsorption curves suggest that as the surfactant adsorbs, it first concentrates the serum proteins in discrete domains at the interface so that the surface pressure increases to the serum Πeq as the adsorbing LS restricts the interface area available for the proteins. This co-adsorption is consistent with fluorescence images (Fig. 7) and X-ray diffraction (Figs. 8,10) [79, 80, 82–84, 97] that shows albumin and LS coexist at an air-water interface. As surfactant adsorption increases, the serum proteins must be displaced from the interface; as the surface pressure increases above the serum Πeq, the serum proteins are displaced from the interface and return to the subphase [13, 79, 80, 82–84, 97]. At higher serum concentrations in the subphase, the interfacial density of serum is also higher, and surfactant must displace more protein to adsorb and raise the surface pressure. Once the serum proteins are substantially removed from the interface by the spreading LS, additional LS appears to adsorb more readily to a LS-covered interface than to a serum protein-covered interface.
Figure 2.

Fixed amounts of the clinical lung surfactant Curosurf deposited within a buffered subphase (24°C) containing increasing concentrations of human serum. ● no serum; ○ 0.4 μl serum/mL buffer; ▼; 0.8μl serum/mL buffer; ▽ 1.7 μl serum/mL buffer. The rate of increase in surface pressure after addition of Curosurf decreased below ~ 20 mN/m (dotted line), and was proportional to the serum concentration. Above ~ 20 mN/m, the rate of increase in surface pressure was similar to that of the serum-free surfaces. The critical surface pressure at which the rates change is roughly equal to the equilibrium surface pressure, Πeq, of a subphase containing serum, ~ 20 mN/m (see Figure 1) [74, 91] The data suggests that as the surfactant adsorbs, the surfactant compresses the serum components at the interface up to Πeq, at which the serum components are squeezed-out from the interface back into the subphase. At higher serum concentrations in the subphase, more serum is adsorbed to the interface (Fig.1) and it takes longer for surfactant to adsorb and raise the surface pressure to Πsat. This decrease in the rate of adsorption with serum proteins can cause insufficient surfactant to adsorb to the interface in the time available during respiration Figure adapted from [13].
Figure 8.

Bragg peaks (a) and Bragg rods (b) from GIXD scans of 200 μg Survanta spread onto a saline buffer subphase. (a) Bragg peaks at 20–50 mN/m. The points indicate instrument data, the black curve is the overall fit and the blue curves are fits of the individual peaks. The packing changes from distorted hexagonal to hexagonal at 40 mN/m (see schematic in Table 1). A second unknown phase is visible at 1.42 Å−1 at higher surface pressures. (b) Bragg rods at 20–50 mN/m. The local maximum of the Bragg rod profile shifts left with increasing surface pressure indicating a reduction in tilt of the molecules relative to the normal; the molecules are normal to the interface for Π ≥ 40 mN/m as indicated by the lack of a local maximum for z > 0. The lattice spacings and details of the molecular ordering are given in Table 1. Figure adapted from [97].
Figure 10.

Bragg peaks (a) and Bragg rods (b) from GIXD scans of 600 μg Survanta spread onto a saline buffer subphase containing 2 mg/mL albumin. (a) Bragg Peaks at 20–30 mN/m. The points indicate the diffraction data, the black curve is the overall fit and the blue curves are fits of the individual peaks. The first two panels show different regions of the film at the same surface pressure. Surface pressures higher than 28 mN/m cannot be sustained due to the presence of albumin. The distorted hexagonal lattice is slightly shifted compared to Survanta on a saline buffered subphase (See Table 1 for details). The last panel shows a GIXD scan at 20 mN/m after two additional cycles; the Survanta peaks are no longer present. (b) Bragg rods at 20–28 mN/m for scans containing Survanta peaks. At each surface pressure, a local maximum occurs for z > 0 and at a given surface pressure the molecular tilt is somewhat greater than on the control subphase Figure adapted from [97].
If the subphase concentration of protein is high enough, LS added to the subphase never reaches the interface and the surface pressure remains near the Πeq of albumin (Fig. 3). The expansion and compression isotherms of Survanta on an albumin-containing subphase (Fig. 3b) do not show the characteristic features of Survanta on a saline buffer (Fig. 3a); the isotherms are nearly identical to that of albumin alone, showing that significant amounts of Survanta have not reached the interface (See Fig. 7). There is a small amount of hysteresis in the isotherm of albumin suggesting that the albumin changes its conformation, orientation or packing at the interface and is less able to return to the saline subphase after compression [98].
Figure 3.

(a) Normal isotherms of Survanta, a clinical lung surfactant, on a buffered saline subphase. (b) Survanta on a 2 mg/ml albumin subphase. The Survanta plus albumin isotherm is indistinguishable from the albumin only isotherm (red). Only albumin is adsorbed to the interface under these conditions.
LS Bilayer Organization and Interactions in Solution
Both endogenous and exogenous surfactants are inactivated in ALI and ARDS; hence it is possible that serum proteins mix with or otherwise alter LS bilayers in solution, thereby altering the properties of the surfactant. Previous researchers have speculated that there might be a relationship between inhibition and surfactant microstructure [99–101] based on transmission electron microscopy of chemically fixed clinical lung surfactants. However, clinical surfactants are ~98% lipid, and lipid aggregates are notoriously difficult to fix via the conventional chemical techniques of glutaraldehyde-osmium tetroxide fixation and ethanol dehydration [14–16, 56, 102]. In comparison, rapid freezing methods [103] provide more artifact-free images of lipid bilayer samples in their hydrated state with no added chemical fixatives, while preserving both the distribution of the aggregates in the original dispersion and the microstructure and bilayer organization of the aggregates [87, 103–122].
LS contains disaturated dipalmitoylphosphatidylcholine (DPPC), unsaturated phospholipids, and the two hydrophobic LS specific proteins SP-B and SP-C [28], all of which are effectively insoluble in physiological saline. As a result, the fundamental building blocks of LS self-assembly in solution are bilayers; these bilayers further organize into more complex multilamellar liposome-like aggregates 1 – 100 microns in diameter [87, 103] (Figure 4). Although the basic structural unit is the bilayer, the bilayers within the clinical surfactants are organized in quite different ways, likely due to the differences in lipid composition, especially the fraction of saturated vs unsaturated lipids, as well as the fraction of charged lipids and cholesterol. Survanta forms the largest aggregates with the smallest bilayer spacing, consistent with a highly ordered, likely gel phase bilayer due to its high fractions of DPPC and palmitic acid [123, 124, 125.]. Infasurf, with the smallest fraction of saturated lipids, forms very open, multicompartment structures with a large amount of water contained within the aggregate, indicative of highly fluid and fluctuating bilayers. Curosurf, with intermediate saturated lipid fractions, forms aggregates that are intermediate between the structures of Survanta and Curosurf (Fig. 4).
Figure 4. Optical phase contrast (left column) and freeze-fracture electron (right column) microscopy images of Curosurf (A, B), Infasurf (C, D) and Survanta (E, F).
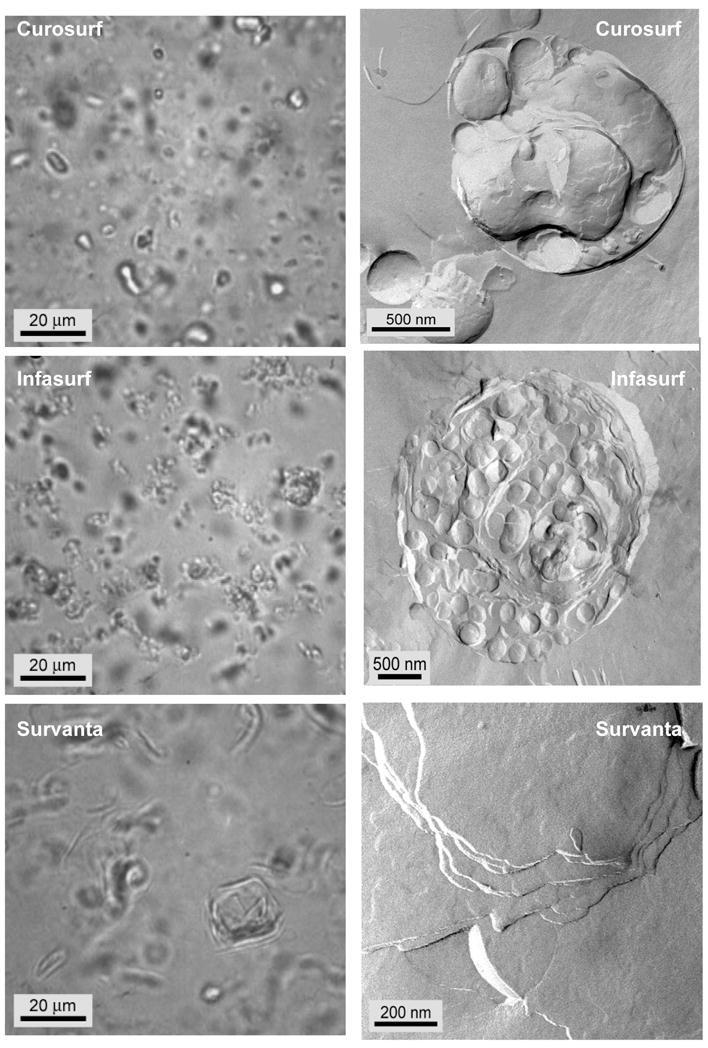
A, C, E: The optical images show that all of the clinical surfactants consist of dispersed, small aggregates, with Survanta being the largest.
B. Individual Curosurf aggregates are multilamellar and typically had some void space between bilayers and “pockets” of water within the aggregate. This is consistent with the small angle X-ray scattering that showed broad reflections indicative of poor correlations between the bilayers.
D. Infasurf aggregates had a multicompartment bilayer structure with densely packed interior vesicles and large water pockets. The structures are similar to vesosomes, a vesicle in vesicle drug delivery vehicle [115–117, 216].
F. Survanta aggregates were typically too large to be imaged as individual particles in TEM. Here we show the multilamellar stacks of well-ordered bilayers within the larger aggregates. There are no water pockets within the Survanta particles. The degree of organization of the aggregates scaled with the fraction of saturated phospholipids and fatty acids, with Survanta being the most ordered and having the most saturated lipids, and Infasurf having the least ordered aggregates, with the highest unsaturated lipid and cholesterol fraction (Figure adapted from [87]).
The bilayer-bilayer interactions that determine the equilibrium bilayer d-spacing (or bilayer repeat spacing, which is a combination of the bilayer thickness plus any water between the bilayers) are a balance of van der Waals attraction [79, 126–128] and a combination of the Helfrich undulation repulsion [126, 127, 129–132] and electrostatic double-layer repulsion [87, 120, 121] (Eqn. 14). Small angle X-ray scattering shows that when 10 kDa polyethylene glycol polymer is added to Curosurf, the bilayer d-spacing decreases as shown in Fig. 5. The same thing happens when sufficient albumin is added to the Curosurf suspension. This reduction in the d-spacing implies that macromolecules such as 10 kDa PEG or albumin cannot enter the aqueous spaces between the surfactant bilayers or incorporate within the bilayers themselves [133–135]. This exclusion of the PEG or albumin generates a concentration difference between the inside and outside of the bilayer shells that make up the aggregate, which in turn, generates an osmotic pressure difference that causes the water between the bilayers of the aggregate to be expelled, and the bilayer d-spacing to decrease so as to equalize the pressure between the bilayers with the applied external osmotic pressure.
Figure 5.

Bilayer d-spacing measured by small angle X-ray scattering from dispersions of Curosurf, Curosurf plus albumin and Curosurf plus albumin and 10 KDa PEG polymer as a function of the osmotic pressure of polymer or polymer plus albumin. For osmotic pressures greater than 103 dynes/cm2, the d-spacing decreases exponentially with increasing osmotic pressure with a decay length of 0.72 nm, which is nearly identical to the calculated Debye length of the solvent, κ−1 = 0.77 nm, confirming that the bilayers interaction is dominated by the electrostatic double-layer repulsion [133, 134]. For comparison to Figs. 4, 6, the osmotic pressure of 2 wt% albumin is < 103 dynes/cm2 and the osmotic pressure of 5 wt% 10 kDa PEG is ~ 106 dynes/cm2. The albumin and polymer act primarily as osmotic agents that dehydrate the bilayers, confirming that albumin and polymer do not adsorb to or penetrate the surfactant aggregates. Figure adapted from [87].
With no albumin or polymers in the solution, Curosurf has a bilayer d-spacing of about 11 nm, which decreases to about 6 nm at the highest PEG and/or albumin concentration, and hence, applied osmotic pressure. As the bilayers come closer together, the inter-bilayer repulsion increases, thereby increasing the internal pressure between the bilayers. The functional form and characteristic decay length of the interbilayer pressure is determined by the origin of the interactions between the bilayers. If the electrostatic double-layer repulsion (See 2nd term in Eqn. 14) dominates the bilayer-bilayer interaction [133–135], the relationship between d-spacing and applied pressure is exponential:
| (1) |
| (2) |
with a characteristic decay length given by κ−1, the Debye length (T is the absolute temperature, kB is Boltzmann’s constant, 1.38054 × 10⁻²³ N-m/K, zi is the valence of ionic species i, e is the electron charge, 1.6021 × 10⁻¹⁹ C, ε0 is the permittivity of the vacuum, 8.854 × 10⁻¹² C2/N-m2, and ε is the dielectric constant of the solution, about 80 for water [136]. In practical units, for an aqueous buffer at 25° C [128]. For the buffered, physiological (150 mM NaCl, 2 mM CaCl2) saline used, the ionic strength, moles/liter, which gives κ1 ~ .77 nm (ρi is the molar concentration of each ion and zi is the charge on that ion [128].) Any additional counterions from the anionic lipids in the surfactant (or albumin) increase the ionic strength and further reduce κ−1. Fig. 5 shows that the bilayer d-spacing for Curosurf is an exponential function of the osmotic pressure with a characteristic decay length of 0.72 ± .02 nm, which is in excellent agreement with the calculated Debye length. This behavior is typical for fluid bilayers with a significant fraction of charged lipids stabilized by double-layer repulsion [133–135]. Zeta-potentials of −10 to −15 millivolts have been measured for other LS aggregates, which are also consistent with electrostatic double-layer interactions [137].
Figure 6 shows freeze-fracture TEM images of Curosurf and Infasurf aggregates in a buffer solution containing 2 wt% albumin (left) or 5 wt% 10 kDa PEG (right). 2 wt% albumin is more than sufficient to prevent LS adsorption, (Figs. 2,3,7) but does not alter the bilayer organization within LS aggregates (compare to Fig. 4). Individual albumin molecules adsorbed to or incorporated within the bilayers would appear as 5 – 10 nm high bumps or pits on the bilayer surfaces in freeze-fracture images [109]. However, the bilayers remain as smooth as when there is no albumin in solution. This is consistent with the SAXS data in Fig. 5 that shows that the primary effect of albumin in the bulk (even at much higher concentrations) is as an osmotic agent that does not penetrate the aggregate. The osmotic pressure of a 2 mg/ml albumin solution is ~ 103 dynes/cm2, which is not sufficient to alter the spacing of the Curosurf bilayers (See Fig. 5). While Infasurf, Curosurf and Survanta have quite different compositions and microstructures, albumin does not adsorb to or alter the lamellar organization of any of the clinical surfactants at concentrations at which surfactant adsorption is inhibited.
Figure 6.

Freeze-fracture TEM images of Curosurf (top row) and Infasurf (bottom row) aggregates in a buffer containing 2 wt% albumin (left) or 5 wt% 10 kDa PEG (right). 2 wt% albumin does not appreciably alter the aggregate morphology (compare to Fig. 4), while it is more than sufficient to prevent LS adsorption. 5 wt% 10 kDa PEG causes the bilayer spacing in both Curosurf and Infasurf aggregates to decrease (see Fig. 5) and eliminates the water-filled void spaces within the aggregates. The bilayers were more ordered after exposure to PEG (compare to Fig. 4). For Infasurf in 5 wt% 10 kDa PEG, instead of the vesicle within vesicle structure common when there was no PEG (Fig. 4), the aggregates were much more compact with concentric, parallel bilayers in onion-like structures [16, 56]. Figure adapted from [87]. These changes are consistent with PEG not being capable of crossing the bilayers and acting as an osmotic dehydrating agent.
In the presence of 5 wt% 10 kDa PEG (or proportionately high albumin concentrations), while there was little change in the average aggregate size, the organization of the bilayers within the aggregates was significantly altered. The average bilayer spacing decreased (as expected from the SAXS results) and there were no longer any water-filled void spaces within the aggregates. The bilayers were more ordered after exposure to PEG (compare to Fig. 4). For Infasurf in 5 wt% 10 kDa PEG, instead of the vesicle within vesicle structure common when there was no PEG (Fig. 4), the aggregates were much more compact with concentric, parallel bilayers in onion-like structures [16, 56]. The void spaces and water pockets were removed and the interior compartments fused. However, Survanta, which consisted of compact bilayers with no void spaces even without PEG, did not show significant morphological changes caused by adding PEG at 5 wt% (not shown).
Monolayer Structure, Organization and Collapse
Alterations in the organization and structure of the monolayer might also contribute to surfactant inactivation by serum proteins, leading to lower collapse pressures, poor respreading, etc. When the surfactant aggregates shown in Figs. 4, 6 contact the air-water interface, the bilayers break down to form insoluble, Langmuir-type monolayers and multilayers (Fig. 7 and See Movie 1 in Supplementary Materials). It appears that the aggregates must contact the interface to undergo this conversion. If there is insufficient area to spread on the interface, the bilayer aggregates can partially fuse with the monolayer or multilayer film without undergoing complete conversion (bright white patches in Fig. 7) [83, 138]. Figure 7 shows fluorescence images of Survanta (doped with 1 mol% of the fluorescent dye, Texas Red-DHPE; Molecular Probes, Eugene, OR) films at the air-subphase interface. The mottled black and gray textures in Fig. 7a are typical of a phase separated lipid/protein monolayer (Fig. 7a; Π = 18 mN/m); the scattered, bright white patches are aggregates partially fused with the interface. The gray patches, which contain a higher fraction of the fluorescent lipid dye, are disordered, fluid lipid domains mainly populated by unsaturated and anionic lipids and LS proteins [4, 20, 22, 139–141]. The dark gray patches, on the other hand, have semi-crystalline order of the lipids molecules (See Fig. 8), which excludes the fluorescent lipid dye. This ordered phase contains most of the DPPC, palmitic acid (PA) and other saturated lipids in LS [124, 125, 138, 141, 142].
Surfactant adsorbs only up to the Πeq of 40 – 45 mN/m (Fig. 2); to provide the necessary low tensions required for breathing, as the available interfacial area is reduced in the alveolus during exhalation, or on compression of the film in a Langmuir trough (Fig. 7b), the surface pressure increases to 65–70 mN/m as the available area per molecule of LS decreases. At some point, the interfacial film can no longer support an increasing surface pressure and the film fails or “collapses” [22, 24, 25]. At collapse, the film can no longer support the imposed stresses and lung surfactant films usually fail by buckling and forming three-dimensional cracks and folds. Fig. 7b shows the cracks and folds (arrows) at monolayer collapse in Survanta, which determines the maximum surface pressure, Πmax that can be achieved by the film (Fig. 7b; Πmax = 66 mN/m, surface tension of ~ 6 mN/m) [22, 23, 138]. The collapse mechanism [22, 24, 25, 61, 138, 140, 142–154] and respreading of the monolayer film are areas of intense interest, but will not be examined in this review.
In contrast, when Survanta is deposited on a buffered subphase containing 2 mg/ml albumin, the fluorescence images are featureless (Fig. 7c) or show isolated, out of focus bright spots (Fig. 7d) indicative of Survanta aggregates in the subphase kept from reaching the interface by the adsorbed albumin film. It appears that the Survanta does not undergo significant conversion from bilayers to monolayers and cannot unravel and expand to cover the interface unless the surfactant particle comes into contact with the interface. Quantitative comparisons shows that less surfactant adsorbs to the interface from 3.8 mg of Survanta deposited on an albumin subphase than from 30 μg of Survanta deposited onto a clean subphase [83]. Albumin in the subphase is roughly equivalent to lowering the surfactant concentration by a factor of 120! From the isotherms and the fluorescence images, the interface is essentially covered by albumin with very little surfactant.
Lung Surfactant Interfacial Organization
A second possibility underlying surfactant inactivation is that serum proteins alter the monolayer organization, causing the surfactant to collapse at lower surface pressures or in some other way to lose its ability to reduce surface tension. Table 1 summarizes the intermolecular d-spacings, lattice parameters, area per chain, and coherence lengths of the ordered portion of Survanta monolayers as a function of subphase composition and surface pressure (Fig. 7a). Grazing incidence X-ray diffraction (GIXD) provides information about the laterally ordered (liquid condensed and solid phases) domains within the monolayer; disordered (liquid expanded, fluid or protein-covered) areas of the film do not diffract appreciably and are effectively invisible [155]. The number and position of the Bragg peaks (Fig. 8a) allows the determination of the symmetry and repeat distances, d = 2π/qxy, of the 2D lattice. The sharper the peak, the better ordered the crystal, which is quantified by the coherence length, Lxy, in the different lattice directions. The Bragg rods (Fig. 8b) give the molecular tilt; if a local maximum in the intensity of the Bragg rod occurs for z > 0, the molecules in the monolayer are tilted with respect to the normal to the monolayer [155, 156].
Table 1.
| Phase 1 |
||||||||||
|---|---|---|---|---|---|---|---|---|---|---|
| Unit Cell Angle | ||||||||||
| Subphase | Π(mN/m)1 | Packing | Observed d-spacing d10 (Å) | Observed d-spacing d1-1 (Å) | a = b (Å) | γ° | Coherence Length Lc10 (Å) | Coherence Length Lc1-1 (Å) | Area per Chain (Å2) | |
| Saline Buffer | 20 | Dist. Hex | 4.38 | 4.24 | 4.95 | 118 | 100 | 175 | 21.7 |  |
| Saline Buffer | 30 | Dist. Hex | 4.29 | 4.22 | 4.90 | 119 | 115 | 265 | 21.0 | |
| Saline Buffer | 40 | Hexagonal | 4.21 | -- | 4.86 | 120 | 177 | -- | 20.5 | |
| Saline Buffer | 50 | Hexagonal | 4.19 | -- | 4.84 | 120 | 185 | -- | 20.3 | |
| PEG | 25 | Dist. Hex | 4.36 | 4.23 | 4.94 | 118 | 129 | 225 | 21.5 | |
| PEG | 30 | Dist. Hex | 4.32 | 4.22 | 4.91 | 118 | 131 | 237 | 21.2 | |
| PEG | 40a | Hexagonal | 4.18 | -- | 4.83 | 120 | 287 | -- | 20.2 | |
| PEG | 40 | Hexagonal | 4.19 | -- | 4.83 | 120 | 200 | -- | 20.2 | |
| PEG | 50 | Hexagonal | 4.20 | -- | 4.84 | 120 | 181 | -- | 20.3 | |
| Albumin | 20 | Dist. Hex | 4.53 | 4.28 | 5.04 | 116 | 64 | 296 | 22.8 | |
| Albumin | 30 | Dist. Hex | 4.36 | 4.24 | 4.94 | 118 | 113 | 312 | 21.6 | |
| Albumin/PEG | 20 | Dist. Hex | 4.25 | 4.21 | 4.88 | 119 | 183 | 399 | 20.7 | |
| Albumin/PEG | 30 | Hexagonal | 4.19 | -- | 4.84 | 120 | 494 | -- | 20.3 | |
| Albumin/PEG | 40 | Hexagonal | 4.18 | -- | 4.83 | 120 | 280 | -- | 20.2 | |
The first row for a PEG subphase at 40 mN/m is 200 μg Survanta while the second is 600 μg
Survanta d-spacings, unit cell parameters (see inset figure), coherence length and area per chain as a function of subphase composition and surface pressure. Phase 1 is the dominant phase and transitions from a distorted hexagonal lattice (a = b, γ ≠ 120°) to a hexagonal lattice (a = b, γ = 120°) with increasing surface pressure. The approximate molecular tilt relative to the normal to the interface is given by t° = cos(20.2/Ac), in which Ac is the area per chain (20.2 A2 is the minimum area per chain for orientations normal to the interface in a hexagonal lattice).
The coherence lengths are determined from the peak full widths at half maximum height (FWHM) relative to the instrument resolution FWHMresol(qxy) = 0.0084 Å−1. The intrinsic FWHM can be obtained from: FWHMinstrinsic(qxy) = [FWHMmeas(qxy)2 − FWHMresol(qxy)2]1/2 and the Scherrer formula defines the coherence length: L ≈ 0.9[2π/FWHMintrinsic(qxy)] [215].
Fig. 8 shows the Bragg peaks (Fig. 8a) and Bragg rods (Fig. 8b) from [155] monolayers of the LS, Survanta, as a function of surface pressure [97]. At Π = 20 mN/m, two Bragg peaks are observed, with the integrated intensity of the qxy = 1.44 Å−1 or {1,0} peak, roughly twice that of the qxy = 1.48 Å−1 or {1,−1} peak, indicating a distorted hexagonal lattice similar to DPPC and DPPC/palmitic acid mixtures under similar conditions [124, 125, 138, 142]. The lattice spacings (dxy = 2π/qxy) are d10 = 4.38 Å and d1-1 = 4.24 Å, corresponding to a distorted hexagonal unit cell (see schematic diagram in Table 1) with axes a = b = 4.95 Å and γ=118° [125]. This lattice spacing leads to a calculated area per hydrocarbon chain of 21.7 Å2. At 20 mN/m, the Bragg rod profile (Fig. 8b) exhibits a local maximum at qz = 0.41 Å−1, indicating that the lipid molecules are tilted relative to the surface normal [138].
At Π = 30 mN/m, the two Bragg peaks shift to qxy = 1.47 Å−1 and qxy = 1.49 Å−1 indicating a less tilted lattice. The local maximum in the Bragg rod moves closer to zero (qz = 0.23 Å−1) confirming the reduction in lipid tilt. At 40 mN/m, the single peak at qxy = 1.49 Å−1 indicates a transition to a hexagonal lattice (a = b, α = 120°) with d10 = 4.21 Å and . The Bragg rod has a maximum at z=0, indicating that the lipid molecules are normal to the interface. Increasing the surface pressure to 50 mN/m results in only a slight right shift of the main to peak to qxy = 1.50 Å−1; the Bragg rods again indicate that the molecules are untilted. Survanta films are more compact than DPPC films; a pure DPPC film at Π = 40 mN/m shows two Bragg peaks at qxy = 1.38 Å−1 and qxy = 1.46 Å−1 indicating that the DPPC lattice is still tilted [125, 157]. The solid phase domains in Curosurf and Infasurf have similar lattice spacings as Survanta, although since the fraction of DPPC is different, the surface pressure dependence of the lattice spacing and the tilt are also different [124, 125, 138, 142].
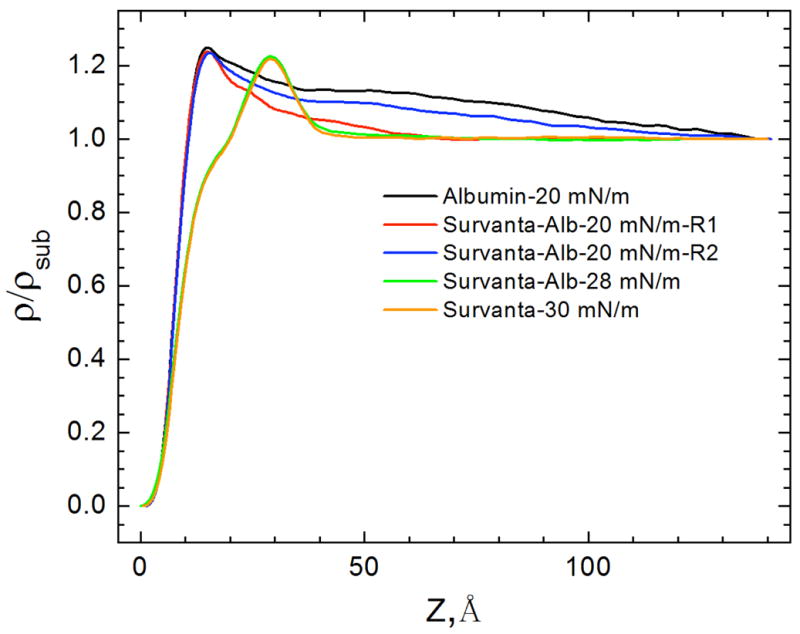
X-ray reflectivity (XR) provides the complementary laterally averaged electron density profile normal to the interface. Unlike GIXD, XR is sensitive to all materials at the interface regardless of local order. Fig. 9 shows the electron density profiles of adsorbed Survanta films, normalized by the subphase electron density (ρ(Z)/ρsub) [158–160]. For LS films, the electron density begins at 0 on the air side of the interface (Z = 0), rises sharply through the tail region, and reaches a maximum at the headgroup region at Z~30 Å before quickly decaying to the subphase electron density (ρ(Z)/ρsub = 1) at Z ~ 42 Å. The density of the headgroup maximum increases (1.17 to 1.22) and the width of the maximum decreases and shifts to the right with increasing surface pressure, indicating a reduction in the tilt of the tails, consistent with the Bragg rods in Fig. 8b [161].
Figure 9.

The electron density profiles calculated from X-ray reflectivity data normalized by the subphase electron density, for 200 μg Survanta spread on the control subphase. Increasing Z moves from the air (Z=0) through the interface and into the subphase. With increasing surface pressure, the density of the headgroup maximum increases, the width of the headgroup region decreases and the location of the headgroup maximum shifts right, consistent with the GIXD data in Fig. 8 that shows a steady decrease in the molecular tilt with increasing surface pressure Figure adapted from [97].
When Survanta is adsorbed to an interface from a subphase containing albumin, both GIXD and XR confirm that albumin and LS can coexist at the interface, consistent with the fluorescence images in Fig. 7. At Π = 20 mN/m, different areas of the interface showed dramatically different scattering patterns. Region 1 (Fig. 10a, first panel) shows no diffraction peaks, consistent with a disordered albumin film at the interface. However, Region 2 (Fig. 10a, second panel), which was obtained by simply moving the interface horizontally by several mm in the direction perpendicular to the X-ray beam, shows Bragg peaks consistent with a distorted hexagonal lattice with the {1,0} reflection at qxy = 1.39 Å−1 and the {1,−1} reflection at qxy = 1.47 Å−1. The lattice is slightly expanded compared to Survanta at 20 mN/m with a = b = 5.04 Å and γ=116°. The Bragg rods exhibit a local maximum at qz = 0.57 Å−1, indicating a greater molecular tilt than Survanta on the control subphase (Fig. 8b). While the isotherm (Fig. 3b) and fluorescence images (Fig. 7) [82–84] indicate that the albumin dominates the interface under these conditions, the appearance of diffraction peaks consistent with a distorted hexagonal lattice demonstrates that some ordered domains of Survanta have broken through to the interface. Compressing the film in the trough increased the surface pressure only to 28 mN/m (see Fig. 3b), which caused the two Survanta peaks to shift to qxy = 1.44 Å−1 and qxy = 1.48 Å−1, corresponding to a less tilted lattice. While there are subtle changes in the Survanta tilt and lattice spacing on albumin-containing subphases, the general features are unchanged [124, 125, 138, 142, 162]; it appears as if the albumin were slightly lowering the effective surface pressure. The last panel in Fig. 10 shows GIXD scans after two additional compression-expansion cycles; the Bragg peaks disappear, indicting that no ordered domains of Survanta remain at the interface; the albumin has displaced the Survanta from the interface. From the minimal changes in the lattice spacing and tilt of the Survanta, there is minimal mixing of the albumin film with the ordered fraction of the LS film at the interface.
XR electron density profiles confirm the albumin-LS coexistence at the interface. For albumin alone, the electron density at the interface increases more sharply than does Survanta (Fig. 11), reaching a maximum ρ/ρsub = 1.25 at Z = 15 Å. Other globular proteins such as β-lactoglobulin have a similar maximum electron density (ρ/ρsub = 1.20) [163]. Albumin is a prolate spheroid of dimensions 40 × 40 × 140 Å [164]. Unlike the electron density profiles for Survanta (Fig. 9), ρ/ρsub is significantly greater than 1 for 50 < Z < 100 Å. This suggests that a second layer of albumin [97] may form with the albumin long axis parallel to the interface. Both neutron reflectivity [164] and ellipsometry [165] also indicate a dense, closely packed albumin monolayer with a less dense second layer.
Figure 11.
The electron density profiles, normalized by the subphase electron density from X-ray reflectivity measurements for 600 μg Survanta spread on a saline buffer subphase containing 2 mg/mL albumin. No Survanta is present for the albumin-only subphase data. Region 1 and Region 2 are the same areas as the GIXD data in Fig. 10. For Survanta-albumin mixtures at 20 mN/m, the electron density profile is similar to albumin for both Region 1 and Region 2, while for 28 mN/m, the electron density profile is similar to Survanta (Fig. 9). Figure adapted from [97].
The electron density (Fig. 11) corresponding to Region 1 and Region 2 (defined in Fig. 10), are qualitatively similar to albumin even though GIXD showed small patches of ordered Survanta in Region 2. However, the electron density of the mixed Survanta/albumin films in both Region 1 and Region 2 decreased more quickly with increasing z than the albumin film. This suggests that Survanta has displaced the second layer of albumin (Fig. 7c,d). In contrast, the electron density of the mixed Survanta-albumin film at 28 mN/m, the highest surface pressure that could be achieved for the duration of the XR experiment, is very similar to that of Survanta on the control buffer at 30 mN/m. The GIXD curve of Survanta-albumin at 28 mN/m (Fig. 4) shows diffraction peaks, confirming that Survanta is at the interface. The ratio of Survanta to albumin at the interface apparently increases with increasing surface pressure. However, the film is still “inhibited” by albumin; the isotherms (Fig. 3) shows that the maximum surface pressure does not increase above 35 mN/m even after compression to the smallest trough area, suggesting that the Survanta never completely displaces the albumin.
At all surface pressures, 10 kDa PEG in the subphase induces minimal changes in the Survanta Bragg peaks and Bragg rods (Table 1) [97], indicating that PEG, like albumin, does not significantly modify the molecular lattice of the ordered domains of the surfactant. Additionally, Table 1 shows that at a specific surface pressure (Π = 40 mN/m) and subphase condition (5% wt. PEG), different amounts of Survanta (200 μg and 600 μg) yield nearly identical lattice parameters. This confirms that at a given surface pressure, there is a unique, fixed area per molecule [83] for a given temperature; the surface density is not a function of the subphase concentration, but only of the surface pressure and temperature.
Kinetically Hindered Equilibrium and Analogies to Colloid Stability
The equilibrium spreading pressure, collapse pressure, LS aggregate sizes and shapes in solution, the bilayer d-spacing and the monolayer lattice spacing and tilt are not affected by albumin or serum at concentrations that inactivate LS performance [97]. Hence, this mechanism of inactivation does not involve alterations to the surfactant bilayer or monolayer. However, both albumin and LS prefer to occupy the air-water interface, resulting in a competition for the available area. Because of its nanometer size, albumin diffuses much faster than multi-micron bilayer aggregates of LS (Fig. 4, 6). The Stokes-Einstein diffusivity, DSE = kBT/6πηsa, shows that an albumin molecule 2 nm in radius, a, should diffuse 1000 times faster than a surfactant aggregate of radius 2 microns in saline with a bulk viscosity ηs. Hence, albumin and the other serum proteins will almost inevitably beat LS aggregates in the race to an uncoated interface [74, 166]. In both the expanding alveolus in the lung and the Langmuir trough, new air-water interface is continuously being created for this competitive adsorption [74]. In addition to competing for this new interface, LS must displace albumin from whatever part of the interface the protein already occupies in order to lower the surface tension so that proper lung function occurs. From the isotherms (Fig. 3b), fluorescence images (Fig. 7) and X-ray (Fig. 8–11), if a significant fraction of the interface is covered by albumin or serum proteins, sufficient LS cannot adsorb to the interface to raise the surface pressure to the levels needed for proper lung function for a given compression (Π > 60 mN/m, surface tension < 10 mN/m).
Clearly, there is something about the presence of serum proteins at the interface that inhibits lung surfactant adsorption [9, 13, 42, 68–70, 74, 88, 96, 167]. To adsorb, LS must first clean an area of interface by pushing the albumin aside, which reduces the overall driving force for LS adsorption [166]. Instead of increasing the surface pressure from zero at a clean interface to the ~ 40 mN/m equilibrium spreading pressure of LS, albumin already had increased the surface pressure to ~ 20 mN/m. This change in the driving force likely leads to changes in the desorption of albumin and the adsorption-desorption equilibrium for LS [166].
However, from the fluorescence images and isotherms, LS often does not even reach the interface. The isoelectric point of albumin is 5.2, and hence albumin, like LS, is negatively charged at physiological pH, which can induce an electrostatic energy barrier to adsorption [80, 96], preventing LS from reaching the interface and converting from bilayers to a surface-active film [42]. This energy barrier to LS adsorption is reminiscent of the energy barriers that stabilize colloidal dispersions and prevents them from coagulating [9, 13, 42, 80, 83, 84, 95, 96]. Colloidal dispersions should coagulate at equilibrium due to strong, short range interactions, yet they remain stable for years and even decades [79, 128, 136, 168, 169].
The stabilization of colloidal dispersions by proteins, including albumin, was first exploited for the preparation of ink in ancient Egypt and China as early as 2500 BC [170]. By mixing the soot from lamps with a solution of proteins (casein from milk, egg albumin, or gum Arabic), the ink could be dried and stored. When fluid ink was needed, the dried ink was dipped into water, and the soot particles coated by the proteins spontaneously re-dispersed and the ink was ready for use. Fast re-dispersion is a characteristic of colloids that are stabilized by proteins and other biopolymers [170].
The famous British chemical physicist, Michael Faraday, reported the first scientific study of the effects of albumin and other proteins on colloid stability in 1857 [171, 172]. In the absence of protein, a gold sol could be induced to aggregate by the addition of sodium chloride; aggregation was not observed when protein was present. Some of Faraday’s original gold colloids remain dispersed for over 100 years [172]. Richard A. Zsigmondy, who won the Nobel Prize in Chemistry in 1925, quantified the relative effects of different biopolymers in preventing the coagulation of a gold sol by a fixed concentration of sodium chloride, which he termed the “gold number” [173]. The gold number of a protein was defined as the amount in milligrams of protein which, when added to 10 ml of a gold sol, just prevents coagulation on the addition of 1 ml of a 10% salt (NaCl) solution. For gelatin, the gold number was ~ 0.01; for albumin, ~ 0.1, showing that albumin and other soluble, surface-active proteins were quite effective at stabilizing a gold sol against coagulation [170]. However, quantifying and predicting the stabilizing effects of albumin and the de-stabilizing effects of electrolytes on colloids required another 80 years of research.
The first step toward understanding the mechanisms behind colloid stability was the derivation by Smoluchowski (1917) of diffusion-limited coagulation [174], which Fuchs (1934) extended to show that the coagulation rate slowed in the presence of an repulsive inter-particle potential, Φ [175]. The flux/area, −J = dΓ/dt, (Γ is the interfacial concentration in molecules/unit area) to an interface located at x=0, is proportional to a friction factor, DSE/kBT, which is in turn proportional to the diffusivity of the colloidal particles, DSE, (here the lung surfactant aggregates, Figs. 4, 6). The driving force, in general, is the product of the local bilayer aggregate concentration, C, and the gradient in chemical potential ∇μ:
| (3) |
The normal chemical potential is altered by the inter-particle potential, Φ(x):
| (4) |
Combining Eqns. 3, 4 leads to a generalized diffusion equation:
| (5) |
The first term on the right side of Eqn. 5 is the normal diffusive flux, which is usually called Fick’s First Law of Diffusion [176]. The second term in Eqn. 5 is the retarding effect of the potential gradient between the particles. At steady state, the flux/area, J, in Eqn. 5 is constant, and Eqn. 5 can be simplified by multiplying both sides by exp(Φ/kBT):
| (6) |
and integrated as follows:
| (7) |
The limits of integration are such that the LS aggregate concentration is zero anytime a surfactant aggregate gets to the interface at x=0, (the surfactant aggregate converts to monolayer form, making C=0 at x =0), and the concentration reaches the bulk surfactant solution concentration, C = CB, and the potential, Φ → 0, as x → ∞. This gives:
| (8) |
The right hand side of Eqn. 8 is approximated by noting that the integral is dominated by the value of Φ at its maximum, Φmax, and the potential can be expanded in a Taylor series about the maximum [177]:
| (9) |
dΦmax/dx = 0 at Φmax. Combining Eqns. 8 and 9 gives:
| (10) |
In Eqn. 10, the integrand is simply that of a Gaussian and gives:
| (11) |
p is a constant that reflects the curvature at the potential maximum. Rearranging Eqn. 11,
| (12) |
Deff is an effective diffusion coefficient. Eqn. 12 shows that the flux to the interface is slowed exponentially by an energy barrier of height Φmax/kBT. For Φmax/kBT ~ 5, the flux is reduced by 150 times; for Φmax/kBT ~ 10, the flux to the interface is reduced by a factor of 20,000! In Fig. 2, the time it takes for Curosurf to increase the surface pressure to > 20 mN/m increases from about 2 second for a clean interface to more than 250 seconds for a serum covered interface for the same bulk concentration of Curosurf, consistent with Eqn. 12 and Φmax/kBT ~ 5. Doubling the bulk surfactant concentration does not have nearly the effect of reducing the potential barrier by 50%. This is likely why simply increasing the surfactant concentration does not lead to a significant improvement in surfactant adsorption in the presence of albumin or other charged, surface-active inhibitors. To stabilize colloidal particles indefinitely (from coagulation in 10 seconds to more that one year) against equilibrium aggregation, the energy barrier height need only be ~ 15 kBT [170]. For the relatively fast cycles of expansion and compression under normal breathing (of order seconds), the energy barrier does not have to be very high to effectively inhibit surfactant adsorption.
From Eqn. 12, the ratio of the diffusion-limited (Φ=0) flux, Jo, to the actual flux, J, at a fixed bulk concentration is proportional to the exponential of the potential maximum, Φmax [177]:
| (13) |
To enhance surfactant adsorption in the presence of proteins, it is essential to know how to manipulate Φ. At the time Eqn. 8 was originally derived, neither the origin of the attraction between colloid particles (and LS aggregates), nor the functional form of the repulsion or attraction were known. In the 1940’s, Derjaguin, Landau, [168] Verwey, and Overbeek [169] (DLVO) combined the van der Waals/London dispersion attraction [178] with double-layer electrostatic repulsion [136] to give the functional form of Φ between two spheres of radius, a, at a separation, r, surface potential, ψs, and ion concentration, ni, via the Debye length, κ−1:
| (14) |
AH is the Hamaker constant that determines the magnitude of the attractive van der Waals/London dispersion forces [178]. The magnitude and range of the DLVO potential can be most easily be changed by changing the ionic strength of the solution, which decreases both κ−1 and Φmax (and to a lesser extent, AH [128]). Both Faraday and Zgismondy de-stabilized their gold sols by adding NaCl [170, 171]. If the negatively charged albumin and serum proteins act to induce a DLVO-type energy barrier to LS adsorption, just as albumin adsorbed to gold colloids inhibits coagulation, we expect that adding NaCl should promote LS adsorption.
Figure 12a shows the effect of varying the NaCl concentration on the adsorption of 800 μg of Survanta on a buffered subphase (0.2 mM NaHCO3, pH ~ 7) with no albumin present. The respective Debye lengths are ~ 21 nm for the subphase with no added salt (mainly due to the buffer), .78 nm for the 150 mM NaCl and .3 nm for 1000 mM salt at 25° C. The minimum surface pressure after adsorption, but before compression, more than doubled from 14 mN/m for no salt, to 29 mN/m for 1000 mM NaCl. On the first compression, a characteristic shoulder at ~ 45 mN/m and collapse plateau at ~ 65 mN/m are visible for all three salt concentrations. On expansion, the minimum surface pressure drops to ~ 0 mN/m on the subphase with no NaCl, but is ~ 15 mN/m on the 1000 mM NaCl subphase. The length of the characteristic shoulder and collapse plateaus are roughly the same for the 150 and 1000 mN NaCl subphases on the first and second compressions; for the subphase with no NaCl, the shoulder and the collapse plateau are much reduced. These isotherms show that higher NaCl concentrations in the subphase promotes Survanta adsorption and respreading, even to a clean interface [179]. This should not be surprising since both the surfactant aggregates and monolayer contain a significant fraction of anionic lipids, which should lead to a DLVO repulsion even between the surfactant aggregates and the surfactant film, which is decreased by higher electrolyte concentrations.
Figure 12.
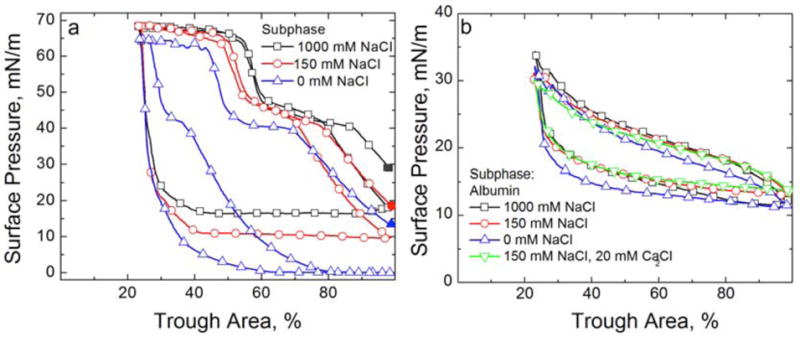
Cyclic isotherms of Survanta and albumin on a buffered subphase (0.2 mM NaHCO3 and pH=7) containing varying NaCl and CaCl2 concentrations. (a) 800 μg Survanta deposited onto a subphase containing varying NaCl concentrations. For all plots, the solid symbol denotes the surface pressure after adsorption before beginning the first compression cycle. The first compression, first expansion and second compression are shown for all three isotherms. □ 1000 mM NaCl subphase; ○ 150 mM NaCl subphase; △ 0 mM NaCl subphase. Increasing NaCl concentration increases the equilibrium surface pressure, the minimum surface pressure on expansion and promotes re-adsorption of collapsed material. (b) Fourth cycle isotherms of 2 mg/mL albumin on a buffered subphase (0.2 mM NaHCO3 and pH=7) containing varying concentrations of electrolytes. No Survanta has been deposited. □ 1000 mM NaCl subphase; ○ 150 mM NaCl subphase; △ 0 mM NaCl subphase; ▽ 150 mM NaCl, 20 mM CaCl2 subphase. The albumin isotherm is independent of the subphase electrolyte concentration indicating that the albumin adsorption and surface activity are unchanged over the range studied.
On the other hand, Fig. 12b shows that increasing the electrolyte concentration has little effect on the cyclic isotherms of 2 mg/ml albumin with no LS present. All the curves reach a maximum surface pressure of ~ 33 mN/m on compression and a minimum surface pressure of ~ 11 mN/m on expansion. Hence, the electrolyte does not lead to precipitation of the albumin or significant changes in the albumin adsorbed to the interface.
Fig. 13 shows the dramatic effects on adsorption as the NaCl concentration is increased when 800 μg of Survanta was deposited on a buffered subphase containing 2 mg/ml albumin. For NaCl concentrations up to 333 mM, the compression isotherms were indistinguishable and showed virtually no Survanta adsorption; they were identical to the albumin-only compression isotherms in Fig 12b. However, increasing the NaCl to 450 mM restored the characteristic shoulder and collapse plateau (Fig. 12a) typical of Survanta adsorbing to an albumin-free interface, although it required a greater compression (smaller trough area) to reach these plateaus. This is characteristic of slower than diffusion-limited adsorption. Further increases in NaCl concentration translate the compression isotherms to greater trough areas, implying greater adsorption; for 1000 mM NaCl, the compression isotherm with albumin in the subphase occurs at an even greater trough area at a given surface pressure than for Survanta adsorption on an albumin-free, 150 mM NaCl subphase. As the relationship between surface pressure and area/molecule is fixed for Survanta (See X-ray results in Table 1), this increase in trough area at a given surface pressure shows that more Survanta is adsorbing to the interface as the electrolyte concentration is increased. The added NaCl decreases κ−1, which causes a decrease in Φmax and an increase in the diffusive flux of surfactant to the interface, consistent with Eqns. 12–14.
Figure 13.

Fourth cycle compression isotherms of 800 μg Survanta on a buffered subphase (0.2 mM NaHCO3 and pH=7) containing varying NaCl concentrations and/or albumin (2 mg/mL when present). □ Survanta on a 150 mM NaCl subphase; ○ Survanta-albumin on a 150 mM NaCl subphase; △ Survanta-albumin on a 333 mM NaCl subphase; ▽ Survanta-albumin on a 450 mM NaCl subphase; ◇ Survanta-albumin on a 600 mM NaCl subphase; ⬠ Survanta-albumin on a 1000 mM NaCl subphase. A subphase containing 1000 mM NaCl is necessary to completely reverse the albumin inhibition and restore surfactant adsorption.
While the qualitative enhancement of adsorption is obvious from Fig. 13, it is difficult to directly calculate the theoretical enhancement of adsorption due to changes in electrolyte concentration from Eqn. 12–14 as many of the parameters (ψs, AH, a) are unknown. However, it is much easier to show how adsorption should scale with the valence of the ions in solution. One of the surprising early experimental discoveries in colloid science (1880–1900) was that the critical electrolyte concentration required to flocculate (CFC) a variety of positive and negative colloids was essentially independent of the chemical or physical details of the colloid and the electrolyte, but decreased as z−6, in which z is the valence of the ion opposite in charge to the colloid, which is known as the Schulze-Hardy rule [136, 180, 181]. Starting with the DLVO potential, Eqn. 14, rapid, diffusion-limited coagulation or flocculation should occur at an electrolyte concentration (called the critical flocculation concentration or CFC) at which Φmax = dΦ/dr = 0, that occurs when the separation between spheres, r =κ−1:
| (15) |
For ezψs/4kBT > 1, in the limit of large surface potentials, ψs, and the CFC ∝z−6, which successfully explained the Schulze-Hardy rule [136], and was one of the first important validations of the DLVO theory.
Fig. 14 shows that significantly lower levels of CaCl2 restore surfactant adsorption in the presence of albumin. For each NaCl concentration, the Schulze-Hardy rule (CFC proportional to z−6) was used to compare the isotherm with a functionally equivalent amount of CaCl2 in the subphase. To make the comparisons physiologically relevant, 150 mM NaCl was taken as a baseline electrolyte concentration (e.g. for 1000 mM total NaCl, the equivalent CaCl2 concentration for 850 mM NaCl is 2−6 * 850 = 13.3 mM). The CaCl2 concentrations relative to the NaCl concentrations (above 150 mM) to restore surfactant adsorption are in the ratio 2−(6.4±0.1), in excellent agreement with the scaling relationship predicted by DLVO theory. In analogy to the CFC, the ratio of divalent (calcium) to monovalent (sodium) ion concentration needed to induce diffusion limited surfactant adsorption is proportional to 2−6, which is, as far as we are aware, the first demonstration of the Schulze-Hardy rule for competitive adsorption. In designing surfactant replacement formulations, it would be impractical to use 1 M saline in a treatment due to its osmotic effects on lung tissue; however, 15 – 20 mM CaCl2 added to physiological saline has minimal effects on the fluid balance in a rat lung (H. W. Tauesch, unpublished observations). Biocompatible trivalent ions should be even more effective in enhancing surfactant adsorption and should be identified and tested.
Figure 14.

The fourth cycle compression isotherms of 800 μg lipid dispersion on a buffered saline subphase (0.2 mM NaHCO3 and pH=7) containing 2 mg/mL albumin and varying electrolyte concentrations. □ 150 mM NaCl subphase; ○ 333 mM NaCl subphase; △ 450 mM NaCl subphase; ▽ 600 mM NaCl subphase; ◇ 1000 mM NaCl; ■ 0 mM CaCl2, 150 mM NaCl subphase; ● 2 mM CaCl2, 150 mM NaCl subphase; ▲ 3.5 mM CaCl2, 150 mM NaCl subphase; ▼; 5 mM CaCl2, ◆ 150 mM NaCl subphase; 10 mM CaCl2, 150 mM NaCl subphase. For each NaCl concentration, the theoretical CaCl2 concentration according to the Schulze-Hardy/DLVO scaling (Eqn. 13) is given. The agreement between theory and experiment is excellent. Figure adapted from [79].
Polymers – Two Distinct Mechanisms of Destabilizing Colloids and Enhancing Adsorption
To continue the analogy between colloid stability and surfactant adsorption, other additives traditionally used to flocculate colloids [90, 136, 182–187] should also lead to enhanced surfactant adsorption in the presence of albumin or serum proteins. The first suggestion of the analogy between colloid stability and surfactant adsorption came from observations that adding non-ionic hydrophilic polymers such as polyethylene glycol (PEG) or dextran [9, 38, 41, 85, 95, 188–191] to clinical lung surfactants improved lung function in animals with lung injuries. This improved lung function correlated with enhanced surfactant adsorption to an albumin-covered air-water interface in vitro, as well as the flocculation of the LS aggregates in suspension [13, 42, 82–84, 95, 97, 192].
Polymer Depletion Forces
The unifying features of the polymers that reverse inhibition by this mechanism are: (1) they do not specifically adsorb to surfactant aggregates; (2) the polymers show no surface activity by themselves; (3) the polymers are small compared to surfactant aggregates (nm vs microns); (4) inactivation reversal occurs for all surfactant and polymer mixtures tried thus far. This suggests that a generic interaction, the so-called “depletion interaction” (Fig. 15), leads to inhibition reversal, rather than a specific interaction between particular surfactants and polymers.
Figure 15.

Origin of depletion forces in a binary sphere mixture. (Top) The centers of the small spheres are excluded from the hatched regions within one small sphere radius (Rg) of the larger spheres (radius R) or the interface. (Bottom) When the larger spheres move to the interface or toward each other, the hatched regions overlap, and the total volume accessible to the small spheres increases by this amount times the number of large spheres (total increase in volume in the bottom right-hand corner). The increase in the volume accessible to the polymer increases the entropy of the system, resulting in a net “depletion” force pushing the large spheres toward the interface or each other. Figure adapted from [42].
A mixture of two different sizes of non-interacting “hard spheres” maximizes its entropy by maximizing the volume accessible per “sphere” [193–200]. Here, the small spheres are the polymers with radius of gyration, Rg (typically nm), and the large spheres are surfactant aggregates of radius a (typically microns, See Fig. 4, 6). The small spheres can approach the large spheres or the interface no closer than Rg (hatched regions in Fig. 15), which prevents this “excluded volume” from being explored by the polymers. As a large sphere moves toward another large sphere or the interface, the volume excluded from the centers of the small spheres (hatched regions in Fig. 15) overlap, which causes the volume accessible to the small spheres to increase (small volume at the bottom right of Fig. 15) [193–198]. This increases the entropy of the mixture (decreases the free energy) by an amount proportional to the size of the excluded volume overlap region, multiplied by the osmotic pressure of the small spheres. This decrease in the free energy translates into an attractive force between the large spheres and between the large spheres and the interface.
A more intuitive way of understanding how the attractive force between aggregates arises is by considering the osmotic pressure of the polymer solution. Each large sphere immersed in a polymer solution experiences an osmotic pressure acting normal to its surface. For an isolated particle, this pressure is distributed homogeneously over the entire surface, so the net force in any direction is averaged out to zero. However, when two large spheres approach each other closer than the effective size of the polymer, 2Rg, the polymer can no longer fit into the gap between the large spheres or between a large sphere and the interface; the polymer will be excluded from a portion of the volume of the gap. Hence, in the gap between the large spheres, or between the large sphere and the interface, the polymer concentration is reduced, resulting in a lower osmotic pressure in the gap (for an ideal solution, the polymer osmotic pressure is φpkBT, in which φp is the volume fraction of polymer). Consequently, the pressure on the large sphere due to the polymer osmotic pressure becomes unbalanced, leading to a force that pushes the large spheres toward each other, or toward the interface: the depletion attraction.
Moving a single surfactant aggregate of radius a into contact with the interface decreases the mixture’s free energy by 3aφpkBT/Rg [194–196, 198], which is twice that of the decrease in free energy when two aggregates come together 3aφpkBT/2Rg, simply due to the different excluded volumes. If the interface (or the aggregates) deforms, an even larger excluded volume overlap region results, with a larger force pushing the large sphere towards the interface [195, 196, 198]. The depletion potential energy, W(r), as a function of separation, r, between the large sphere and the interface [198] is simply a product of the volume of the overlap region and the osmotic pressure as a function of separation,:
| (16) |
for r< 2Rg, and W(r) = 0 for r > 2Rg. The depletion potential is independent of the chemistry of the large and small spheres, as long as the polymer does not adsorb to surfactant or interface.
The depletion potential (Eqn. 16) is generally assumed to be additive with the DLVO potential (Eqn. 14) when considering the simultaneous effects of polymers and electrolytes on colloid stability [197] or surfactant adsorption in the presence of albumin [79]:
| (17) |
for r < 2Rg. The depletion potential is always negative (attractive) so depletion attraction will always help enhance colloid flocculation or surfactant adsorption by decreasing Φmax in Eqn. 13. The magnitude of the change depends on the Debye length, the surfactant aggregate size, the polymer molecular weight and the polymer volume fraction. Albumin and the other serum proteins are of order 4–10 nm in diameter, while the surfactant aggregates are of order microns; hence the depletion attraction is significantly greater for the surfactant aggregates. The depletion attraction is purely entropic, and is independent of the chemical composition of the surfactant, protein and polymer as long as the polymer does not adsorb to the surfactant or the interface, which explains why PEG, dextran, and hyaluronic acid are all effective at enhancing Survanta, Curosurf and Infasurf adsorption [13, 201].
Fig. 16 shows that the depletion forces between surfactant aggregates can push the aggregates together against the inter-aggregate repulsive forces and thermal motion that stabilizes the aggregates in suspension. Large flocs are formed that can be readily re-dispersed by stirring or shaking the sample vials, due to the short range of the depletion attraction. The depletion attraction between two spherical surfaces is only half that between the sphere and the interface (Eqn. 16) because of the smaller excluded volume overlap [194]. However, Fig. 16 shows that even this smaller depletion attraction induced by 5 wt% 10 kDa PEG is sufficient to flocculate Infasurf, Curosurf and Survanta and overcome any electrostatic repulsion between the anionic surfactant particles. Aggregation of surfactant particles after PEG addition was also observed by Yu et al. [95] and was ascribed to depletion attraction. Lu et al. [201] showed that Infasurf particles were flocculated by PEG, hyaluronic acid (HA) and dextran, consistent with the depletion attraction mechanism, although Survanta, while flocculated by PEG and dextran, was not flocculated significantly by HA. HA, unlike PEG and dextran, is charged at physiological pH and may interact differently with different surfactant aggregates, perhaps by binding to the positively charged SP-B and SP-C proteins. Polyelectrolytes such as HA in solution have quite different shapes and sizes, which scale much differently with molecular weight than the uncharged PEG and dextran, so the simple theory of mixtures of hard spheres might not be appropriate for HA. Infasurf and Curosurf aggregates are likely much more deformable (See Fig. 4) than Survanta, which would increase the depletion attraction, resulting in more flocculation and stronger flocs. A secondary benefit of these large flocs of surfactant is that they carry a substantially larger volume of material to the interface, while they diffuse more slowly.
Figure 16.
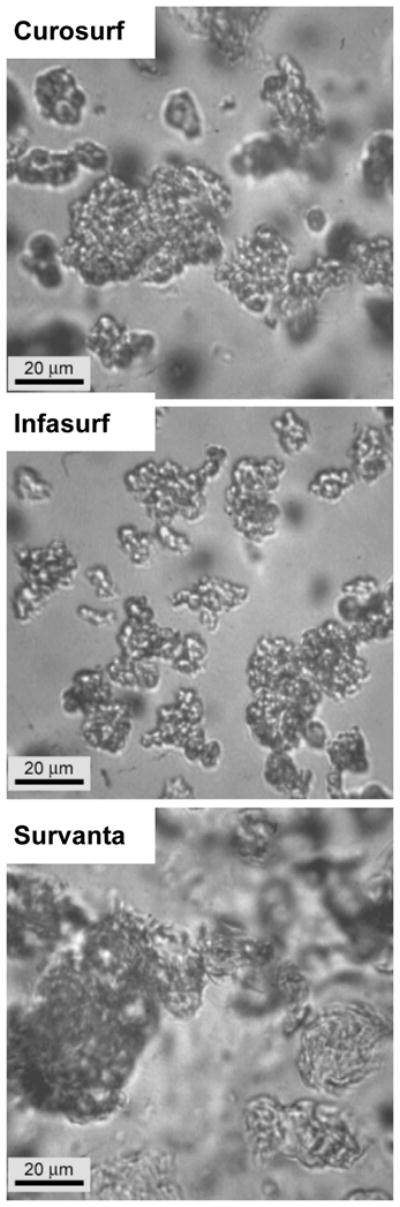
Surfactant particles flocculate on addition of 5 wt% 10 kDa PEG in addition to increased adsorption to the interface. Curosurf, Infasurf and Survanta form large, 20 – 100 micron size loose flocs due to the depletion attraction (compare to Fig. 6) [42]. The flocs can be redispersed by stirring or shaking, indicative of the weak, short-ranged depletion attraction holding them together. Hyaluronic acid and dextran also flocculate surfactant aggregates [201], consistent with a depletion attraction overcoming the electrostatic repulsion due to the anionic lipids present in most lung surfactants. The depletion attraction between surfactant particles is only half that between the particles and the interface, so proportionally more polymer is required to flocculate the particles than necessary to enhance adsorption to the interface [194]. Figure adapted from[42].
Optimizing Polymer Volume Fraction and Polymer Molecular Weight
The effects of the depletion attraction are best seen by the scaling of surfactant adsorption with the volume fraction of polymer at a constant surfactant and electrolyte concentration [83]. Eqns. 13 and 17 predict an exponential dependence of surfactant adsorption on polymer concentration (for a fixed electrolyte concentration), and only a linear dependence on surfactant concentration. Fig. 17a shows the surface pressure as a function of trough area for increasing amounts of Survanta deposited on a clean saline subphase. The characteristic shape of the isotherms in Fig. 17a are translated unchanged (note the shape of the collapse plateau and the shoulder at ~ 40 mN/m) from low to high trough area for a given surface pressure as the amount of Survanta added to the trough is increased from 8 μg up to 800 μg [138]. This means that the total amount of surfactant at the interface has increased, as the relationship between surface pressure and area/molecule is fixed for a given surfactant composition and temperature (See Table 1) [97]. Hence, increasing surfactant adsorption to the interface is reflected in the isotherms as a translation from low to high trough area at a given surface pressure. Eventually, the interface is saturated (note the small offset between 300 μg to 800 μg) and further increases in surfactant concentration have little effect.
Figure 17. Fourth compression cycle isotherms of increasing concentrations of Survanta on a clean buffer subphase (a) and 800 μg Survanta on subphases containing 2 mg/ml albumin with increasing PEG concentrations (b).

(a) △ 8 μg Survanta; ⬠ 30 μg Survanta; ◇ 80 μg Survanta; ○ 300 μg Survanta; □ 800 μg Survanta; At a given surface pressure, the isotherms are translated essentially unchanged from low trough area to high trough area with increasing Survanta concentration (note the characteristic shoulder at ~ 40 mN/m and the collapse plateau at ~ 65 mN/m). This shows that Survanta adsorption increases with increasing concentration as predicted by Eqn. 12. The interface becomes saturated for concentrations greater than about 300 μg; the 800 μg isotherm is not displaced significantly to higher trough areas.
(b) □ Survanta on saline buffer subphase with no albumin; ○ Survanta-albumin; ◇ Survanta-albumin-0.25 wt. % PEG; ⬠ Survanta-albumin-0.50 wt. % PEG; △ Survanta-albumin-1.2 wt. % PEG. The red curve shows the surface pressure for the albumin subphase with no Survanta or PEG. Comparing to (a) shows that albumin in the subphase produces the same effect as decreasing the Survanta concentration from 800 μg to about 8 μg. Adding increasing amounts of PEG to the subphase shifts the isotherms to higher trough areas, the same effect as increasing the Survanta concentration in (a). The shaded area denotes the trough area over which the surface pressure was averaged for each PEG concentration to obtain the relative surfactant adsorption plotted in Fig. 18. Figure adapted from [83].
Fig. 17b shows the effect of albumin on the isotherms is equivalent to decreasing the Survanta concentration (see Fig. 17a). The red line in Fig. 17b shows the compression isotherm of 2 mg/ml albumin with no Survanta or PEG, which differs little from that of 800 mg Survanta on the albumin subphase, which means that the effective surfactant adsorption is reduced by a factor of 100 by the albumin-induced Φmax. A > 100-fold reduction in adsorption at fixed bulk concentration, CB, corresponds to a repulsive Φmax of approximately +5 kBT for the albumin – surfactant potential, similar to the energy barrier estimated between Curosurf and serum proteins from Fig. 2.
Increasing the concentration of 10 kDa PEG in the subphase (Fig. 16b), like increasing the electrolyte concentration (Fig. 13, 14), increases the adsorption of surfactant to the interface. As in Fig. 17a, the shapes of the isotherms are unchanged, just shifted to larger trough areas with increasing polymer concentration, confirming that the albumin and polymer do not affect the surfactant monolayer properties at the interface, just the total surfactant adsorption. This is consistent with the polymer inducing a depletion attraction between the interface and the surfactant aggregates and reducing Φmax.
To quantify the effect of polymer concentration on surfactant adsorption, Fig. 18 shows an estimate of the relative rate of surfactant adsorption as a function of PEG concentration. The fluorescence images (Fig. 7c) and X-ray data (Figs. 8–11) show that very little surfactant adsorbs to an albumin-covered interface on a subphase with 150 mM salt. Hence, we approximate the relative adsorption, RA, as the difference between the sample surface pressure (Π) and the surface pressure of the albumin (Πalb ~ 23 mN/m) only isotherm (red curve in Fig. 17b), divided by the difference between the surface pressure for the saturated isotherm (> 1% PEG in Fig. 17b, Πsat ~ 66 mN/m) and . All surface pressures were evaluated by averaging over the same trough area (Ao) denoted by the shaded area in Figure 17b. This region showed the maximum variation in adsorption.
Figure 18.

The relative adsorption (RA) is the difference between the sample surface pressure (Π) and the surface pressure of the albumin only isotherm (ΠAlb, red curve in Fig. 3b), divided by the difference between the surface pressure for the saturated isotherm (> 1% PEG in Fig. 17b) and ΠAlb, . All surface pressures were evaluated by averaging over the same trough area denoted by the shaded area in Figure 17b. The solid line is a fit to the data showing the exponential dependence of RA on the polymer concentration as predicted by Eqns. 15–16, consistent with the depletion attraction lowering the DLVO energy barrier to surfactant adsorption. Figure adapted from [83].
Fig. 18 shows that the relative adsorption increases by about a factor of 50 as the PEG concentration is increased from 0 to 0.8 wt%. Higher concentrations of PEG lead to minimal increases in adsorption, as the interface becomes saturated with surfactant. From Fig. 14, without the polymer, 1000 mM NaCl is required to restore surfactant adsorption; hence, 0.8 wt% 10 kDa PEG provides as much decrease in Φmax as an additional 850 mM of NaCl. From Eqns. 13 and 17, the relative adsorption with albumin and PEG in the subphase compared to a clean interface should be an exponential function of PEG weight fraction, CPEG:
| (18) |
in which β, β′ and α are (unknown) constants for a given Survanta and albumin concentration. While there is some scatter in the data, the relative adsorption does depend exponentially on the PEG concentration consistent with Eqn. 18. This shows the proper scaling for the depletion potential and that adding PEG lowers the energy barrier to adsorption.
However, Fig. 19 shows that 1 wt% 10 kDa PEG did not lead to any increase in the adsorption of surfactant in the presence of albumin for a subphase with no added salt. This is because the maximum in the DLVO potential (Eqn. 17) occurs when the separation between the charged surfaces, r, is of order κ−1. For the subphase with no added NaCl, the 0.2 mM NaHCO3 buffer gives a κ−1 of ~ 20 nm. The maximum range of the depletion attraction, 2Rg, however, is only ~ 10 nm for 10 kDa PEG [42, 83, 84, 202]. Hence the range of the depletion attraction is not sufficient, regardless of the polymer concentration, to affect Φmax, and PEG has no effect on adsorption (Fig. 19), as observed. For 150 mM salt, κ−1 ~ 1 nm, 2Rg ≫ κ−1 and the range and magnitude of the depletion attraction is sufficient to lower Φmax enough to restore diffusion-limited adsorption [83, 84].
Figure 19.

Fourth cycle compression isotherms of 800 μg lipid dispersion on a buffered subphase (0.2 mM NaHCO3 and pH=7) containing 2 mg/mL albumin, 10 mg/mL 10 kDa PEG and varying NaCl concentrations. Filled symbols denote subphases containing albumin and NaCl while open symbols denote subphases containing albumin, NaCl and PEG. ■ 0 mM NaCl-albumin subphase; □ 0 mM NaCl- albumin-PEG subphase; ● 150 mM NaCl-albumin-subphase; ○ 150 mM NaCl-albumin-PEG subphase. Adding PEG restores the characteristic shoulder and collapse plateau of the Survanta with 150 mM NaCl in the subphase, but the same amount of PEG added to a 0 mM NaCl subphase does not alter the albumin-like isotherm. The range of the depletion attraction induced by PEG is twice the radius of gyration of the polymer, about 9 nm for 10 kDa PEG, which is less than the Debye length of 13 nm for the 0 mM NaCl subphase. For 150 mM NaCl, the Debye length is 1 nm, so the PEG induced depletion attraction has sufficient range to lower the repulsive potential. Figure adapted from [79].
These results show that there is a minimum Rg (Eqn. 16) necessary to induce the depletion attraction, and hence a minimum molecular weight necessary to generate a depletion attraction [193–196, 198]. If the molecular weight, and hence the diameter of the polymer, is too small, the range of the depletion attraction may not overlap the range of the repulsive interactions. For molecular weights above this minimum, Eqn. 16 can help predict the optimal concentration for a given molecular weight. The osmotic pressure of the polymer-surfactant solution, which should be minimized to prevent infiltration of liquid into the lung, is proportional to Np/V; so high molecular weight polymers should have a distinct advantage in treatments of ARDS and other lung injuries. Saline is a good solvent for PEG and other hydrophilic polymers and several authors have shown that Rg ∝ MW0.55, in which MW is the polymer molecular weight [202, 203]. The range of the depletion attraction is proportional to Rg and hence should increase as MW0.55. From Eqn. 16, in which Np is the number of polymer molecules in a volume V. For a fixed polymer weight fraction of ρ, , hence the depletion potential for PEG should scale only weakly with molecular weight as Wmax ∝ φp ∝ MW0.1, below the polymer entanglement concentration (which also depends on molecular weight).
Fig. 20 shows three distinct responses as a function of PEG molecular weight for Survanta adsorption to an albumin covered interface on a subphase containing physiological saline. Region I (1kDa < PEG MW < 5 kDa) corresponds to minimal reversal of surfactant adsorption inhibition, Region II (5kDa < PEG MW < 65 kDa) corresponds to complete reversal of adsorption inhibition and Region III (PEG MW > 65 kDa) corresponds to partial reversal of adsorption inhibition. In Region I, for the lowest molecular weight PEG’s, the range of the depletion attraction is small compared to the range of the repulsive interactions as in Fig. 19; Φmax in Eqn. 13 is not decreased and the polymer has little effect on surfactant adsorption. Some combination of the albumin film thickness and the Debye length likely defines the location of the maximum in the repulsive potential, and hence the minimum-range of a depletion attraction necessary to enhance surfactant adsorption. The range of the depletion attraction induced by 1.45 kDa PEG (2Rg ~ 3.0 nm), for example, is less than the axial dimension of the albumin molecule, so we expect minimal effects on surfactant adsorption as was observed (Fig. 20). The range of the 3.35 kDa PEG depletion attraction (2Rg ~ 4.8 nm) is about the same as the albumin dimensions, but the depletion potential at this separation (Eqn. 16) is still apparently much smaller than the ~5 kBT repulsive energy barrier estimated earlier [83], so there is only a small effect on adsorption.
Figure 20.

Relative adsorption (RA, See Fig. 18) of 800 μg Survanta on subphases containing 2 mg/mL albumin at varying PEG molecular weights and concentrations. ○ 1% wt. PEG; □ 0.5% wt. PEG; △ 0% wt. PEG which has been plotted for comparison purposes. Region I (PEG 1.45 – 3.35 kDa) corresponds to minimal reversal of surfactant adsorption inhibition, Region II (PEG 6 – 35 kDa) corresponds to complete reversal of adsorption inhibition and Region III (PEG 100 – 200 kDa) corresponds to partial reversal of adsorption inhibition. The dashed line, where RA depends on the MW0.1, is a good fit to the PEG 1% wt. data in Region II, consistent with the depletion attraction lowering the energy barrier to surfactant adsorption. Figure adapted from [84].
For the intermediate molecular weight range in Region II, the depletion interaction is sufficiently long-ranged that it overlaps the repulsive interactions and leads to enhanced surfactant adsorption. From Eqn 18, since Wmax ∝φp ∝ MW0.1, ln(RA) should also be proportional to MW0.1. In Fig. 20, for 1 wt % PEG over the molecular weight range of 6–35 kDa (Region II), the dashed line in Fig. 20, ln (RA) ∝ MW0.1, fits the data quite well. Though there is more scatter in the data, the scaling law also holds reasonably well for 0.5 wt% PEG over this range of molecular weights.
However, the scaling does not continue for higher molecular weights; in fact, surfactant adsorption decreases for the higher molecular weight PEG at both 0.5 and 1.0% wt. indicating a smaller depletion attraction (Region III). For these PEG molecular weights, the ratio of polymer solution viscosity to the solvent (saline) viscosity, η/ηsol, at both 0.5 and 1 wt% polymer exceeds the overlap criterion, η/ηsol > 2. As the polymer solution exceeds the overlap concentration and crosses into the semi-dilute regime, the polymer is no longer isolated random coils with characteristic length scale Rg but is instead an entangled polymer mesh with characteristic length scale ξ. Above overlap, the simple hard sphere model (Eqn. 16) [193] for the depletion attraction must be modified [204–206]. For a dilute colloidal system with a large aspect ratio between the colloid (a ~ 500 nm) and polymer (Rg ~ 20 nm), the modified theory predicts that the magnitude of the depletion attraction plateaus at roughly the polymer overlap concentration. 200 kDa PEG reaches its overlap at significantly lower concentrations (~0.5% wt.) than 10 kDa PEG (~4.0% wt.), which explains why the PEG 200 kDa depletion attraction is lower in magnitude and yields lower RA values for PEG molecular weights in Region III. The plateau of the depletion attraction at roughly the overlap concentration gives an upper limit for the effectiveness of a polymer of a given molecular weight; any additional polymer above the overlap concentration no longer increases surfactant adsorption. However, further increasing the polymer concentration greatly increases the solution viscosity; as Deff in Eqn. 12 is inversely proportional to the solution viscosity, polymer concentrations exceeding the overlap concentration will cause the depletion attraction and the surfactant diffusivity to decrease, leading to a decrease in the net rate of adsorption.
Yu et. al. also showed that increasing PEG molecular weight (from 3.35 –35 kDa) enhanced the rate of bovine lipid extract surfactant absorption to a clean interface [95], while higher molecular weight PEG (300 kDa) did not enhance adsorption. Surface force apparatus (SFA) measurements between mica-supported lipid bilayers in 10% wt. 1 kDa PEG yielded a force-distance profile similar to pure water, indicating at this low molecular weight, the PEG does not generate a depletion attraction [207, 208] Kuhl et. al. also showed a concentration dependant increase in the adhesion force between lipid bilayers in the SFA for solutions containing 8 or 10 kDa PEG, which quantitatively agrees with that expected for a depletion attraction between the bilayers [207, 208].
Though the compression and expansion cycles on the Langmuir trough are slow (8 min/cycle) compared to physiological rates (3 sec/cycle), previous work performed on the pulsating bubble surfactometer shows that PEG, dextran and hyaluronic acid enhance surfactant adsorption at physiological rates [38, 41, 85, 87, 94, 95, 164, 189, 191, 192]. An additional factor to consider in future treatments is that the osmotic pressure of the polymer-surfactant solution must be minimized to prevent infiltration of liquid into the lungs during any potential ARDS treatment [209]. Hence, the lowest concentration of the highest molecular weight polymer that provides the necessary inhibition reversal should be used; the optimal PEG molecular weight for surfactant inhibition reversal is therefore likely to be around 35 kDa; which provides the greatest depletion attraction/surfactant adsorption with the smallest osmotic pressure [84, 191]. A caveat to this optimal molecular weight is that it depends on the concentration of the polymer; the use of higher polymer concentrations results in overlap and a corresponding plateau in enhanced surfactant adsorption. A further advantage of using 35 kDa PEG compared to smaller molecular weights is the increased range of the depletion attraction (2Rg). Other serum proteins such as fibrinogen have also been shown to competitively adsorb with lung surfactant lipids; fibrinogen is larger than albumin with dimensions of 5 × 5 × 46 nm [210]. While the exact orientation of fibrinogen at the air-liquid interface is unknown, the higher molecular weight PEG can likely generate a depletion attraction with sufficient range and magnitude to enhance surfactant adsorption.
While molecular weights of 6 – 35 kDa are optimal for PEG, other polymers may exhibit optimum molecular weights which are larger or smaller depending on composition, overlap concentration and charge. For example, hyaluronic acid (HA), a natural polysaccharide that is secreted by alveolar epithelial cells, of molecular weight 100–1240 kDa has been shown to reverse surfactant inhibition in vitro [13, 87, 94, 192] at much lower concentrations than PEG. HA is anionic, like albumin and LS, which can make for an even larger effective excluded volume (Fig. 15) [197]. The electrostatic repulsion between the LS aggregates and anionic polymer increases the effective radius of both the surfactant aggregates and the polymers by roughly the Debye length [197]. HA occurs in the lung epithelial fluid at concentrations of 4000 μg/L with a molecular weight of 220 kDa, in contrast to the 2000 kDa HA in cartilage and 7000 kDa HA in synovial fluid [211], suggesting an optimized HA molecular weight in the lung. During lung injury and disease, HA can be broken down by enzymatic action to produce smaller molecular weight fragments (1.6 kDa–10 kDa) [211]. However, similar to Region I of Fig. 20, these fragments may generate depletion forces that lack sufficient range to insure surfactant adsorption, especially in the presence of serum proteins.
GIXD and X-ray reflectivity confirm the basic assumption of the depletion attraction model at the molecular scale. Fig. 21 shows the Bragg peaks (Fig. 21a) and rods (Fig. 21b) from GIXD scans of 600 μg Survanta spread on a subphase with 2 mg/mL albumin and 5 wt% PEG. Prior to spreading the Survanta, the surface pressure was ~ 18 mN/m, indicating albumin had adsorbed to the interface. However, after spreading Survanta, the characteristic Survanta diffraction peaks were observed everywhere on the interface. At 20 mN/m, q10 = 1.48 Å−1 and q11 = 1.49 Å−1; the Bragg rods have a local maximum at qz = 0.09 Å−1. Compared to Survanta at 20 mN/m, the PEG in the subphase appears to condense the Survanta lattice somewhat and slightly reduce the tilt (Table 1). By 30 mN/m, the lattice has further condensed with q10 = 1.50 Å−1 and qz = 0 Å−1, indicating that the molecules are hexagonally packed and normal to the interface. At 40 mN/m, the main peak remains at qxy = 1.50 Å−1. The Bragg rods again show no local maximum above the horizon (qz = 0 Å−1) at 40 mN/m indicating that the molecules are normal to the interface.
Figure 21.

Bragg peaks and rods from GIXD of 600 μg Survanta spread onto a subphase containing 2 mg/mL albumin and 5% wt. PEG. (a) Bragg Peaks at 20–40 mN/m. The packing changes from distorted hexagonal to hexagonal at a lower surface pressure than Survanta on the control subphase. (b) Bragg rods at 20–40 mN/m. Zero tilt occurs at a lower surface pressure than Survanta on the control subphase. PEG in the subphase compacts the Survanta lattice and eliminates the molecular tilt at a lower surface pressure compared to control subphase. It may be that PEG induces a lateral “depletion attraction” within the film, as well as inducing the depletion attraction that forces Survanta to the interface. However, the overall phase progression, lattice spacings and tilt were little changed from Survanta on a saline subphase (Fig. 8), showing that the primary effect of adding PEG is to induce a depletion attraction that enhances surfactant adsorption. Figure adapted from [97].
Fig. 22 shows the electron density profiles for Survanta spread on a subphase containing both 2 mg/mL albumin and 5% wt. PEG. The albumin-PEG subphase has an electron density profile similar to albumin (Fig. 11), with a maximum electron density of ρ/ρsub = 1.18 at Z = 15 Å. However, the albumin-PEG subphase profile decreases more quickly than albumin and reaches a minimum value of 0.95, suggesting a PEG depletion layer. For Survanta on an albumin-PEG subphase at 20 mN/m, the electron density profile is qualitatively similar to albumin for Z< 50A, indicating that the interfacial film within the beam footprint is dominated by albumin. However, GIXD for the same film at 20 mN/m (Fig. 21) shows diffraction peaks, indicating that some ordered Survanta co-exists at the interface. The Survanta-albumin-PEG 20 mN/m electron density profile decreases less quickly than that for the albumin-PEG subphase; for Z > 50 A, it overlaps with the Survanta electron density profile. For Survanta-albumin-PEG at 30 mN/m and 40 mN/m, the electron density profiles are more similar to Survanta on the control subphase, indicating that at higher surface pressures, Survanta has displaced albumin from the interface. However, ρ/ρsub > 1 at larger Z, which may be due to albumin remaining near the interface. However, the PEG depletion layer might mask the magnitude of this effect. Overall, when PEG and albumin are in the subphase, XR and GIXD show that the Survanta displaces albumin from the subphase as the surface pressure increases and that PEG has a depletion layer at the interface, consistent with the depletion attraction model. Overall, there are minimal changes in the Survanta monolayer organization on the PEG and albumin containing subphases.
Figure 22.

The electron density profiles, normalized by the subphase electron density, determined by X-ray reflectivity for 600 μg Survanta spread on a subphase containing 2 mg/mL albumin and 5% wt. PEG. No Survanta was present for the albumin-PEG subphase data. The albumin-PEG subphase has an electron density profile similar to albumin (Fig. 11), with a maximum electron density of ρ/ρsub = 1.18 at Z = 15 Å. However, the albumin-PEG subphase profile decreases more quickly than albumin and reaches a minimum value of 0.95, suggesting a PEG depletion layer. At 20 mN/m, the electron density profile is similar to albumin, while for 30 and 40 mN/m; the electron density is similar to Survanta, indicating Survanta has displaced the albumin. The electron density profile of 200 μg Survanta on the control subphase at 40 mN/m is shown for comparison. The measured electron density is consistent with a PEG “depletion layer” at the interface, which validates one of the major requirements of the depletion attraction. Figure adapted from [97].
Cationic Polyelectrolytes
The third common method of flocculating charged colloids, which has a long history in wastewater treatment, mineral processing, ceramics manufacture and papermaking, relies on adding oppositely charged polyelectrolytes to the colloidal suspension [182–187]. Cationic polyelectrolytes are usually chosen as they are oppositely charged to the negatively charged surfaces common to natural systems. One of the more commonly used polycations is chitosan, a natural linear polysaccharide composed of randomly distributed β-(1–4)-linked D-glucosamine (deacylated unit) and N-acetyl-D-glucosamine (acylated unit). Chitosan is produced commercially by deacetylation of chitin, which is the structural element in the exoskeletons of crustaceans such as crabs and shrimp [182–184]. The amino group in chitosan has a pKa of ~ 6.5; thus, chitosan is positively charged and soluble in acidic to neutral solution. In analogy to its coagulating effects on anionic colloids [182–184], chitosan improves the adsorption of lung surfactant to the air-water interface in the presence of albumin.
In contrast to the ~10 mg/ml of 10 kDa PEG necessary to enhance adsorption by the depletion attraction, as little as 1 μg/ml of chitosan is able to provide the same level of enhancement [81, 96, 137] under otherwise identical conditions. These chitosan concentrations are much too low to induce a depletion attraction, which is proportional to the polymer volume fraction (See Figs 15–22). However, in the same way that divalent calcium requires significantly lower concentrations to enhance adsorption than monovalent sodium, increasing the valence to +100 for high molecular weight chitosan should lead to very low concentrations by the Schulze-Hardy rule (Eqn. 15). However, unlike calcium or PEG, increasing the chitosan concentration above optimal causes less surfactant to adsorb and a partial inactivation re-occurs. Only a narrow window of chitosan concentration completely reverses inhibition.
Many polyelectrolytes, including chitosan, flocculate oppositely charged colloids at low concentrations, then re-disperses and stabilizes the colloid at higher concentrations [182–187]. The mechanism of action for colloid aggregation and, by inference, surfactant adsorption is consistent with an initial charge neutralization of the colloid surfaces by the oppositely charged polymer [182–187], which causes an elimination of the double-layer electrostatic repulsion. However, higher polymer concentrations lead to over-compensation of the surface charge, which re-establishes the electrostatic energy barrier [182–187], leading to a decrease in surfactant adsorption. This physical mechanism is believed to be responsible or the flocculation and re-stabilization of anionic colloids by chitosan [182–184, 186] and in alternate layer deposition of anionic and cationic polyelectrolytes on charged colloids [185, 187].
Figs. 23a and 23b show the effect of varying chitosan concentrations on Survanta (800 μg) deposited onto a subphase containing 2 mg/mL albumin. A chitosan concentration of only 0.1 μg/mL (Fig. 23a, pentagons) reached a maximum surface pressure of 45 mN/m. Increasing the chitosan concentration to 0.5 μg/mL (Fig. 23a, up-triangles) restored the characteristic shoulder and collapse plateau at a lower trough area than Survanta on a clean interface (Fig. 23a, squares), indicating less total surfactant adsorption. For chitosan concentrations of 1 – 5 μg/mL (Fig. 23a, left-triangles, right-triangles), the characteristic shoulder and collapse plateau occur at similar trough areas as on an albumin-free interface, indicating an equivalent amount of total surfactant adsorption. In fact, more Survanta adsorbs for the optimal chitosan concentration of 1 μg/ml than on a clean interface – the isotherm is shifted to larger trough areas at all surface pressures. The minimum surface tension of the films also increases with increasing chitosan concentrations. Kang et al. [137] also observed higher minimum surface tensions and changes in cyclic isotherms at high chitosan concentrations, just as in Fig. 12 for higher salt concentrations. Note that the surface pressures of the characteristic shoulder and the collapse pressure of the Survanta does not change with chitosan concentration, once adsorption has been restored.
Figure 23.

Fourth cycle compression isotherms of 800 μg Survanta on a saline buffered subphase containing albumin (2 mg/mL when present) and the stated chitosan concentrations. (a) □ Survanta; ○ Survanta-albumin; ▷ Survanta-albumin with 0.005 mg/mL chitosan, ◁ Survanta-albumin with 0.001 mg/mL chitosan; △ Survanta-albumin with 0.0005 mg/mL chitosan; ⬠ Survanta-albumin with 0.0001 mg/mL chitosan. In this concentration regime, increasing chitosan concentration yields increasing surfactant adsorption. Charge neutralization of the Survanta and albumin is reached between 0.0005–0.005 mg/mL chitosan [80]. Note that for .001 mg/ml chitosan, more Survanta adsorbs (isotherm shifted to larger trough areas) than the control Survanta on a clean subphase. Figure adapted from [80].
(b) □ Survanta; ○ Survanta-albumin; △ Survanta-albumin-chitosan 0.5 mg/mL, ▽ Survanta-albumin-chitosan 0.1 mg/mL; ◁ Survanta-albumin-chitosan 0.01 mg/mL; ▷ Survanta-albumin-chitosan 0.005 mg/mL. For chitosan concentrations greater than that necessary for charge neutralization (Fig. 24), surfactant adsorption decreased. The shaded area denotes the trough area over which the surface pressure was averaged for each chitosan concentration to obtain the surfactant relative adsorption plotted in Fig. 24. Figure adapted from [80].
However, unlike increasing the salt concentrations (Fig. 12), increasing the chitosan concentration above this optimum value yields a gradual decrease in surfactant adsorption (Fig. 23b). Increasing chitosan concentrations shift the characteristic shoulder and collapse plateau to a lower trough area without altering the surface pressures at which they occur. While surfactant adsorption at 0.5 mg/mL (Fig. 23b, up triangles) is decreased from the optimum chitosan concentration (Fig. 23b, 5 μg/mL, right pointing triangles), the isotherm is still representative of an interface with Survanta compared to the isotherm of albumin alone.
Chitosan by itself is not surface active over the range of concentrations used [81]. Albumin reaches a maximum surface pressure of ~31 mN/m upon compression and a minimum surface pressure of ~13 mN/m upon expansion indicating that its adsorption and surface activity are unchanged by chitosan [80]. Saline buffer containing 0.0005–0.5 chitosan and 2 mg/mL albumin are optically clear, putting an upper limit on the aggregation in the bulk. Other reports show that chitosan does not significantly increase the turbidity of an albumin solution at the salt concentrations used in this work, confirming that chitosan does not cause large scale aggregation of the albumin in solution [212].
As is expected from the general effects of polyelectrolytes on charged colloids, cationic polyelectrolyte likely adsorbs to the to anionic surfactant aggregates, which causes a decrease in the net particle charge, with a resulting decrease in the particle surface potential, ψs, in Eqn. 14, thereby reducing Φmax. At a certain polycation concentration, the negative charge in the double-layer is neutralized; ψs and Φmax in Eqn. 14 go to zero, resulting in enhanced adsorption to the albumin-covered interface [187]. However, as is commonly observed in studies of chitosan and anionic colloids [182–184], further increases in the polyelectrolyte concentration cause the adsorption to continue beyond net neutrality. This can lead to a charge reversal of the surfactant aggregates, creating a positive surface charge, +ψs, and a new repulsive potential between the two, now positive colloidal surfaces, Φpos, leading to decreased surfactant adsorption to the interface [182–187].
The effects of chitosan on anionic colloids [182–184] parallel those of the cationic chitosan on the adsorption of the anionic lung surfactant in the presence of anionic albumin [81]: first an increase in adsorption at low chitosan concentrations, followed by a decrease in adsorption for higher chitosan concentrations (Fig. 23). Polyelectrolytes, in general, adsorb to surfaces of opposite charge because the entropy increase caused by the release of the polymer and surface counter-ions to the solution. The positively charged amide groups on the chitosan can form ion pairs with oppositely charged ions on the surfactant and albumin surfaces, until the net charge in the electrical double layer, ψs, is neutralized and the surface potential is reduced to zero (Eqn. 14). However, this net neutralization cannot explain charge reversal; it is necessary to consider the details of the charge distribution of the surfaces and the polymers.
In comparison to a solution of molecular ions like sodium or calcium, the positive charges on chitosan and other polyelectrolytes have a fixed separation and often cannot continuously adjust their spacing to neutralize a stoichiometric number of charges fixed with different spacing on a surface. X-ray crystallography shows that the amide groups in chitin are about 1.5 nm apart, so the spacings between charges in nearly fully deacyltated chitosan should be of the same magnitude [182, 183]. It is unlikely that the normal separations between negative charges in Survanta or albumin are completely compatible with the separation between amide groups on chitosan. In lung surfactant monolayers, the area per molecule for the liquid condensed phase of phosphatidylglycerol (the most common anionic lipid in Survanta) is about .45 nm2 [20], so a rough estimate of the minimum separation between negative charges is 0.7 nm. The distances between negative charges in albumin are also likely not compatible with the spacing between charges on chitosan. Hence, a chitosan molecule with n+ positive charges is generally not capable of forming ion pairs with an equivalent number, n−, of fixed surface charges, as would be the case for n+ individual sodium ions, for example. Hence, while n+ positive charges on chitosan adsorbed to the surfactant or albumin can neutralize the average “smeared” net n− negative charges in the double layer, resulting in a zero net potential in Eqn. 14, the surface itself remains heterogeneous with patches of positive and negative charges [184–187]. Such a heterogeneous surface can lead to a short range “dipolar attraction” between the interfacial albumin and the surfactant bilayer aggregates, leading to a net attractive interaction between the surfactant and the interface. The can lead to enhanced adsorption even relative to a clean surface. In Fig. 23a, for chitosan concentration of 1 μg/ml, the amount of Survanta adsorbed to the interface in the presence of albumin is even greater than the control adsorption to a clean interface.
However, if excess chitosan is present in solution, it can continue to adsorb as the polycation sees both attractive negative and repulsive positive charges on the surface while the net potential is low. The excess chitosan can form ion pairs with the remaining negative charges on the surfactant or albumin surfaces, however, a net excess of positive charges accumulate in the double-layer as not all the chitosan charges are neutralized by the surface. This overcompensation of charge is common; for example, certain polycations adsorb on net positively charged TiO2 surfaces, where both positive and negative point charges coexist [187]. The result is a charge reversal as more positive ions are present in the vicinity of the surfaces than negative ions. Excess chitosan can continue to adsorb until the surfaces are sufficiently positively charged that the positively charged polymer is repelled from the surface by a now positive colloid/polymer surface (Eqn. 14) [185–187]. Kang et al. [137] have shown that the surface potential of surfactant aggregates changes from negative to positive with increasing chitosan concentrations. The net positively charged albumin and surfactant particles again have a repulsive interaction, but with a new positive value of Φmax, leading to a decreased rate of surfactant adsorption to the interface. A secondary effect that may contribute to the reduction of adsorption at higher chitosan concentrations is that chitosan adsorbed to the Survanta aggregates might sterically hinder the conversion of the Survanta bilayers to monolayers. Chitosan adsorbed to giant unilamellar vesicles stabilized the spherical bilayer structure against changes in pH or osmotic pressure [213] that completely disrupted unprotected vesicles.
True equilibrium between the polycation and the anionic colloid is almost never obtained; polyelectrolyte adsorption is yet another case of kinetically hindered equilibrium. While each electrostatic ion pair between the polymer and the surface is weak, the large number possible between the polyelectrolyte (chitosan has ~ 500 cationic amine sites/molecule) and the negative charges makes the adsorption effectively irreversible [185–187]. Once bound, the polycation cannot readily adjust its position on the surface to neutralize the equivalent number of negative charges, especially if the charge distribution on the polymer does not match that on the surface. If the adjacent solution is diluted, the pH changed, etc., the polyelectrolyte does not necessarily desorb; there is a pronounced adsorption hysteresis that is typical for kinetically hindered equilibrium. This irreversibility of adsorption, combined with charge reversal makes possible the preparation of polyelectrolyte multilayers of anionic and cationic polymers on a variety of substrates including multilamellar liposomes [185–187]
Fig. 24 shows a quantitative demonstration of the effects of this chitosan-induced charge neutralization followed by charge over-compensation on the adsorption of lung surfactant to an albumin-covered interface. The relative adsorption, RA, increases about 20 times as the chitosan concentration is increased from 0 to 5 μg/mL; subsequent increases in chitosan concentration result in roughly a five-fold decrease in RA from the maximum. The optimal concentration range to enhance surfactant adsorption by chitosan (RA ~ 1) is 1–5 μg/ml. From Fig. 23a, surfactant adsorption is even greater at 1 μg/ml chitosan in the presence of albumin than on a clean interface. Estimates show that this concentration range of chitosan is approximately that needed to neutralize the surface charge on the albumin at the interface and the surfactant. This range is shown as the dashed box in Fig. 24, which should provide the greatest decrease in both ψs and Φmax; the concentration range within the dashed box corresponds to the highest RA. This result is consistent with charge neutralization leading to enhanced surfactant adsorption. The higher adsorption at 1 μg/ml chitosan is consistent with the formation of a heterogeneous surface with patches of positive and negative charges on the surfactant and albumin, which provide a dipolar attraction at close range. At higher chitosan concentrations, the surfactant and albumin at the interface are net positively charged, resulting in a partially restored +ψs and Φpos and the albumin inhibition is only partially reversed. It should be noted that chitosan enhances surfactant adsorption (RA > 0.2) relative to albumin even at chitosan concentrations two orders of magnitude higher than charge neutralization, yielding a broad window of enhanced surfactant adsorption. A possible explanation for this behavior is that, from studies of alternate layer polyelectrolyte adsorption on surfaces, chitosan and other polyelectrolytes eventually saturate the surface and do not continuously increase the surface charge and surface potential with increasing bulk chitosan concentration [185, 187]. Once the surfaces are saturated, the excess chitosan and counterions in solution reduce the Debye length, so that the electrostatic interactions due to the cationic polymers on the surfaces are shielded by the higher electrolyte concentration and resulting smaller Debye length (Eqn. 14). This likely slows the decrease in surfactant adsorption with increasing chitosan concentration, just as is observed for higher electrolyte concentrations in Figs. 13, 14. This optimal window of enhanced adsorption with the cation/anion charge ratio is almost identical to that reported for the stability ratio for chitosan induced flocculation of anionic colloidal particles [182–184].
Figure 24.

Relative adsorption (RA) of 800 μg Survanta on subphases containing 2 mg/mL albumin at varying chitosan concentrations. □ Survanta-albumin-chitosan; ○ Survanta-albumin, which as been plotted at a chitosan concentration of 7×10⁻⁵ mg/mL for comparison purposes. All surface pressures were evaluated by averaging over the same trough area, A0, denoted by the shaded area in Fig. 23. The relative adsorption increases with chitosan concentration to an optimum value of RA ~ 1 at .001 – 0.005 mg/mL chitosan and then decreases with subsequent increases in chitosan concentration. The dashed box indicates the calculated chitosan concentration range where n+/n− = 1 (0.0005–0.005 mg/mL) [80]. The optimum RA occurs in this chitosan concentration range consistent with a chitosan neutralizing the negative surface charge on the albumin and surfactant, thereby eliminating the electrostatic energy barrier to surfactant adsorption. Higher chitosan concentrations above n+/n− = 1 lead to charge reversal as excess chitosan adsorbs to the albumin and surfactant, leading to a net positive charge in the double layer and a restored energy barrier to adsorption (Eqn. 14). Figure adapted from [80].
Conclusions
A necessary [13, 42, 79–84, 97], but not sufficient condition [58, 60, 61, 214] for surfactant activity is to have sufficient LS adsorbed to the interface from the type II cells that line the alveoli, or from an exogenous surfactant suspension. The competitive adsorption of serum proteins to the air-water interface can inhibit the adsorption of lung surfactant, leading to poor surfactant performance. Many serum proteins are surface-active and water-soluble and can quickly diffuse to an air-water interface. Albumin (as well as any other surface-active material) adsorbed at the alveolar air-water interface induces an energy barrier that inhibits surfactant transport to the interface, thereby slowing surfactant adsorption. The physical processes governing surfactant transport to an interface are fundamentally similar to those that determine colloid stability; the energy barrier that limits surfactant adsorption in the presence of serum proteins is directly analogous to those that lead to colloid stability against aggregation.
The energy barrier to surfactant adsorption due to serum proteins at the interface is primarily electrostatic; a double-layer repulsion arises due to the negative lipids in lung surfactant and the net negative charge on albumin (and other serum proteins) at the interface. Classical methods of manipulating the double-layer repulsion in colloids using electrolytes have similar, predictable effects on surfactant adsorption. Decreasing the electrolyte concentration below physiological levels increases the Debye length and the magnitude and range of the double layer repulsion, which eliminates surfactant adsorption even in the presence of the polymer induced depletion attraction. Conversely, increasing the bulk electrolyte concentration well above physiological levels restores surfactant adsorption in the presence of albumin without the need for added polymer. Divalent calcium enhances surfactant adsorption at concentrations 2−6 lower that monovalent sodium, in good agreement with the classical Schulze-Hardy rule for the critical flocculation concentration for colloids.
As is also the case for colloid stability, hydrophilic, non-adsorbing polymers such as PEG, dextran and hyaluronic acid induce a depletion attraction between the LS aggregates and the interface that can lower the repulsive potential and enhance adsorption. These polymers flocculate surfactant aggregates in solution as well as enhance the adsorption of surfactant to the interface. X-ray diffraction and reflectivity confirm the presence of a depletion layer of PEG at the air-water interface and that Survanta organization is unchanged by PEG. Adsorption enhancement scales exponentially with the polymer concentration as predicted by a simple excluded volume model of the depletion attraction combined with the basic DLVO theory of colloid stability. The enhancement of adsorption with molecular weight is more complicated; a minimum molecular weight is necessary so that the range of the depletion attraction, which is limited to the polymer diameter, overlaps with the maximum in the repulsive potential, which is determined by the Debye length, and hence the electrolyte concentration. The simple excluded volume model of the depletion attraction also does not apply for polymers above the overlap concentration; the depletion attraction decreases and the solution viscosity increases resulting in less adsorption.
Cationic polyelectrolytes such as chitosan, in analogy to their effects on colloid stability, improve the adsorption of LS at extremely low concentrations of 1 μg/ml compared to ~10 mg/ml for 10 kDa PEG under otherwise identical conditions. However, unlike PEG or simple salts, increasing the chitosan concentration above optimal causes surfactant inhibition to reoccur. Only an optimal range of chitosan concentration that neutralizes the charge of the surfactant aggregates and albumin reverses inhibition, which is identical to that observed in flocculation of colloidal particles by chitosan and other cationic polyelectrolytes. The mechanism of action for both colloid aggregation and surfactant adsorption is consistent with an initial charge neutralization of the anionic surfaces by the cationic polymer, which causes an elimination of the double-layer repulsion. However, higher polymer concentrations lead to overcompensation of the surface charge, which re-establishes the electrostatic energy barrier, leading to a decrease in surfactant adsorption.
In short, every additive known to de-stabilize a charged colloidal suspension also enhances the competitive adsorption of LS to an albumin-covered interface: hydrophilic polymers that induce a depletion attraction [42], increased concentrations of molecular electrolytes that reduce the Debye length and screen the double-layer repulsion [79], and polycations that first neutralize the double-layer repulsion, then over compensate and re-stabilize the colloidal dispersion [80]. The simple analogy between colloid stability and competitive adsorption appears to be both qualitatively predictive and quantitatively accurate and the same scaling laws that determine the optimal concentrations for coagulating colloids appear to work well for enhancing surfactant adsorption.
In addition to their generic effects on surfactant adsorption, albumin, PEG, calcium, and chitosan can have specific effects that depend on surfactant composition and phase behavior. Comparing fluorescence images, GIXD, XR, and isotherms of Survanta on clean or albumin-covered interfaces with added chitosan [80], higher than physiological electrolyte concentrations [79], or with added PEG [82, 83, 97] in the subphase shows that the morphology and molecular organization of Survanta does not change, confirming that all of these treatments leave the surfactant film essentially intact; only the transport to the interface is enhanced. For all methods of enhancing adsorption [58, 79–84, 97], the adsorption processes are similar:
Albumin (or serum proteins or lysolipids) initially occupies the entire interface; the smaller size of albumin and its molecular solubility compared to LS aggregates promotes faster diffusion to the interface
LS breaks through the albumin film, depending on the subphase conditions and the presence of additives that also promote coagulation of colloidal particles, during cycling and coexists with albumin in discrete domains on the interface
If sufficient LS adsorbs such that the surface pressure is raised to > 45 mN/m during compression, the albumin is completely expelled from the interface.
LS prevents subsequent albumin re-adsorption to the interface; the fluorescence images show behavior typical of Survanta on a clean subphase including cracks and folds at the collapse plateau.
Albumin expulsion from the interface (step 3) occurs completely only over an optimal chitosan concentration range (1 – 5 μg/ml); higher and lower chitosan concentrations do not fully expel the albumin from the interface. Similarly, at lower than optimal concentrations, electrolyte and PEG also show LS break-through but not complete expulsion of the albumin. LS entirely expels the albumin at higher PEG or electrolyte concentrations [58, 79–84, 97]. It appears that the surface pressure must reach levels much higher than the equilibrium surface pressure of albumin (~20mN/m) to completely remove albumin from the interface [58, 79–84, 97].
In all cases, surfactant adsorption is enhanced without significant alteration of the equilibrium surface pressure, the maximum surface pressure at collapse, and for Survanta, the molecular packing at the interface. Albumin and Survanta appear immiscible in the fluorescence images; we observe a well-defined front of Survanta that displaces the albumin from the interface (See Movie in Supplemental Material). However, Zuo et al. [167] observed changes in bovine lung extract surfactant (BLES) film morphology and isotherms at low surface pressures which they ascribed to albumin and BLES film miscibility. The likely explanation for these differences is the much larger fraction of unsaturated lipids in BLES compared to Survanta [87], and the resulting larger fraction of liquid expanded (LE) phase in BLES monolayers compared to Survanta monolayers [138].
However, enhancing adsorption is likely not a cure-all; if the surfactant is chemically or physically degraded by other processes associated with ARDS, increasing the concentration of the substandard surfactant at the interface will not eliminate inactivation [60, 61]. As none of these methods of enhancing adsorption also alter the surfactant properties at the interface, a poor surfactant will remain a poor surfactant regardless of how electrolyte, polymer or polyelectrolyte enhance adsorption. As has been shown numerous times in the literature, not every surfactant mixture is capable of providing a film capable of lowering the surface tension below 10 mN/m on compression necessary for proper lung function. Hence, surfactant adsorption remains a necessary, but not sufficient condition for eliminating surfactant inactivation in ARDS.
Supplementary Material
Acknowledgments
We thank Alan Waring and Bill Taeusch for ongoing collaborations on surfactant chemistry, physics and physiology, and the Neotatal Intensive Care Unit at Cottage Hospital for supplies of Survanta. Support for this work comes from National Institute of Health Grant HL-51177 (JAZ, IS, PD). P.C.S. was partially supported by an NSF graduate research fellowship.
Footnotes
Publisher's Disclaimer: This is a PDF file of an unedited manuscript that has been accepted for publication. As a service to our customers we are providing this early version of the manuscript. The manuscript will undergo copyediting, typesetting, and review of the resulting proof before it is published in its final citable form. Please note that during the production process errors may be discovered which could affect the content, and all legal disclaimers that apply to the journal pertain.
References
- 1.Bastacky J, Lee CY, Goerke J, Koushafar H, Yager D, Speed TP, Chen Y, Clements JA. Alveolar lining layer is thin and continuous: low temperature scanning electron microscopy of rat lung. J Applied Physiology. 1995;79:1615–1628. doi: 10.1152/jappl.1995.79.5.1615. [DOI] [PubMed] [Google Scholar]
- 2.Clements JA, Avery ME. Lung surfactant and neonatal respiratory distress syndrome. American Journal of Respiratory and Critical Care Medicine. 1998;157:S59–S66. doi: 10.1164/ajrccm.157.4.nhlb1-1. [DOI] [PubMed] [Google Scholar]
- 3.Notter R. Lung surfactant: basic science and clinical applications. Marcel Dekker; New York: 2000. [Google Scholar]
- 4.Perez-Gil J. Structure of pulmonary surfactant membranes and films: the role of proteins and lipid-protein interactions. Biochimica et Biophysica acta (BBA)-Biomembranes. 2008;1778:1676–1695. doi: 10.1016/j.bbamem.2008.05.003. [DOI] [PubMed] [Google Scholar]
- 5.Zasadzinski JA, Ding J, Warriner HE, Bringezu F, Waring AJ. The physics and physiology of lung surfactants. Current Opinion in Colloid & Interface Science. 2001;6:506–513. [Google Scholar]
- 6.Goerke J. Pulmonary surfactant: functions and molecular composition. Biochimica et Biophysica Acta. 1998;1408:79–89. doi: 10.1016/s0925-4439(98)00060-x. [DOI] [PubMed] [Google Scholar]
- 7.Possmayer F. A proposed nomenclature for pulmonary surfactant-associated proteins. Am Rev Respir Dis. 1988;138:990–998. doi: 10.1164/ajrccm/138.4.990. [DOI] [PubMed] [Google Scholar]
- 8.Avery ME. Surfactant deficiency in hyaline membrane disease - The story of discovery. American Journal of Respiratory and Critical Care Medicine. 2000;161:1074–1075. doi: 10.1164/ajrccm.161.4.16142. [DOI] [PubMed] [Google Scholar]
- 9.Zuo YY, Veldhuizen RA, Neumann AW, Peterson NO, Possmayer F. Current perspectives in pulmonary surfactant - inhibition, enhancement and evaluation. Biochim Biophys Acta. 2008;1778:1947–1977. doi: 10.1016/j.bbamem.2008.03.021. [DOI] [PubMed] [Google Scholar]
- 10.Marsh D. Lateral pressure in membranes. Biochim Biophys Acta. 1996;1286:183–223. doi: 10.1016/s0304-4157(96)00009-3. [DOI] [PubMed] [Google Scholar]
- 11.Schürch S, Goerke J, Clements JA. Direct determination of surface tension in the lung. Proc Nat Acad Sci USA. 1976;73:4698–4702. doi: 10.1073/pnas.73.12.4698. [DOI] [PMC free article] [PubMed] [Google Scholar]
- 12.Schürch S, Goerke J, Clements JA. Direct determination of volume and time-dependence of alveolar surface tension in excised lungs. Proc Nat Acad Sci USA. 1978;75:3417–3421. doi: 10.1073/pnas.75.7.3417. [DOI] [PMC free article] [PubMed] [Google Scholar]
- 13.Taeusch HW, de la Serna JB, Perez-Gil J, Alonso C, Zasadzinski JA. Inactivation of pulmonary surfactant due to serum-inhibited adsorption and reversal by hydrophilic polymers: Experimental. Biophysical Journal. 2005;89:1769–1779. doi: 10.1529/biophysj.105.062620. [DOI] [PMC free article] [PubMed] [Google Scholar]
- 14.Stratton C, Zasadzinski J, Elkins D. Lung lamellar body amphiphilic topography: A morphological evaluation using the continuum theory of liquid crystals: I. Anat Rec. 1988;221:503–519. doi: 10.1002/ar.1092210107. [DOI] [PubMed] [Google Scholar]
- 15.Stratton CJ. The periodicity and architecture of lipid retained and extracted lung surfactant and its origin from multilamellar bodies. Tissue Cell. 1977;9:301–16. doi: 10.1016/0040-8166(77)90023-4. [DOI] [PubMed] [Google Scholar]
- 16.Zasadzinski JA, Stratton C, Rudolph R. Lung lamellar body amphiphilic topography: A morphological evaluation using the continuum theory of liquid crystals: II. Anat Rec. 1988;221:520–532. doi: 10.1002/ar.1092210108. [DOI] [PubMed] [Google Scholar]
- 17.Daniels CB, Orgeig S. Pulmonary surfactant: the key to the evolution of breathing. News Physiol Sci. 2003;18:151–157. doi: 10.1152/nips.01438.2003. [DOI] [PubMed] [Google Scholar]
- 18.Enhorning G. Surfactant in Airway Disease. Chest. 2008;133:975–980. doi: 10.1378/chest.07-2404. [DOI] [PubMed] [Google Scholar]
- 19.Takamoto DY, Aydil E, Zasadzinski JA, Ivanova A, Schwartz DK, Yang T, Cremer P. Stable ordering in Langmuir-Blodgett films. Science. 2001;293:1292–1295. doi: 10.1126/science.1060018. [DOI] [PubMed] [Google Scholar]
- 20.Takamoto DY, Lipp MM, von Nahmen A, Lee KYC, Waring AJ, Zasadzinski JA. Interaction of lung surfactant proteins with anionic phospholipids. Biophysical Journal. 2001;81:153–169. doi: 10.1016/S0006-3495(01)75688-3. [DOI] [PMC free article] [PubMed] [Google Scholar]
- 21.Longo M, Bisagno A, Zasadzinski J, Bruni R, Waring A. A function of lung surfactant protein SP-B. Science. 1993;261:453–456. doi: 10.1126/science.8332910. [DOI] [PubMed] [Google Scholar]
- 22.Lipp MM, Lee KYC, Takamoto DY, Zasadzinski JA, Waring AJ. Coexistence of buckled and flat monolayers. Physical Review Letters. 1998;81:1650–1653. [Google Scholar]
- 23.Lipp MM, Lee KYC, Zasadzinski JA, Waring AJ. Phase and morphology changes in lipid monolayers induced by SP-B protein and its amino-terminal peptide. Science. 1996;273:1196–1199. doi: 10.1126/science.273.5279.1196. [DOI] [PubMed] [Google Scholar]
- 24.Lu W, Knobler CM, Bruinsma RF, Twardos M, Dennin M. Folding Langmuir monolayers. Phys Rev Lett. 2002;89:146107. doi: 10.1103/PhysRevLett.89.146107. [DOI] [PubMed] [Google Scholar]
- 25.Pocivavsek L, Dellsy R, Kern A, Johnson S, Lin B, Lee KYC, Cerda E. Stress and fold localization in thin elastic membranes. Science. 2008;320:912–916. doi: 10.1126/science.1154069. [DOI] [PubMed] [Google Scholar]
- 26.Bernhard W, Gebert A, Vieten G, Rau A, Hohfeld JM, Postle AD, Freihorst J. Pulmonary surfactant in birds: coping with surface tension in a tubular lung. Am J Physiol Regul Integr Com; Physiol. 2001;281:R327–R337. doi: 10.1152/ajpregu.2001.281.1.R327. [DOI] [PubMed] [Google Scholar]
- 27.Bernhard W, Hoffmann S, Dombrowsky H, Rau GA, Kamlage A, Kappler M, Haitsma JJ, Freihorst J, von der Hardt H, Poets CF. Phosphatidylcholine molecular species in lung surfactant: Composition in Relation to respiratory rate and lung development. Am J Respir Cell Mol Biol. 2001;25:725–731. doi: 10.1165/ajrcmb.25.6.4616. [DOI] [PubMed] [Google Scholar]
- 28.Bernhard W, Mottaghian J, Gebert A, Rau GA, von der Hardt H, Poets CF. Commercial versus native surfactants - Surface activity, molecular components, and the effect of calcium. American Journal of Respiratory and Critical Care Medicine. 2000;162:1524–1533. doi: 10.1164/ajrccm.162.4.9908104. [DOI] [PubMed] [Google Scholar]
- 29.Daniels CB, Orgeig S. The comparative biology of pulmonary surfactant: past, present and future. Comp Biochem Phys A. 2001;129:9–36. doi: 10.1016/s1095-6433(01)00303-8. [DOI] [PubMed] [Google Scholar]
- 30.Clements JA. Dependence of pressure-volume characteristics of lungs on intrinsic surface-active material. American Journal of Physiology. 1956;187:592–592. [Google Scholar]
- 31.Clements JA. Surface tension of lung extracts. Proceedings of the Society for Experimental Biology and Medicine. 1957;95:170–172. doi: 10.3181/00379727-95-23156. [DOI] [PubMed] [Google Scholar]
- 32.Clements JA. Pulmonary edema and permeability of alveolar membranes. Arch Environ Health. 1961;2:280. [PubMed] [Google Scholar]
- 33.Clements JA. Surface phenomena in relation to pulmonary function. Physiologist. 1962;5:11–28. [PubMed] [Google Scholar]
- 34.Avery ME, Mead J. Surface properties in relation to atelectasis and hyaline membrane disease. Am J Dis Child. 1959;97:917. doi: 10.1001/archpedi.1959.02070010519001. [DOI] [PubMed] [Google Scholar]
- 35.Pison U, Herold R, Schürch S. The pulmonary surfactant system:biological functions, components, physicochemical properties and alterations during lung disease. Colloids and Surfaces. 1996;114:165–184. [Google Scholar]
- 36.Suresh GK, Soll RF. Overview of Surfactant Replacement Trials. J Perinatol. 2005;25:S40–S44. doi: 10.1038/sj.jp.7211320. [DOI] [PubMed] [Google Scholar]
- 37.Egberts J. Theoretical changes in neonatal hospitalization costs after the introduction of porcine-derived lung surfactant (‘Curosurf’) PharmacoEconomincs. 1995;8:324–342. doi: 10.2165/00019053-199508040-00007. [DOI] [PubMed] [Google Scholar]
- 38.Lu KW, Taeusch HW, Robertson B, Goerke J, Clements JA. Polymer-surfactant treatment of meconium-induced acute lung injury. American Journal of Respiratory and Critical Care Medicine. 2000;162:623–628. doi: 10.1164/ajrccm.162.2.9909099. [DOI] [PubMed] [Google Scholar]
- 39.Tashiro K, Kobayashi T, Robertson B. Dextran reduces surfactant inhibition by meconium. Acta Paediatrica. 2000;89:1439–1445. doi: 10.1080/080352500456615. [DOI] [PubMed] [Google Scholar]
- 40.Tashiro K, Cui XG, Kobayashi T, Curstedt T, Robertson B. Modified protocols for surfactant therapy in experimental meconium aspriation syndrome. Biology of the Neonate. 2003;83:49–56. doi: 10.1159/000067009. [DOI] [PubMed] [Google Scholar]
- 41.Lu KW, Taeusch HW, Robertson B, Goerke J, Clements JA. Polyethylene glycol/surfactant mixtures improve lung function after HCl and endotoxin lung injuries. American Journal of Respiratory and Critical Care Medicine. 2001;164:1531–1536. doi: 10.1164/ajrccm.164.8.2104016. [DOI] [PubMed] [Google Scholar]
- 42.Zasadzinski JA, Alig TF, Alonso C, de la Serna JB, Perez-Gil J, Taeusch HW. Inhibition of pulmonary surfactant adsorption by serum and the mechanisms of reversal by hydrophilic polymers: Theory. Biophysical Journal. 2005;89:1621–1629. doi: 10.1529/biophysj.105.062646. [DOI] [PMC free article] [PubMed] [Google Scholar]
- 43.Ashbaugh DG, Bigelow DB, Perry TL, Levine BE. Acute respiratory distress in adults. Lancet. 1967;2:319–323. doi: 10.1016/s0140-6736(67)90168-7. [DOI] [PubMed] [Google Scholar]
- 44.Spragg RG. Abnormalities of lung surfactant function in patients with acute lung injury. In: Zapol WM, Lemaire F, editors. Adult Respiratory Distress Syndrome. Vol. 50. Marcel Dekker; New Yotk: 1991. pp. 381–395. [Google Scholar]
- 45.Spragg RG, Lewis JF, Walmrath H, Johannigman J, Bellingan G, Laterre P, Witte MC, Richards GA, Rippin G, Rathgeb F, Hafner D, Taut FJH, Seeger W. Effect of recombinant surfactant protein C-based surfactant on the acute respiratory distress syndrome. New England Journal of Medicine. 2004;351:884–892. doi: 10.1056/NEJMoa033181. [DOI] [PubMed] [Google Scholar]
- 46.Taeusch HW. Treatment of acute (adult) respiratory distress syndrome - The holy grail of surfactant therapy. Biology of the Neonate. 2000;77:2–8. doi: 10.1159/000047050. [DOI] [PubMed] [Google Scholar]
- 47.Gregory TJ, Steinberg KP, Spragg R, Gadek JE, Hyers TM, Longmore WJ, Moxley MA, Cai GZ, Hite RD, Smith RM, Hudson LD, Crim C, Newton P, Mitchell BR, Gold AJ. Bovine surfactant therapy for patients with acute respiratory distress syndrome. American Journal of Respiratory and Critical Care Medicine. 1997;155:1309–1315. doi: 10.1164/ajrccm.155.4.9105072. [DOI] [PubMed] [Google Scholar]
- 48.Hyers TM. Adult respiratory distress syndrome: definition, risk factors and outcome. In: Zapol WM, Lemaire F, editors. Adult Respiratory Distress Syndrome. Vol. 50. Marcel Dekker; New York: 1991. pp. 23–33. [Google Scholar]
- 49.Spragg RJ, Smith RM. N.A.T.O.S.A. Division. Surfactant replacement in patients with ARDS: Result of Clinical Trials. In: Matalon S, Sznajder JI, editors. Acute respiratory distress syndrome: cellular and molecular mechanisms and clinical management. Vol. 297. Plenum Press; New York: 1998. pp. 107–116. [Google Scholar]
- 50.McIntyre RC, Pulido EJ, Bensard DD, Shames BD, Abraham E. Thirty years of clinical trials in acute respiratory distress syndrome. Critical Care Medicine. 2000;28:3314–3331. doi: 10.1097/00003246-200009000-00034. [DOI] [PubMed] [Google Scholar]
- 51.Anzueto A, Jubran A, Ohar JA, Piquette CA, Rennard SI, Colice G, Pattishall EN, Barrett J, Engle M, Perret KA, Rubin BK. Effects of aerosolized surfactant in patients with stable chronic bronchitis - A prospective randomized controlled trial. Jama-Journal of the American Medical Association. 1997;278:1426–1431. [PubMed] [Google Scholar]
- 52.Willson DF, Thomas NJ, Markovitz BP, Bauman LA, DiCarlo JV, Pon S, Jacobs BR, Jefferson LS, Conaway MR, Egan EA. Effect of exogenous surfactant (calfactant) in pediatric acute lung injury. JAMA. 2005;293:470–476. doi: 10.1001/jama.293.4.470. [DOI] [PubMed] [Google Scholar]
- 53.Willson DF, Chess PR, Notter RH. Surfactant for pediatric acute lung injury. Pediatr Clin North Am. 2008;55:545–575. doi: 10.1016/j.pcl.2008.02.016. [DOI] [PMC free article] [PubMed] [Google Scholar]
- 54.Duffett M, Choong K, Ng V, Randolph A, Cook DJ. Surfactant therapy for acute respiratory failure in children: a systematic review and meta-analysis. Critical Care. 2007;11 doi: 10.1186/cc5944. [DOI] [PMC free article] [PubMed] [Google Scholar]
- 55.Kesecioglu J, Haitsma JJ. Surfactant therapy in adults with acute lung injury/acute respiratory distress syndrome. Current Opinion in Critical Care. 2006;12:55–60. doi: 10.1097/01.ccx.0000199000.19393.a7. [DOI] [PubMed] [Google Scholar]
- 56.Zasadzinski J, Stratton C, Heetderks D. Liquid crystal morphology and defects in in vivo human and mammalian phosphatidylcholine lung multilamellar surfactant. Langmuir. 1987;3:592–595. [Google Scholar]
- 57.Manzanares D, Rodriguez-Capote K, Liu SC, Haines T, Ramos Y, Zhao L, Doherty-Kirby A, Lajoie G, Possmayer F. Modification of tryptophan and methionine residues is implicated in the oxidative inactivation of Surfactant Protein B. Biochemistry. 2007;46:5604–5615. doi: 10.1021/bi062304p. [DOI] [PubMed] [Google Scholar]
- 58.Stenger PC, Alonso C, Zasadzinski JA, Waring AJ, Jung CL, Pinkerton K. Environmental tobacco smoke effects on lung surfactant film organization. Biochim Biophys Acta. 2009;1788:358–370. doi: 10.1016/j.bbamem.2008.11.021. [DOI] [PMC free article] [PubMed] [Google Scholar]
- 59.Bakshi MS, Zhao L, Smith R, Possmayer F, Peterson NO. Metal nanoparticle pollutants interfere with pulmonary surfactant function in vitro. Biophys J. 2008;94:855–868. doi: 10.1529/biophysj.107.106971. [DOI] [PMC free article] [PubMed] [Google Scholar]
- 60.Gunasekara L, Schoel WM, Schürch S, Amrein MW. A comparitive study of mechanisms of surfactant inhibition. Biochim Biophys Acta. 2008;1778:433–444. doi: 10.1016/j.bbamem.2007.10.027. [DOI] [PubMed] [Google Scholar]
- 61.Gunasekara L, Schurch S, Schoel WM, Nag K, Leonenko Z, Haufs M, Amrein MW. Pulmonary surfactant function is abolished by an elevated level of cholesterol. Biochim Biophys Acta. 2005;1737:27–35. doi: 10.1016/j.bbalip.2005.09.002. [DOI] [PubMed] [Google Scholar]
- 62.Da Silva K, McCaig LA, Veldhuizen RA, Possmayer F. Protein inhibition of surfactant during mechanical ventilation of isolated rat lungs. Exp Lung Research. 2005;31:745–758. doi: 10.1080/01902140500267431. [DOI] [PubMed] [Google Scholar]
- 63.Taneva S, Keough KMW. Cholesterol modifies the properties of surface films of DPPC plus pulmonary surfactant-associated protein B or C spread or adsorbed at the air-water interface. Biochemistry. 1997;36:912–922. doi: 10.1021/bi9623542. [DOI] [PubMed] [Google Scholar]
- 64.Keating E, Rahman L, Francis J, Petersen A, Possmayer F, Veldhuizen RA, Peterson NO. Effect of cholesterol on the biophysical and physiological properties of a clincal pulmonary surfactant. Biophys J. 2007;93:1391–1401. doi: 10.1529/biophysj.106.099762. [DOI] [PMC free article] [PubMed] [Google Scholar]
- 65.Wang Z, Schwan AL, Lairson LL, O’Donnell JS, Byrne GF, Foye A, Holm BA, Notter RH. Surface activity of a synthetic lung surfactant containing a phopholipase-resistant phosphonolipid analog of DPPC. Am J Physiol Lung Cell Mol Physiol. 2003;285:L550–L559. doi: 10.1152/ajplung.00346.2002. [DOI] [PubMed] [Google Scholar]
- 66.Rodriguez-Capote K, Manzanares D, Haines T, Possmayer F. Reactive oxygen species inactivation of surfactant involves structural and functional alterations to surfactant proteins SP-B and SP-C. Biophysical Journal. 2006;90:2808–2821. doi: 10.1529/biophysj.105.073106. [DOI] [PMC free article] [PubMed] [Google Scholar]
- 67.Liu S, Zhao L, Manzanares D, Doherty-Kirby A, Zhang C, Possmayer F, Lajoie GA. Characterization of bovine surfactant proteins B and C by electrospray ionizaiton mass spectrometry. Rapid Comm in Mass Spectrom. 2008;22:197–203. doi: 10.1002/rcm.3345. [DOI] [PubMed] [Google Scholar]
- 68.Holm BA, Enhorning G, Notter RH. A Biophysical Mechanism by Which Plasma-Proteins Inhibit Lung Surfactant Activity. Chemistry and Physics of Lipids. 1988;49:49–55. doi: 10.1016/0009-3084(88)90063-1. [DOI] [PubMed] [Google Scholar]
- 69.Holm BA, Notter RH, Finkelstein JN. Surface-Property Changes from Interactions of Albumin with Natural Lung Surfactant and Extracted Lung Lipids. Chemistry and Physics of Lipids. 1985;38:287–298. doi: 10.1016/0009-3084(85)90022-2. [DOI] [PubMed] [Google Scholar]
- 70.Holm BA, Wang WD, Notter RH. Multiple mechanisms of lung surfactant inhibition. Pediatric Research. 1999;46:85–93. doi: 10.1203/00006450-199907000-00015. [DOI] [PubMed] [Google Scholar]
- 71.Seeger W, Grube C, Gunther A, Schmidt R. Surfactant inhibition by plasma proteins: differential sensitivity of various surfactant preparations. European Respiratory Journal. 1993;6:971–977. [PubMed] [Google Scholar]
- 72.Nakos G, Kitsiouli EI, Tsangaris I, Lekka ME. Bronchoalveolar lavage fluid characteristics of early intermediate and late phases of ARDS - Alterations in leukocytes, proteins, PAF and surfactant components. Intensive Care Medicine. 1998;24:296–303. doi: 10.1007/s001340050571. [DOI] [PubMed] [Google Scholar]
- 73.Mbagwu N, Bruni R, Hernández-Juviel JM, Waring AJ, Walther FJ. Sensitivity of synthetic surfactants to albumin inhibition in preterm rabbits. Molecular Genetics and Metabolism. 1999;66:40–8. doi: 10.1006/mgme.1998.2788. [DOI] [PubMed] [Google Scholar]
- 74.Warriner HE, Ding J, Waring AJ, Zasadzinski JA. A concentration-dependent mechanism by which serum albumin inactivates replacement lung surfactants. Biophysical Journal. 2002;82:835–842. doi: 10.1016/S0006-3495(02)75445-3. [DOI] [PMC free article] [PubMed] [Google Scholar]
- 75.Gunther A, Ruppert C, Schmidt R, Markart P, Grimminger F, Walmrath D, Seeger W. Surfactant alteration and replacement in acute respiratory distress syndrome. Respiratory Research. 2001;2:353–U2. doi: 10.1186/rr86. [DOI] [PMC free article] [PubMed] [Google Scholar]
- 76.Ishizaka A, Matsuda T, Albertine KH, Koh H, Tasaka S, Hasegawa N, Kohno N, Kotani T, Morisaki H, Takeda J, Nakamura M, Fang XH, Martin TR, Matthay MA, Hashimoto S. Elevation of KL-6, a lung epithelial cell marker, in plasma and epithelial lining fluid in acute respiratory distress syndrome. American Journal of Physiology-Lung Cellular and Molecular Physiology. 2004;286:L1088–L1094. doi: 10.1152/ajplung.00420.2002. [DOI] [PubMed] [Google Scholar]
- 77.Hallman M, Glumoff V, Ramet M. Surfactant in respiratory distress syndrome and lung injury. Comparative Biochemistry and Physiology a-Molecular & Integrative Physiology. 2001;129:287–294. doi: 10.1016/s1095-6433(01)00324-5. [DOI] [PubMed] [Google Scholar]
- 78.Seeger W, Gunther A, Thede C. Differential sensitivity to fibrinogen inhibition of SP-C vs SP-B based surfactants. Am J Physiology. 1992;261:L286–L291. doi: 10.1152/ajplung.1992.262.3.L286. [DOI] [PubMed] [Google Scholar]
- 79.Stenger PC, Isbell SG, St Hilaire D, Zasadzinski JA. Rediscovering the Schulz-Hardy Rule in Competitive Adsorption to an Air-Water Interace. Langmuir. 2009;25:10045–10050. doi: 10.1021/la9009724. [DOI] [PMC free article] [PubMed] [Google Scholar]
- 80.Stenger PC, Palazolgu O, Zasadzinski JA. Mechanisms of polyelectrolyte enhanced surfactant adsorption at the air-water interface. Biochim Biophys Acta. 2009;1788:1033–1043. doi: 10.1016/j.bbamem.2009.01.006. [DOI] [PMC free article] [PubMed] [Google Scholar]
- 81.Stenger PC, Palazolgu O, Zasadzinski JA. The mechanism of chitosan lung surfactant adsorption at the air-liquid interface in the presence of serum proteins. In: Tok JB, editor. Proceedings of the Materials Research Society. 1061E. MRS Society; Boston: 2008. [Google Scholar]
- 82.Stenger PC, Wu G, Chi EY, Frey SL, Lee KYC, Majewski J, Kjaer K, Zasadzinski JA. Competitive adsorption of lung surfactant and serum proteins at the air-liquid inerface: a grazing incidence X-ray diffraction study. In: Thompson C, Durr H, Toney M, Noh D, editors. Proceedings of the Materials Researc Society. 1027E. MRS Society; Boston: 2008. [Google Scholar]
- 83.Stenger PC, Zasadzinski JA. Enhanced surfactant adsorption via polymer depletion forces: A simple model for reversing surfactant inhibition in acute respiratory distress syndrome. Biophysical Journal. 2007;92:3–9. doi: 10.1529/biophysj.106.091157. [DOI] [PMC free article] [PubMed] [Google Scholar]
- 84.Stenger PS, Isbell SG, Zasadzinski JA. Molecular Weight Dependence of the Depletion Attraction and Its Effects on the competitive adsorption of lung surfactant. Biochim Biophys Acta. 2008;1778:2032–2040. doi: 10.1016/j.bbamem.2008.03.019. [DOI] [PMC free article] [PubMed] [Google Scholar]
- 85.Lu JJ, Cheung WWY, Yu LMY, Policova Z, Li D, Hair ML, Neumann AW. The effect of dextran to restore the activity of pulmonary surfactant inhibited by albumin. Respiratory Physiology & Neurobiology. 2002;130:169–179. doi: 10.1016/s0034-5687(02)00006-3. [DOI] [PubMed] [Google Scholar]
- 86.Larsson M, Nylander T, Keough KMW, Nag K. An X-ray diffraction study of alterations in bovine lung bilayer structures induced by albumin. Chemistry and Physics of Lipids. 2006;144:137–145. doi: 10.1016/j.chemphyslip.2006.08.006. [DOI] [PubMed] [Google Scholar]
- 87.Braun A, Stenger PC, Warriner HE, Zasadzinski JA, Lu KW, Taeusch HW. A Freeze-Fracture Transmission Electron Microscope and Small Angle X-Ray Diffraction Study of the Effects of Albumin, Serum and Polymers on Clinical Lung Surfactant Microstructure. Biophysical Journal. 2007;93:123–139. doi: 10.1529/biophysj.106.095513. [DOI] [PMC free article] [PubMed] [Google Scholar]
- 88.Holm B, Venkitaraman A, Enhorning G, Notter R. Biophysical inhibition of synthetic lung surfactants. Chem Phys Lipids. 1990;52:243–250. doi: 10.1016/0009-3084(90)90120-g. [DOI] [PubMed] [Google Scholar]
- 89.Fuchimukai T, Fujiwara T, Takahashi A, Enhorning G. Artificial pulmonary surfactant inhibited by proteins. J Applied Physiology. 1987;62:429–437. doi: 10.1152/jappl.1987.62.2.429. [DOI] [PubMed] [Google Scholar]
- 90.Hiemenz PC. Principles of Colloid and Surface Chemistry. 2. Marcel Dekker, Inc; New York: 1986. [Google Scholar]
- 91.Krishnan A, Sturgeon J, Siedlecki CA, Vogler EA. Scaled interfacial activity of proteins at the liquid-vapor interface. Journal of Biomedical Materials Research Part A. 2004;68A:544–557. doi: 10.1002/jbm.a.20104. [DOI] [PubMed] [Google Scholar]
- 92.Seeger W, Stohr G, Wolf HR, Neuhof H. Alteration of surfactant function due to protein leakage: special interaction with fibrin monomer. Journal of Applied Physiology. 1985;58:326–338. doi: 10.1152/jappl.1985.58.2.326. [DOI] [PubMed] [Google Scholar]
- 93.Cockshutt A, Absolom D, Possmayer F. The role of palmitic acid in pulmonary surfactant: enhancement of surface activity and prevention of inhibition by blood proteins. Biochemica et Biophysica Acta. 1991;1085:248–256. doi: 10.1016/0005-2760(91)90101-m. [DOI] [PubMed] [Google Scholar]
- 94.Lu KW, Goerke J, Clements JA, Taeusch HW. Hyaluronan reduces surfactant inhibition and improves rat lung function after meconium injury. Pediatric Research. 2005;58:206–210. doi: 10.1203/01.PDR.0000169981.06266.3E. [DOI] [PubMed] [Google Scholar]
- 95.Yu LMY, Lu JJ, Chiu IWY, Leung KS, Chan YWW, Zhang L, Policova Z, Hair ML, Neumann AW. Poly(ethylene glycol) enhances the surface activity of a pulmonary surfactant. Colloids and Surfaces B-Biointerfaces. 2004;36:167–176. doi: 10.1016/j.colsurfb.2004.06.005. [DOI] [PubMed] [Google Scholar]
- 96.Zuo YY, Alolabi H, Shafiei A, Kang NX, Policova Z, Cox PN, Acosta E, Hair ML, Neumann AW. Chitosan enhances the in vitro surface activity of dilute lung surfactant preparations and resists albumin-induced inactivation. Pediatric Research. 2006;60:125–130. doi: 10.1203/01.pdr.0000227558.14024.57. [DOI] [PubMed] [Google Scholar]
- 97.Stenger PC, Wu G, Miller CE, Chi EY, Frey SL, Lee KYC, Majewski J, Kjaer K, Zasadzinski JA. X-ray diffraction and reflectivity study of the competitive adsorption of lung surfactant and albumin. Biophys J. 2009;97:777–786. doi: 10.1016/j.bpj.2009.05.017. [DOI] [PMC free article] [PubMed] [Google Scholar]
- 98.Dhar P, Cao Y, Fischer T, Zasadzinski JA. Active microrheology of aging protein films. Phys Rev Lett. 2009 doi: 10.1103/PhysRevLett.104.016001. in press. [DOI] [PMC free article] [PubMed] [Google Scholar]
- 99.Bae C, Takahashi A, Chida S, Sasaki M. Morphology and function of pulmonary surfactant inhibited by meconium. Pediatric Research. 1998;44:187–191. doi: 10.1203/00006450-199808000-00008. [DOI] [PubMed] [Google Scholar]
- 100.Schmiedl A, Krug N, Hohfeld JM. Influence of plasma and inflammatory proteins on the ultrastructure of exogenous surfactant. J Electron Microscopy (Japan) 2004;53:407–416. doi: 10.1093/jmicro/dfh056. [DOI] [PubMed] [Google Scholar]
- 101.Ochs M, Schuttler M, Stichtenoth G, Herting E. Morphological alterations of exogenous surfactant inhibited by meconium can be prevented by dextran. Respiratory Research. 2006;7:86–95. doi: 10.1186/1465-9921-7-86. [DOI] [PMC free article] [PubMed] [Google Scholar]
- 102.Hayat M. Principles and Techniques of Electron Microscopy: Biological Applications. 3. CRC Press, Inc; Boca Raton, Fla: 1989. [Google Scholar]
- 103.Zasadzinski JA, Bailey SM. Applications of Freeze-Fracture Replication to Problems in Materials and Colloid Science. Journal of Electron Microscopy Technique. 1989;13:309–334. doi: 10.1002/jemt.1060130406. [DOI] [PubMed] [Google Scholar]
- 104.Coleman D, Fernsler AJ, Chattham N, Nakata M, Takanishi Y, Korblova E, Link DR, Shao RF, Jang WG, Maclennan JE, Mondain-Monval O, Boyer C, Weissflog W, Pelzl G, Chien LC, Zasadzinski JA, Watanabe J, Walba DM, Takezoe H, Clark NA. Polarization modulated smectic liquid crystal phases. Science. 2003;301:1204–1211. doi: 10.1126/science.1084956. [DOI] [PubMed] [Google Scholar]
- 105.Kaler EW, Murthy AK, Rodriguez BE, Zasadzinski JAN. Spontaneous Vesicle Formation in Aqueous Mixtures of Single-Tailed Surfactants. Science. 1989;245:1371–1374. doi: 10.1126/science.2781283. [DOI] [PubMed] [Google Scholar]
- 106.Chiruvolu S, Warriner HE, Naranjo E, Idziak S, Radler JO, Plano RJ, Zasadzinski JA, Safinya CR. A Phase of Liposomes with Entangled Tubular Vesicles. Science. 1994;266:1222–1225. doi: 10.1126/science.7973704. [DOI] [PubMed] [Google Scholar]
- 107.Chiruvolu S, Walker S, Leckband D, Israelachvili J, Zasadzinski J. Higher order Self-Assembly of Vesicles by Ligand-Receptor Interactions. Science. 1994;264:1753–1756. doi: 10.1126/science.8209255. [DOI] [PubMed] [Google Scholar]
- 108.Coldren BA, van Zanten R, Mackel MJ, Zasadzinski JA, Jung HT. From vesicle size distributions to bilayer elasticity via cryo-transmission and freeze-fracture electron microscopy. Langmuir. 2003;19:5632–5639. [Google Scholar]
- 109.Branton DS, Bullivant S, Gilula NB, Karnovsky MJ, Moor H, Muhlethaler K, Northcote DH, Packer L, Satir B, Speth V, Staehelin LA, Steere RL, Weinstein RS. Freeze-etching nomenclature. Science. 1975;190:54–58. doi: 10.1126/science.1166299. [DOI] [PubMed] [Google Scholar]
- 110.Herve P, Roux D, Bellocq AM, Nallet F, Gulik-Krzywicki T. Dilute and concentrated phases of vesicles at thermal equilibrium. J Physique II (France) 1993;3:1255–1270. [Google Scholar]
- 111.Hope MJ, Wong KF, Cullis PR. Freeze-fracture of lipids and model membrane systems. J Electron Microscopy Technique. 1989;13:277–287. doi: 10.1002/jemt.1060130403. [DOI] [PubMed] [Google Scholar]
- 112.Meyer HW, Richter W. Freeze-fracture studies on lipids and membranes. Micron. 2001;32:615–644. doi: 10.1016/s0968-4328(00)00050-0. [DOI] [PubMed] [Google Scholar]
- 113.Zemb T, Dubois M, Deme B, Gulik-Krzywicki T. Self-assembly of flat nanodiscs in salt-free catanionic surfactant solutions. Science. 1999;283:816–819. doi: 10.1126/science.283.5403.816. [DOI] [PubMed] [Google Scholar]
- 114.Dubois M, Deme B, Gulik-Krzywicki T, Dedieu JC, Vautrin C, Desert S, Perez E, Zemb T. Self-assembly of regular hollow icosahedra in salt-free catanionic solutions. Nature. 2001;411:672–675. doi: 10.1038/35079541. [DOI] [PubMed] [Google Scholar]
- 115.Walker SA, Kennedy MT, Zasadzinski JA. Vesicles Inside Vesicles: A simple method of bilayer encapsulation by self-assembly. Nature. 1997;387:61–64. doi: 10.1038/387061a0. [DOI] [PubMed] [Google Scholar]
- 116.Kisak E, Coldren B, Zasadzinski JA. Nano-compartments enclosing vesicles, colloids and macromolecules via interdigitated lipid bilayers. Langmuir. 2002;18:284–288. [Google Scholar]
- 117.Kisak ET, Coldren B, Evans CA, Boyer C, Zasadzinski JA. The vesosome - A multicompartment drug delivery vehicle. Current Medicinal Chemistry. 2004;11:199–219. doi: 10.2174/0929867043456197. [DOI] [PubMed] [Google Scholar]
- 118.Spector MS, Naranjo E, Chiruvolu S, Zasadzinski JA. Conformations of a tethered membrane - crumpling in graphitic oxide. Phys Rev Lett. 1994;73:2867–2870. doi: 10.1103/PhysRevLett.73.2867. [DOI] [PubMed] [Google Scholar]
- 119.Spector MS, Zasadzinski JA, Sankaram MB. Topology of multivesicular liposomes, a model biliquid foam. Langmuir. 1996;12:4704–4708. [Google Scholar]
- 120.Jung HT, Coldren B, Zasadzinski JA, Iampietro D, Kaler EW. Origins of Stability of Spontaneous Vesicles. Proceedings of the National Academy of Sciences. 2001;98:1353–1357. doi: 10.1073/pnas.041420998. [DOI] [PMC free article] [PubMed] [Google Scholar]
- 121.Jung HT, Lee SY, Coldren B, Zasadzinski JA, Kaler EW. Gaussian curvature and the equilibrium between cylinders, discs and spheres. Proceedings of the National Academy of Sciences. 2002;99:15318–15322. doi: 10.1073/pnas.242374499. [DOI] [PMC free article] [PubMed] [Google Scholar]
- 122.Hough LE, Jung HT, Kruerke D, Heberling MS, Nakata M, Jones CD, Chen D, Link DR, Zasadzinski JA, Heppke G, Rabe JP, Stocker W, Korblova E, Walba DM, Glaser MA, Clark NA. Helical Nanofilament Phases. Science. 2009;325:456–460. doi: 10.1126/science.1170027. [DOI] [PubMed] [Google Scholar]
- 123.Bringezu F, Ding JQ, Brezesinski G, Waring AJ, Zasadzinski JA. Influence of pulmonary surfactant protein B on model lung surfactant monolayers. Langmuir. 2002;18:2319–2325. [Google Scholar]
- 124.Bringezu F, Ding JQ, Brezesinski G, Zasadzinski JA. Changes in model lung surfactant monolayers induced by palmitic acid. Langmuir. 2001;17:4641–4648. [Google Scholar]
- 125.Lee KYC, Gopal A, von Nahmen A, Zasadzinski JA, Majewski J, Smith GS, Howes PB, Kjaer K. Influence of palmitic acid and hexadecanol on the phase transition temperature and molecular packing of dipalmitoylphosphatidyl-choline monolayers at the air-water interface. Journal of Chemical Physics. 2002;116:774–783. [Google Scholar]
- 126.Safinya CR, Roux D, Smith GS, Sinha SK, Dimon P, Clark NA, Bellocq AM. Steric Interaction in a Model Multimembrane System: A Synchotron X-Ray Study. Physical Review Letters. 1986;57:2718–2721. doi: 10.1103/PhysRevLett.57.2718. [DOI] [PubMed] [Google Scholar]
- 127.Safinya CR, Sirota EB, Roux D, Smith GS. Universality in Interacting Membranes: the Effect of Cosurfactants on the Interfacial Rigidity. Physical Review Letters. 1989;62:1134–1137. doi: 10.1103/PhysRevLett.62.1134. [DOI] [PubMed] [Google Scholar]
- 128.Israelachvili JN. Intermolecular and Surface Forces. 2. Academic Press; London: 1992. [Google Scholar]
- 129.Helfrich W. Elastic Properties of Lipid Bilayers: Theory and Possible Experiments. Z Naturfosch. 1973;28c:693–703. doi: 10.1515/znc-1973-11-1209. [DOI] [PubMed] [Google Scholar]
- 130.Helfrich W. Steric Interaction of Fluid Membranes in Multilayer Systems. Z Naturforschung. 1978;33A:305–315. [Google Scholar]
- 131.Helfrich W. Effect of Thermal Undulations on the Rigidity of Fluid Membranes and Interfaces. J Physique (France) 1985;46:1263–1268. [Google Scholar]
- 132.Coldren BA, Warriner HE, van Zanten R, Zasadzinski JA, Sirota EB. Zero spontaneous curvature and its effects on lamellar phase morphology and vesicle size distributions. Langmuir. 2006;22:2474–2481. doi: 10.1021/la052448p. [DOI] [PubMed] [Google Scholar]
- 133.Parsegian VA, Rand RP, Fuller NL. Direct osmotic stress measurements of hydration and the electrostatic double layer forces between bilayers of double-chained ammonium acetate surfactants. J Phys Chem. 1991;95:4777–4782. [Google Scholar]
- 134.Parsegian VA, Rand RP, Fuller NL, Rau DC. Osmotic stress for the direct measurement of intermolecular forces. Methods in Enzymology. 1986;127:400–416. doi: 10.1016/0076-6879(86)27032-9. [DOI] [PubMed] [Google Scholar]
- 135.Parsegian VA, Rand RP, Rau DC. Osmotic stress, crowding, preferential hydration, and binding: a comparison of perspectives. Proc Nat Acad Sci USA. 2000;97:3987–3992. doi: 10.1073/pnas.97.8.3987. [DOI] [PMC free article] [PubMed] [Google Scholar]
- 136.Russel WB, Saville DA, Schowalter WR. Colloidal Dispersions. Cambridge University Press; Cambridge: 1989. [Google Scholar]
- 137.Kang NX, Policova Z, Bankian G, Hair ML, Zuo YY, Neumann AW, Acosta EJ. Interaction between chitosan and bovine lung extract surfactants. Biochimica Et Biophysica Acta-Biomembranes. 2008;1778:291–302. doi: 10.1016/j.bbamem.2007.10.003. [DOI] [PubMed] [Google Scholar]
- 138.Alonso C, Alig T, Yoon J, Bringezu F, Warriner H, Zasadzinski JA. More than a monolayer: Relating lung surfactant structure and mechanics to composition. Biophysical Journal. 2004;87:4188–4202. doi: 10.1529/biophysj.104.051201. [DOI] [PMC free article] [PubMed] [Google Scholar]
- 139.Ding JQ, Doudevski I, Warriner HE, Alig T, Zasadzinski JA. Nanostructure changes in lung surfactant monolayers induced by interactions between palmitoyloleoylphosphatidylglycerol and surfactant protein B. Langmuir. 2003;19:1539–1550. [Google Scholar]
- 140.vonNahmen A, Schenk M, Sieber M, Amrein M. The structure of a model pulmonary surfactant as revealed by scanning force microscopy. Biophysical Journal. 1997;72:463–469. doi: 10.1016/S0006-3495(97)78687-9. [DOI] [PMC free article] [PubMed] [Google Scholar]
- 141.McConnell HM. Structures and Transitions in Lipid Monolayers at the Air-Water-Interface. Annual Review of Physical Chemistry. 1991;42:171–195. [Google Scholar]
- 142.Alonso C, Bringezu F, Brezesinski G, Waring AJ, Zasadzinski JA. Modifying calf lung surfactant by hexadecanol. Langmuir. 2005;21:1028–1035. doi: 10.1021/la047894b. [DOI] [PubMed] [Google Scholar]
- 143.Lee KYC. Collapse Mechanisms of Langmuir Monolayers. Ann Rev Phys Chem. 2008;59:771–791. doi: 10.1146/annurev.physchem.58.032806.104619. [DOI] [PubMed] [Google Scholar]
- 144.Pocivavsek L, Frey SL, Krishnan K, Gavrilov K, Ruchala P, Waring A, Walther FJ, Dennin M, Witten TA, Lee KYC. Lateral stress relaxation and collapse in lipid monolayers. Soft Matter. 2008;4:2019–2029. doi: 10.1039/b804611e. [DOI] [PMC free article] [PubMed] [Google Scholar]
- 145.Lhert F, Yan W, Biswas SC, Hall SB. Effects of hydrophobic surfactant proteins on collapse of pulmonary surfactant monolayers. Biophysical Journal. 2007;93:4237–4243. doi: 10.1529/biophysj.107.111823. [DOI] [PMC free article] [PubMed] [Google Scholar]
- 146.Gopal A, Belyi VA, Diamant H, Witten TA, Lee KYC. Microscopic folds and macroscopic jerks in compressed lipid monolayers. J Phys Chem B. 2006;110:10220–10223. doi: 10.1021/jp0618983. [DOI] [PubMed] [Google Scholar]
- 147.Gopal A, Lee KYC. Headgroup percolation and collapse of condensed Langmuir monolayers. J Phys Chem B. 2006;110:22079–22087. doi: 10.1021/jp061562t. [DOI] [PubMed] [Google Scholar]
- 148.Garnaes J, Schwartz DK, Viswanathan R, Zasadzinski J. Domain boundaries and buckling superstructures in Langmuir-Blodgett films. Nature. 1992;357:54–57. [Google Scholar]
- 149.Ding JQ, Takamoto DY, von Nahmen A, Lipp MM, Lee KYC, Waring AJ, Zasadzinski JA. Effects of lung surfactant proteins, SP-B and SP-C, and palmitic acid on monolayer stability. Biophysical Journal. 2001;80:2262–2272. doi: 10.1016/S0006-3495(01)76198-X. [DOI] [PMC free article] [PubMed] [Google Scholar]
- 150.Discher BM, Maloney KM, Schief WRJ, Grainger DW, Hall SB. Lateral phase separation in interfacial films of pulmonary surfactant. Biophys J. 1996;71:2583–2590. doi: 10.1016/S0006-3495(96)79450-X. [DOI] [PMC free article] [PubMed] [Google Scholar]
- 151.Discher BM, Schief WRJ, Vogel V, Hall SB. Phase separation in monolayers of pulmonary surfactant phospholipids at the air-water interface: composition and structure. Biophys J. 1999;77:2051–2061. doi: 10.1016/S0006-3495(99)77046-3. [DOI] [PMC free article] [PubMed] [Google Scholar]
- 152.Diemel RV, Snell MME, Waring AJ, Walther FJ, Van Golde LMG, Putz G, Haagsman HP, Batenburg JJ. Multilayer formation upon compression of surfactant monolayers depends on protein concentration as well as lipid composition. J Biol Chem. 2002;277:21179–21188. doi: 10.1074/jbc.M111758200. [DOI] [PubMed] [Google Scholar]
- 153.Bauoukina S, Monticelli L, Risselada HJ, Marrink SJ, Tieleman DP. The molecular mechanism of monolayer collapse. Proc Nat Acad Sci USA. 2008;105:10801–10808. doi: 10.1073/pnas.0711563105. [DOI] [PMC free article] [PubMed] [Google Scholar]
- 154.Ybert C, Lu W, Moller G, Knobler CM. Kinetics of phase transitions in monolayers: collapse. J Phys: Condensed Matter. 2002;14:4753–4762. [Google Scholar]
- 155.Kjaer K. Some simple ideas on x-ray reflection and grazing-incidence diffraction from thin surfactant films. Physica B. 1994;198:100–109. [Google Scholar]
- 156.Als-Nielsen J, Jaquemain D, Kjaer K, Leveiller F, Lahav M, Leiserowitz Lb. Principles and applications of grazing incidence x-ray and neutron scattering from ordered molecular monolayers at the air-water interface. Phys Reports. 1994;246:252–313. [Google Scholar]
- 157.Wu G, Majewski J, Ege C, Kjaer K, Weygand M, Lee KYC. Lipid corralling and poloxamer squeeze out in membranes. Phys Rev Lett. 2004;93:028101–4. doi: 10.1103/PhysRevLett.93.028101. [DOI] [PubMed] [Google Scholar]
- 158.Pederson JS, Hamley IW. Analysis of neutron and x-ray reflectivity data by constrained least-squares methods. Physica B. 1994;198:16–23. [Google Scholar]
- 159.Pederson JS, Hamley IW. Analysis of neutron and x-ray reflectivity data I. Theory. Journal of Applied Crystollography. 1994;27:29–35. [Google Scholar]
- 160.Pederson JS, Hamley IW. Analysis of neutron and x-ray reflectivity data II. Constrained least squares methods. Journal of Applied Crystollography. 1994;27:36–49. [Google Scholar]
- 161.Wu G, Majewski J, Ege C, Kjaer K, Weygand M, Lee KYC. Interaction between lipid monolayers and poloxamer 199: An X-ray reflectivity and diffraction study. Biophys J. 2005;89:3159–3173. doi: 10.1529/biophysj.104.052290. [DOI] [PMC free article] [PubMed] [Google Scholar]
- 162.Kaganer VM, Mohwald H, Dutta P. Structure and phase transitions in Langmuir monolayers. Rev Mod Phys. 1999;71:779–819. [Google Scholar]
- 163.Perriman AW, Henderson MJ, Holt SA, White JW. Effect of the air-water interface on the stability of beta-lactoglobulin. J Phys Chem B. 2007;111:13527–13537. doi: 10.1021/jp074777r. [DOI] [PubMed] [Google Scholar]
- 164.Lu JR, Su TJ, Penfold J. Adsorption of serum albumin at the air/water interface. Langmuir. 1999;15:6975–6983. [Google Scholar]
- 165.McClellan SJ, Franses EI. Effect of concentration and denaturation on adsorption and surface tension of bovine serum albumin. Colloids and Surfaces B-Biointerfaces. 2003;28:63–75. [Google Scholar]
- 166.Fernsler JG, Zasadzinski JA. Competitive adsorption: a physical model for lung surfactant inactivation. Langmuir. 2009;25:8131–8143. doi: 10.1021/la8039434. [DOI] [PMC free article] [PubMed] [Google Scholar]
- 167.Zuo YY, Takayyon SM, Keaing E, Zhao L, Veldhuizen RA, Peterson NO, Amrein MW, Possmayer F. Atomic force microscopy studies of functional and dysfunctional pulmonary surfactant films, II. albumin-inhibited surfactant films and the effects of SP-A. Biophys J. 2008;95:2779–2791. doi: 10.1529/biophysj.108.130732. [DOI] [PMC free article] [PubMed] [Google Scholar]
- 168.Derjaguin BV, Landau L. Theory of the stability of strongly charged lyophobic sols and the adhesion of strongly charged particles in solutions of electrolytes. Acta Physicochim URSS. 1941;14:633–662. [Google Scholar]
- 169.Verwey EJW, Overbeek JTGz. Theory of the Stability of Lyophobic Colloids. Elsevier; Amsterdam: 1948. [Google Scholar]
- 170.Hunter RJ. Foundations of Colloid Science. Oxford University Press; Oxford: 1986. [Google Scholar]
- 171.Faraday M. Experimental relations of gold (and other metals) to light. Philosophical Transactions. 1857;147:145–181. [Google Scholar]
- 172.Tweney RD. Discovering discovery: How Faraday found the first metallic colloid. Perspectives on Science. 2006;14:97–121. [Google Scholar]
- 173.Zsigmondy RA. Nobel Lectures in Chemistry. Vol. 2. World Scientific; Singapore: 1999. Properties of Colloids. [Google Scholar]
- 174.Smoluchowski Mv. Versuch einer mathematischen Theorie def Koagulationkinetick Kollider Losungen. Z Phys Chem. 1917;92:129–168. [Google Scholar]
- 175.Fuchs N. Uber der stabilitat und aufladung der aerosole. Z Phys. 1934;89:736–743. [Google Scholar]
- 176.Cussler EL. Diffusion: Mass Transfer in Fluid Systems. 3. Cambridge University Press; Cambridge: 2009. [Google Scholar]
- 177.Reerinck H, Overbeek JTG. The rate of coagulation as a measure of hte stability of silver iodide sols. Disc Far Soc. 1954;18:74–84. [Google Scholar]
- 178.Mahanty J, Ninham BW. Dispersion Forces. Academic Press; New York: 1976. [Google Scholar]
- 179.Alig TF, Warriner HE, Lee L, Zasadzinski JA. Electrostatic barrier to recovery of dipalmitoylphosphatidylglycerol monolayers after collapse. Biophysical Journal. 2004;86:897–904. doi: 10.1016/S0006-3495(04)74165-X. [DOI] [PMC free article] [PubMed] [Google Scholar]
- 180.Hardy WB. A preliminary investigation of the conditions which determine the stability of irreversible hydrosols. Proc Roy Soc Lon. 1900;66:110–125. [Google Scholar]
- 181.Schulze H. Schwefelarsen im wasseroger Losung. J Prakt Chem. 1882;25:431–452. [Google Scholar]
- 182.Ashmore M, Hearn J. Flocculation of model latex particles by chitosans of varying degrees of acytlation. Lanmuir. 2000;16:4906–4911. [Google Scholar]
- 183.Ashmore M, Hearn J, Karpowicz F. Flocculation of latex particles of varying surface charge densities by chitosan. Langmuir. 2001;17:1069–1073. [Google Scholar]
- 184.Bouyer F, Robben A, Yu WL, Borkovec M. Aggregation of colloidal particles in the presence of oppositely charged polyelectrolytes: effect of surface charge heterogeneities. Langmuir. 2001;17:5225–5231. [Google Scholar]
- 185.Decher G. Toward layered polymeric multicomposites. Science. 1997;277:1232–1237. [Google Scholar]
- 186.Kleimann J, Gehin-Delval C, Auweter H, Borkovec M. Super-stoichiometric charge neutralization in particle-polyelectrolyte systems. Langmuir. 2005;21:3688–3698. doi: 10.1021/la046911u. [DOI] [PubMed] [Google Scholar]
- 187.Lowack K, Helm CA. Molecular mechanisms controlling the self-assembly process of polyelectrolyte multilayers. Macromolecules. 1998;31:823–833. [Google Scholar]
- 188.Kobayashi T, Ohta K, Tashiro K, Nishizuka K, Chen WM, Ohmura S, Yamamoto K. Dextran restores albumin-inhibited surface activity of pulmonary surfactant extract. Journal of Applied Physiology. 1999;86:1778–1784. doi: 10.1152/jappl.1999.86.6.1778. [DOI] [PubMed] [Google Scholar]
- 189.Lu KW, Robertson B, Taeusch HW. Dextran or polyethylene glycol added to Curosurf for treatment of meconium lung injury in rats. Biology of the Neonate. 2005;88:46–53. doi: 10.1159/000084458. [DOI] [PubMed] [Google Scholar]
- 190.Taeusch HW, Lu KW, Goerke J, Clements JA. Nonionic polymers reverse inactivation of surfactant by meconium and other substances. American Journal of Respiratory and Critical Care Medicine. 1999;159:1391–1395. doi: 10.1164/ajrccm.159.5.9808047. [DOI] [PubMed] [Google Scholar]
- 191.Lu JJ, Yu LMY, Cheung WWY, Goldthorpe IA, Zuo YY, Policova Z, Cox PN, Neumann AW. PEG enhances dynamic surface activity of a bovine lipid extract surfactant. Coll Surf B. 2005;41:145–151. doi: 10.1016/j.colsurfb.2004.11.012. [DOI] [PubMed] [Google Scholar]
- 192.Lu KW, Goerke J, Clements JA, Taeusch HW. Hyaluronan decreases surfactant inactivation in vitro. Pediatric Research. 2005;57:237–241. doi: 10.1203/01.PDR.0000150726.75308.22. [DOI] [PubMed] [Google Scholar]
- 193.Asakura S, Oosawa F. Interactions between particles suspended in solutions of macromolecules. J Polymer Science. 1958;33:183–192. [Google Scholar]
- 194.Kaplan PD, Rouke JL, Yodh AG, Pine DJ. Entropically Driven Surface Phase-Separation in Binary Colloidal Mixtures. Physical Review Letters. 1994;72:582–585. doi: 10.1103/PhysRevLett.72.582. [DOI] [PubMed] [Google Scholar]
- 195.Dinsmore AD, Wong DT, Nelson P, Yodh AG. Hard spheres in vesicles: curvature-induced forces and particle induced curvature. Phys Rev Lett. 1998;80:409–412. [Google Scholar]
- 196.Dinsmore AD, Yodh AG, Pine DJ. Entropic control of particle motion using passive surface microstructures. Nature. 1996;383:239–242. [Google Scholar]
- 197.Mondain-Monval O, Leal-Calderon F, Phillip J, Bibette J. Depletion forces in the presence of electrostatic double layer repulsion. Phys Rev Lett. 1995;75:3364–3367. doi: 10.1103/PhysRevLett.75.3364. [DOI] [PubMed] [Google Scholar]
- 198.Bickel T. Depletion forces near a soft interface. J Chemical Physics. 2003;118:8960–8968. [Google Scholar]
- 199.Gast AP, Hall CK, Russel WB. Polymer-induced phase separations in non-aqueous colloidal suspensions. J Coll Int Sci. 1983;96:251–267. [Google Scholar]
- 200.Bibette J, Roux D, Nallet F. Depletion interactions and fluid-solid equilibrium in emulsions. Phys Rev Lett. 1990;65:2470–2473. doi: 10.1103/PhysRevLett.65.2470. [DOI] [PubMed] [Google Scholar]
- 201.Lu KW, Perez-Gil J, Taeusch HW. Kinematic viscosity of therapeutic pulmonary surfactants with added polymers. Biochemica et Biophysica Acta. 2009;1788:632–637. doi: 10.1016/j.bbamem.2009.01.005. [DOI] [PMC free article] [PubMed] [Google Scholar]
- 202.Bhat R, Timasheff SN. Steric Exclusion Is the Principal Source of the Preferential Hydration of Proteins in the Presence of Polyethylene Glycols. Protein Science. 1992;1:1133–1143. doi: 10.1002/pro.5560010907. [DOI] [PMC free article] [PubMed] [Google Scholar]
- 203.Koontz SL, Peltier WJ, Pearson JE, Fabricant JD. Characterization of the pore-surface gel phase in functionalized macroporous polymeric materials. Colloid and Polymer Science. 1999;277:1065–1071. [Google Scholar]
- 204.Fuchs M, Schweizer KS. Structure and thermodynamics of colloid-polymer mixtures: A macromolecular approach. Europhysics Letters. 2000;51:621–627. [Google Scholar]
- 205.Fuchs M, Schweizer KS. Macromolecular theory of solvation and structure in mixtures of colloids and polymers. Physical Review E. 2001;6402 doi: 10.1103/PhysRevE.64.021514. [DOI] [PubMed] [Google Scholar]
- 206.Fuchs M, Schweizer KS. Structure of colloid-polymer suspensions. Journal of Physics-Condensed Matter. 2002;14:R239–R269. [Google Scholar]
- 207.Kuhl TL, Berman AD, Hui SW, Israelachvili JN. Direct measurement of depletion attraction and thin-film viscosity between lipid bilayers in aqueous polyethylene oxide solutions. Macromolecules. 1998;31:8250–8257. [Google Scholar]
- 208.Kuhl TY, Berman AD, Hui SW, Israelachvili JN. Cross-over from depletion attraction to adsorption: PEG induced electrostatic repulsion between lipid bilayers. Macromolecules. 1998;31:8258–8263. [Google Scholar]
- 209.Dehority W, Lu KW, Clements J, Goerke J, Pittet JF, Allen L, Taeusch HW. Polyethylene glycol-surfactant for lavage lung injury in rats. Pediatric Research. 2005;58:913–918. doi: 10.1203/01.PDR.0000182581.39561.01. [DOI] [PubMed] [Google Scholar]
- 210.Phang TL, McClellan SJ, Franses EI. Displacement of fibrinogen from the air/aqueous interface by dilauroylphosphatidyleholine lipid. Langmuir. 2005;21:10140–10147. doi: 10.1021/la0504412. [DOI] [PubMed] [Google Scholar]
- 211.Turino GM, Cantor JO. Hyaluronan in respiratory injury and repair. American Journal of Respiratory and Critical Care Medicine. 2003;167:1169–1175. doi: 10.1164/rccm.200205-449PP. [DOI] [PubMed] [Google Scholar]
- 212.Shimojoh M, Fukushima K, Kurita K. Low-molecular-weight chitosans derived from beta-chitin: preparation, molecular characteristics and aggregation activity. Carbohydrate Polymers. 1998;35:223–231. [Google Scholar]
- 213.Quemeneur F, Rinaudo M, Pepin-Donat B. Influence of molecular weight and pH on adsorption of chitosan at the surface of large and giant vesicles. Biomacromolecules. 2008;9:396–402. doi: 10.1021/bm700943j. [DOI] [PubMed] [Google Scholar]
- 214.Schmidt R, Markart P, Ruppert C, Wygrecka M, Kuchenbuch T, Walmrath D, Seeger W, Guenther A. Time-dependent changes in pulmonary surfactant function and composition in acute respiratory distress syndrome due to pneumonia or aspiration. Respiratory Research. 2007;8:55. doi: 10.1186/1465-9921-8-55. [DOI] [PMC free article] [PubMed] [Google Scholar]
- 215.Jensen TR, Kjaer K. Structural Properties and Interactions of Thin Films at the Air-Liquid Interfae Explored by Synchrotron X-ray Scattering. In: Miller DMaR., editor. Novel Methods to Study Interfacial Layers. Elsevier Science; Amsterdam: 2001. pp. 205–254. [Google Scholar]
- 216.Boyer C, Zasadzinski JA. Multiple lipid compartments slow vesicle contents release in lipases and serum. ACS Nano. 2007;1:176–182. doi: 10.1021/nn7002025. [DOI] [PMC free article] [PubMed] [Google Scholar]
Associated Data
This section collects any data citations, data availability statements, or supplementary materials included in this article.