Abstract
The knowledge of the biodistribution of macromolecular drug formulations is a key to their successful development for specific tissue- and tumor-targeting after systemic application. Based on the polyplex formulations, we introduce novel drug nanocarriers, which we denote as “quantoplexes” incorporating near-infrared (IR)-emitting cadmium telluride (CdTe) quantum dots (QDs), polyethylenimine (PEI), and a macromolecular model drug [plasmid DNA (pDNA)], and demonstrate the ability of tracking these bioactive compounds in living animals. Intravenous application of bare QD into nude mice leads to rapid accumulation in the liver and peripheral regions resembling lymph nodes, followed by clearance via the liver within hours to days. Quantoplexes rapidly accumulate in the lung, liver, and spleen and the fluorescent signal is detectable for at least a week. Tracking quantoplexes immediately after intravenous injection shows rapid redistribution from the lung to the liver within 5 minutes, depending on the PEI topology and quantoplex formulation used. With polyethyleneglycol (PEG)-modified quantoplexes, blood circulation and passive tumor accumulation was measured in real time. The use of quantoplexes will strongly accelerate the development of tissue and tumor-targeted macromolecular drug carriers.
Introduction
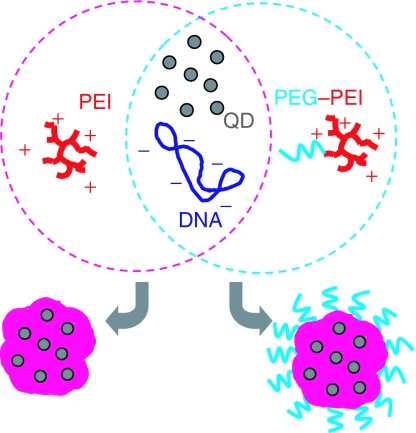
Biodistribution dynamics of drug carriers is a decisive factor for their specific effects on target tissue as well as for any undesired side effects.1,2 We introduce novel nanocarriers providing several advantages for dynamics studies of biodistribution, which we denote as “quantoplexes” in analogy to previously developed and meanwhile widely studied polyplex formulations.3,4 The quantoplexes are created by incorporating highly fluorescent cadmium telluride (CdTe) quantum dots (QDs) into virus-size nanocarriers containing polyethylenimine (PEI) and a plasmid DNA (pDNA) as a model drug (Figure 1). Generally speaking, quantoplexes are not limited to DNA carriers, but near-infrared (IR)-emitting QDs can be noncovalently or covalently attached to various types of self-assembling drug carriers, such as liposomes, micelles, and others, enabling their tracking in living tissue.
Figure 1.
Scheme for generation of quantoplexes. Plasmid DNA and negatively charged near-infrared-emitting CdTe QD are mixed in buffer solution, thereafter polycation (PEI) is added. PEI, plasmid DNA and negatively charged QDs interact electrostatistically forming ternary, virus-sized drug carriers termed quantoplexes (left). PEG-shielded quantoplexes are generated similarly but PEI is replaced with a PEG–PEI conjugate (right). PEG, polyethyleneglycol; PEI, polyethylenimine; QD, quantum dot.
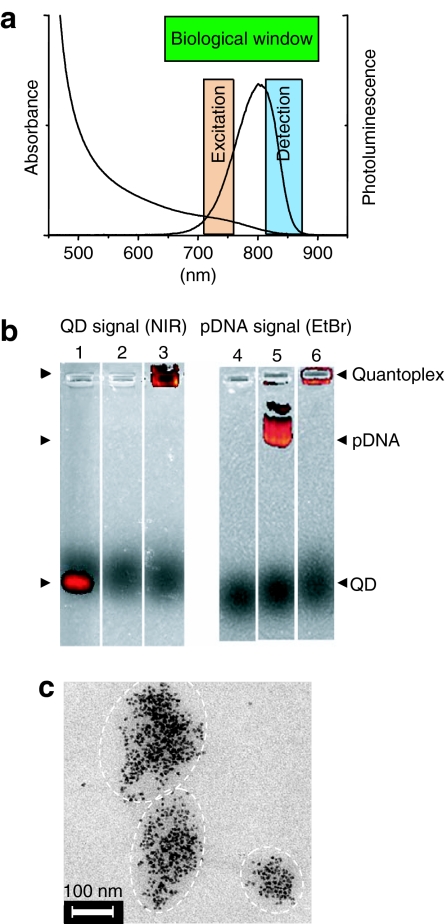
Quantifying pDNA from tissue extracts, e.g., by quantitative real-time PCR, Southern blotting technique, or use of radioactive labeling of DNA are well-established methods widely used in the field.5,6,7,8,9,10 However, they are time consuming and require the animals to be killed before analysis, which does not allow the biodistribution of particles to be followed over time in individual animals. Fluorescent imaging using e.g., cyanine dyes emitting in the near-IR allows for real-time measurements and analysis in living animals.7,11 Nevertheless, relatively high amounts of fluorescent labels are necessary to achieve a satisfying signal/noise ratio, which in turn can significantly influence the physical and chemical properties of the components and their biodistribution. The use of semiconductor QD as a superior fluorescent label for biomedical applications, including imaging, labeling, and sensing, has seen an explosive growth in recent years.12,13,14 QD emitting in the near-IR are especially promising for biomedical imaging in living tissues,15,16,17,18 for example in tumor imaging and therapy.19,20 As fluorescent probes, QDs have several advantages over conventional organic dyes including a narrow emission spectra tunable by size and/or composition of the QD throughout the visible spectral range up into the near-IR, and improved photostability. We have developed CdTe QDs directly synthesized in water and capped by short-chain thiols carrying different functional groups (carboxy-, amino-, etc.),21 which allow for their water solubility and bioconjugation.22 This kind of QD is small with a typical size of 2–8 nm and are available with emission in the near-IR21 coinciding with the biological window of transmission (Figure 2a), making them promising optical probes for biomedical imaging in living tissue. In this article, negatively charged QDs are incorporated into polyplex particles via electrostatic interactions, i.e., noncovalently. No modification of either DNA or polymer is needed. High-luminescence signal intensities of QDs enable visualization of rapid distribution events in real time.
Figure 2.
Quantoplexes: biophysical properties. (a) Absorption and emission spectra of 7 nm CdTe QDs, both falling within the biological window of tissue transparency. (b) Gel retardation assays of bare QDs (lanes 1 and 4), pDNA (lanes 2 and 5), and BPEI quantoplex N/P 6 (lanes 3 and 6). The various fluorescence signals are visualized in dark as follows: QD signal (810–875 nm emission), EtBr-free gel for lanes 1–3 and pDNA signal (575–650 nm emission from EtBr), EtBr-containing gel for lanes 4–6. (c) Representative TEM image of quantoplexes (BPEI, N/P 6) showing their size and shape. BPEI, branched polyethylenimine; pDNA, plasmid DNA; QD, quantum dot; TEM, transmission electron microscopy.
Results
CdTe QDs of 7 nm in size capped by mercaptopropionic acid emitting within the biological window of tissue transparency from 650 to 870 nm with a peak at 790 nm (Figure 2a) and a quantum yield at room temperature of 15% when excited at 710 nm were synthesized directly in water21 and used for binding to the polycation PEI by virtue of electrostatic interactions with negatively charged carboxyl groups of the mercaptopropionic acid ligand. Approximately 16 branched PEI (BPEI) macromolecules are required for neutralizing the charge of each QD (determined by titration with BPEI). When applied on an agarose gel, QDs exhibit a higher mobility in the electric field compared to pDNA (Figure 2b, lane 1 versus lane 5). Upon quantoplex formulation, neither free pDNA (lane 3) nor free QDs (lane 6) were found migrating in the electrical field. Lanes 2 and 4 are control experiments showing the absence of QD emission signal in pDNA, and vice versa. DNA/BPEI polyplexes [200 µg/ml DNA, N/P 6 (molar ratio nitrogen in BPEI to phosphate in pDNA)] without QDs are 150–180 nm in diameter and the similar quantoplexes incorporating QDs are only slightly larger (180–220 nm), as determined from dynamic light-scattering measurements. No influence of QD on the ζ-potential could be detected, having a value of +30 mV for both systems. The quantoplex shape on transmission electron microscopy (TEM) grids (Figure 2c shows a typical image) can be estimated as being quasi-spherical to ellipsoidal, with typical dimensions between 100 and 280 nm.
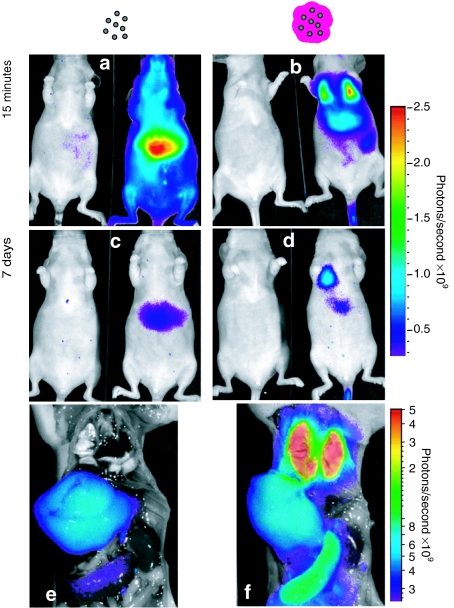
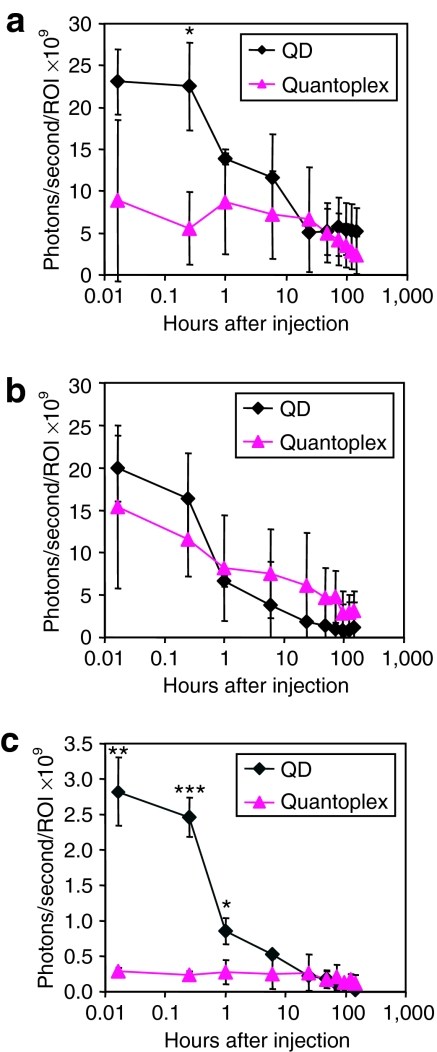
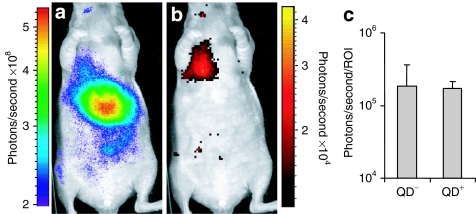
Bare QDs were injected intravenously into nu/nu mice and the fluorescence signal was measured 15 minutes after injection (Figure 3a). Vessel-like structures could be observed in the hind legs, and glowing patches aligned symmetrically in the abdominal and lower neck region indicate accumulation of QDs within lymph nodes. A completely different picture can be seen when applying quantoplexes consisting of pDNA, QD, and BPEI (Figure 3b): a strong signal appears in the lung, liver, and spleen, whereas the peripheral region including the lymph nodes does not show any significant fluorescence. Comparing quantoplex signals from different organs reveals relatively stable distribution profiles for at least several hours after injection. Even 7 days after intravenous application, there is still a considerable lung signal observed with quantoplexes, whereas a weak signal could be seen in the liver region with both QDs and quantoplexes (Figure 3c,d). To obtain an uncompromised look at the distribution of bare QDs and quantoplexes in different organs, animals were killed 7 days after injection and the abdomen and chest were opened. In the case of QDs injected into mice, no residual fluorescence could be detected in any organ except the liver and (to a very low extent) in the spleen (Figure 3e). On the contrary, quantoplexes showed a very strong signal in the lung, and a moderate (approximately tenfold lower) signal per surface area in the liver and spleen (Figure 3f). No signal was observed in the heart or kidneys. When measuring the fluorescence in mice treated either with bare QDs or quantoplexes over time, differences in their biodistribution kinetics were found. The fluorescent signal was quantified in three body regions: the liver, the lung/chest area, and the periphery (hind leg) (Supplementary Figure S1). In the liver region, QDs provided a twofold higher signal compared to the quantoplexes within the first hour after injection. At time points >1 hour, the signal decays and remains at ~20% of the initial intensity for at least 1 week (Figure 4a). In the chest area, a strong signal was observed both with bare QDs and quantoplexes, but with a different distribution pattern. At 15 minutes after injection of QDs, the signal was spread along the whole chest area, whereas, in case of quanoplexes, it was located in the defined sites corresponding to the lung lobes. Within the first hour after injection both the QD and the quantoplex signal decays by ~50% (Figure 4b). At later time points (1 day after injection), a further decay of the QD signal to near background levels was observed, whereas, with quantoplexes, this decay was much slower resulting in a stable signal between 20 and 30% of the initial value for at least 1 week. In the periphery, the signal decreases after ~1 hour when bare QD were applied, whereas no signal above background is measured with the quantoplexes at any time point (Figure 4c). To ensure that the QD label in quantoplexes does not negatively affect the biological activity of its payload (in this case, pDNA encoding for luciferase as transgene), luciferase activity was quantified in the lung area 6 hours after application of BPEI-based polyplexes or quantoplexes (Figure 5). Although, the main fluorescence signal was found in the liver area (and with a weaker signal in the lung area), luciferase activity was exclusively found in the lung area. When quantifying the luciferase activity in the lung area, no significant difference in activity could be found between polyplexes and quantoplexes.
Figure 3.
In vivo imaging of bare QDs and quantoplexes after systemic application. Nu/nu mice were injected with bare QDs (0.625 nmol/kg) or BPEI N/P 6 quantoplexes (2.5 mg/kg DNA, 0.625 nmol/kg QD) and the fluorescence was measured with the IVIS lumina. Fifteen minutes and 7 days after administration of (a,c) bare QDs or (b,d) quantoplexes mice were anesthetized and the fluorescence pattern analyzed. A reflected light image (black-white) is overlaid by the fluorescence signal (color), left animal in (a–d) is an untreated control. Mice injected with either (e) bare QDs or (f) quantoplexes were killed 7 days after application, the abdomen and chest were opened and organs exposed. A reflected light picture is overlaid with the fluorescence signal. The heart was removed before imaging. At least three animals were treated with bare QDs or quantoplexes. Representative animals are shown. BPEI, branched polyethylenimine; QD, quantum dot.
Figure 4.
Semiquantitative analysis of QDs and quantoplex signal over time. Animals are treated as described in Figure 3 with bare QDs or BPEI quantoplexes (N/P 6) and the fluorescence signal quantified within three different ROIs (a, abdominal/liver area; b, chest/lung area; c, hind leg; Supplementary Figure S1). Photons/second/ROI are given after deduction of background signal in control animals (n = 3 ± SD). *P < 0.05, **P < 0.01, ***P < 0.001; bare QDs versus quantoplexes, U-test (Mann–Whitney). BPEI, branched polyethylenimine; QD, quantum dot; ROI, regions of interest.
Figure 5.
Transfection capability of polyplexes and quantoplexes with luciferase encoding plasmid. Animals were injected intravenously with BPEI N/P 6 polyplexes or quantoplexes (final pDNA dose 2.5 mg/kg). Six hours after injection, animals received intraperitoneally 6 mg Na-luciferin in 100 µl PBS and were anesthetized 10 minutes thereafter. Subsequently, (a) near-IR fluorescence imaging and (b) BLI were carried out. (c) Quantification of the luciferase signal within in the lung (shown in b) from mice receiving either polyplexes (“QD–“) or quantoplexes (“QD+”) consisting of pCpG-LucSH and BPEI (N/P 10). The difference between “QD–“ and “QD+” is statistically not significant [n = 3; U-test (Mann–Whitney)]. BPEI, branched polyethylenimine; PBS, phosphate-buffered saline; pDNA, plasmid DNA; IR, infrared; QD, quantum dot.
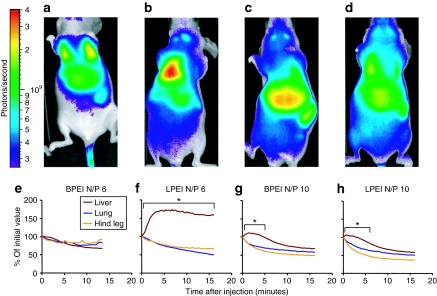
The short-time biodistributions' dynamics of four different quantoplex formulations are analyzed with linear PEI (LPEI) or BPEI at an N/P ratio of 6 and 10 (Figure 6). The imaging starts with a 20–40 seconds delay after intravenous injection with images taken every 15 seconds for up to 30 minutes. For both quantoplex types at N/P 6 immediately after injection, the strongest fluorescence was seen in the lung followed by the liver and the spleen (Figure 6a,b). With BPEI, for all three regions of interest (ROI) examined, a slow but continuous decrease in signal intensity occurs down to ~80% of the initial value after 15 minutes (Figure 6e). In the case of LPEI quantoplexes, immediately after injection, a fast decay of lung fluorescence occurred with a concomitant increase of the signal in the liver region (Figure 6f and Supplementary Video S1). On average, the signal in liver rapidly increases within the first 5 minutes to 170% of the initial value. Thereafter, a slight but constant decrease was measured. At an N/P 10, both LPEI and BPEI quantoplexes behave rather similar in terms of their initial biodistribution immediately after injection with highest signals found in the liver (Figure 6c,d) and also in terms of pharmacokinetic (Figure 6g,h): there is still a significant decrease in the lung signal (50–60% of the initial value after 15 minutes). The fluorescence levels in the liver region increased for ~5 minutes after injection and decreased thereafter, reaching 60–70% of the initial value. Importantly, the redistribution occurs only during a relatively short period of time (30 minutes); later on, the distribution profile stabilizes and the fluorescence from different organs decays slowly over time. As a control, the short-term distribution of bare QDs is analyzed: no redistribution was observed between the first time point measured and 30 minutes after injection (Supplementary Video S2).
Figure 6.
Short-term pharmacokinetic of BPEI and LPEI quantoplexes. Nu/nu mice were anesthetized with isofluorane and injected with the indicated quantoplexes (a and e: BPEI N/P 6; b and f: LPEI N/P 6; c and g: BPEI N/P 10; d and h: LPEI N/P 10) at a dose of 2.5 mg/kg DNA (0.625 nmol/kg QD). Immediately after injection, mice were transferred to the imaging chamber and fluorescence pictures taken every 15 seconds for ~15 minutes. (a–d) Animals receiving the indicated quantoplexes are shown (fluorescence signal and reflected light pictures overlay) for representative animals 20–40 seconds after intravenous injection. (e–h) Animals received the quantoplexes as indicated for panels a–d. ROI's are defined within the specified areas, background corrected signals (photons/second/ROI) are normalized to the initial value of the first fluorescence picture taken (see a–d); n = 3, no SD shown for reasons of clarity. *P < 0.05, **P < 0.01, ***P < 0.001; lung ROI versus liver ROI at individual time points, U-test (Mann–Whitney). BPEI, branched polyethylenimine; LPEI, linear polyethylenimine; ROI, regions of interest.
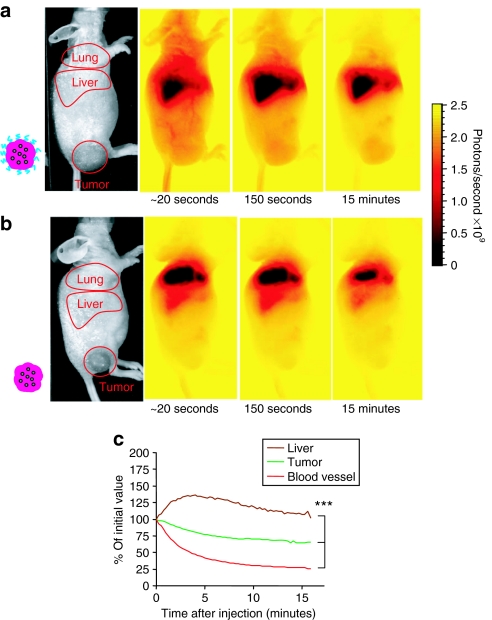
Quantoplexes bearing a net neutral surface charge were generated by shielding them with 20-kd polyethyleneglycol (PEG) (Figure 1) and intravenously injected into nu/nu mice bearing a subcutaneous Neuro2A tumor in the flank (Figure 7a and Supplementary Video S3). Immediately after injection, a strong fluorescence signal was detected in the liver and a low, but measurable signal in the tumor area. Blood vessel structures were clearly visible. Whereas, the signal in the blood vessels rapidly disappears, the fluorescence in the liver increases indicating clearance from the blood stream. In contrast to the rapid blood clearance, a clear tumor signal is still present after 15 minutes. In sharp contrast, no fluorescent blood vessel-like structures were observed already 30 seconds after injection of BPEI quantoplexes (Figure 7b and Supplementary Video S4). The main fluorescence signal was found in the lung area and a lower signal in the liver. No measurable accumulation was observed in the tumor. A semiquantitative analysis comparing signals from ROIs placed on the liver area, tumor area, and a superficial blood vessel showed a statistically significant difference in either clearance or accumulation of PEG-BPEI quantoplex signal between tumor, blood vessel, and liver (Figure 7c). No such analysis could be carried out on BPEI quantoplexes due to the low signal intensities in the blood vessels and tumor area.
Figure 7.
Short-term pharmacokinetic of quantoplexes in tumor-bearing mice. Nu/nu mice bearing subcutaneous N2A tumors were anesthetized with isofluorane and injected with the indicated quantoplexes (a,c: PEG-BPEI, b: BPEI) at a dose of 2.5 mg/kg DNA (0.625 nmol/kg QD). Immediately after injection, mice were transferred to the imaging chamber and fluorescence pictures taken every 15 seconds for 15 minutes. A reflected light image (left) and fluorescence images (right) taken at the indicated time points after quantoplex injection to the tumor-bearing mice are shown for representative animals. c: ROI's (liver, tumor, blood vessel) were defined in mice treated with PEG-BPEI quantoplexes and the relative signal after background subtraction normalized to the initial value is shown over time. n = 3; *P < 0.05 (analysis of variance, Duncan test, liver versus tumor versus blood vessel signal, all time points between 30 seconds after start of measurement until the last time point measured). BPEI, branched polyethylenimine; PEG, polyethyleneglycol.
Discussion
Negatively charged CdTe QDs bind to a fraction of PEI in polyplexes by electrostatic interaction. This fraction corresponds to only a few percent of the total BPEI in the typical DNA formulations (8%—for formulations at N/P ratio of 6; 3%—for formulations at N/P ratio of 10). Agarose gel electrophoresis carried out on quantoplexes indicates complete incorporation of both pDNA and QDs into quantoplexes at N/P 6, as neither free pDNA nor QDs were observed. Only a negligible influence of QDs on the condensation of DNA into quantoplexes was found when measuring displacement of ethidium bromide (EtBr) intercalation with pDNA.23 Importantly, the binding of PEI to QD does not lead to fluorescence quenching of the latter even at PEI/QD molar ratio of 1,000/1. TEM studies of quantoplexes directly confirm their “raisin bun”-like structure with QDs being randomly distributed in the mass of organic molecules.
For systemic application in mice, a dose of only 0.625 nmol/kg of QDs (400 times lower than with conventional near-IR organic dyes evaluated7) were sufficient to acquire a strong signal. Fluorescence was observed mainly in the liver, whereas lower, but significant signals were also measured all over the body. Accumulation in lymph nodes is in line with data obtained from intratumorally injected QDs, where a migration to the lymph nodes was observed.24 It was previously shown that negatively charged QDs are opsonized with serum proteins and rapidly eliminated from the blood stream.25 In certain cases, we also observed the skeletal structure within the pelvic- and thigh bones indicating uptake by bone marrow macrophages (data not shown). When applying BPEI quantoplexes, their rapid accumulation in the lung and liver resembles the distribution pattern of positively charged polyplexes when quantifying pDNA in the respective organs.26 As the distribution pattern does not change for at least several hours, this suggests a highly stable interaction between QDs and BPEI and a low degree of dissociation (see also Figure 4). Quantifying whole-body fluorescence of QDs and quantoplex treated animals 15 minutes after injection, the total signal for QDs is ~2.5-fold higher compared to the quantoplex signal. We explain this effect by the differences in biodistribution. The bare QDs are found all over the body including superficial blood and lymph vessels, whereas with the signals from the quantoplexes are found in the lung and liver. Here, the signal can be decreased due to quenching effects. Long-time experiments show a slow decrease in fluorescence signal both with bare QDs and quantoplexes (Figure 4), due to, at least in part, to their excretion.25 QD excretion via the liver and intestine is partially responsible for signal reduction, as we observed specific QD fluorescence in the feces of animals several hours after injection.
Measuring the short-time distribution pattern clearly reveals that even changes in quantoplex biodistribution on the second timescale can be followed, which is normally not possible in case of invasive methods. A clear difference in the pharmacokinetic between BPEI and LPEI quantoplexes can be found. For BPEI quantoplexes, the distribution pattern remains rather static with a high lung/liver ratio. In strong contrast, LPEI quantoplexes at N/P 6 exhibit a highly dynamic biodistribution pattern with rapid redistribution from the lung to the liver shortly after injection. Intravenously injected LPEI polyplexes that did not contain QDs bear highly positive ζ-potential, aggregated with blood platelets and were entrapped in the lung endothelium.27 We postulate that similar aggregates form at early times between blood platelets and LPEI quantoplexes, and are then partially dissolved allowing quantoplexes to be transported from the lung to the liver site. Similar observations were made with nonviral gene delivery particles containing polycations and lipids, where initial erythrocyte-particle aggregates were partially dissolved, causing their further circulation and final entrapment in the liver 1–2 hours after injection.28 BPEI quantoplexes showed no signs of redistribution suggesting that they either are able to form more stable aggregates with blood platelets or alternatively directly stick to the lung endothelium. The changed redistribution pattern of both LPEI and BPEI quantoplexes at elevated N/P ratios seems to be related to the increased amount of free, not quantoplex associated PEI. Both BPEI and LPEI polyplexes at N/P ratios >3 contain significant amounts of free PEI not bound to DNA (>50% at N/P 6 and >75% at N/P 12) (ref. 29). A larger excess of free PEI apparently reduces the initial retention of quantoplexes in the lung for both LPEI and BPEI (Figure 6c,d). Free PEI competes with quantoplexes in binding to the cellular fraction in the blood and lung tissue. It is important to note that all quantoplex formulations (with BPEI or LPEI, N/P 6 or N/P 10) are rather similar in terms of size (determined by laser light scattering) and surface charge (ζ-potential). The average particle size is ~200 nm in diameter with a surface charge of +30 mV. The differences in biodistribution dynamics are apparently due to other in vivo relevant parameters, such as the strength of interaction between quantoplexes and the biological environment (blood proteins, cells, tissues) and the in vivo stability of the vector. Bare QD injected as a control did not exhibit any rapid redistribution. This can be explained by the rapid opsonization of the negatively charged QDs preventing them from circulating in the blood stream,25 and potentially by their adhesion to vesicular structures.
Surface shielding of polyplexes with PEG reduces blood interactions like erythrocyte aggregation and plasma protein binding and, in case of high molecular weight PEI, enables some circulation of such particles in the blood stream.8 Also with PEGylated quantoplexes, we observed a short circulation time in the range of several minutes, whereas unshielded BPEI polyplexes showed no circulation at all. Rather, blood vessel-like structures appeared “negatively stained” within the lung and liver areas. A similarly short circulation time has been reported by Merdan and colleagues for polyplexes based on 25-kd BPEI with or without PEGylation, but no differences between these two formulations were observed.9 With the novel technique, we introduced in this article, we can distinguish differences between these two formulations. Apparently, the charge-neutral PEGylated quantoplexes, in contrast to the positively charged quantoplexes do circulate for several minutes and accumulate in the tumor almost immediately after injection.
In summary, the use of quantoplexes made by incorporation of near-IR emitting CdTe QDs into polyplex formulations represents an advanced labeling procedure for macromolecular drugs allowing effective screening of even very early and rapid biodistribution events. Different tissue- and tumor-targeting strategies as well as blood circulation of novel macromolecular drug formulations can easily be evaluated using this method. Near-infrared-emitting QDs incorporated into quantoplexes promise to greatly assist in the development and improvement of new formulations.
Materials and Methods
Materials. Near-IR-emitting CdTe QDs (emission peak at 790 nm) were synthesized directly in water with mercaptopropionic acid as a capping ligand and purified by precipitation with methanol. They were redissolved in water again to a concentration of 1 µmol/l and used as an aqueous stock solution. We refer the interested reader to ref. 21 for the complete description of the synthetic procedure and the optical properties of this kind of QD. The plasmid pCMV-Luc enclosing luciferase under the control of a cytomegalovirus promoter30 was produced and purified by PlasmidFactory (Bielefeld, Germany). The plasmid pCpG-LucSH was generated as follows: the CpG-free LucSh fusion gene (luciferase fused to the Sh ble gene) obtained from the plasmid pMOD-LucSh (Cayla – InvivoGen Europe, Toulouse, France) by digestion with BglII and NheI was cloned into the multiple cloning site of pCpG-mcs (Cayla – InvivoGen Europe) carrying the human elongation factor-1α promoter. pCpG-LucSh was propagated in Escherichia coli GT115 (Cayla – InvivoGen Europe) under Zeocin selection pressure and purified by PlasmidFactory in “ccc” grade (covalently closed circular).17 BPEI with an average molecular weight of 25 kd was obtained from Sigma-Aldrich (Munich, Germany) and neutralized with HCl to pH 7.1 before use; LPEI was synthesized as reported31 and is commercially available from Polyplus (Strassbourg, France; www.polyplus-transfection.fr). PEI solutions are used as a 1 mg/ml stock; PEG-BPEI (20-kd PEG, PEG/BPEI 1.9/1 M/M) is synthesized as described.32 All other chemicals were purchased from Sigma-Aldrich.
Preparation of quantoplexes. QD stock solutions (15.6 µl, 1 µmol/l) were mixed with 0.25 ml of plasmid solution (400 µg/ml) in HEPES-buffered glucose (HBG; 20 mmol/l HEPES pH 7.1, 5% glucose wt./vol.). Quantoplexes were made by flash mixing of DNA/QD solution with 0.25 ml of PEI in HBG (320 µg/ml for N/P 6, 520 µg/ml for N/P 10). For generating PEG-shielded BPEI quantoplexes, PEG-BPEI was used instead of BPEI.
Emission quantum yield of bare CdTe QD and QD in quantoplexes. The room temperature emission quantum yield of CdTe QDs (15%) was determined by comparison with a reference solution of Alexa Fluor 750 dye under excitation and detection conditions similar to the IVIS Lumina Imaging System (Caliper Life Sciences, Rüsselheim, Germany) used in this work (excitation range 710–760 nm, detection range 810–875 nm). The emission intensity of CdTe QDs included into quantoplexes in HBG buffer decreases only by 10% in comparison to the value of bare CdTe QDs. Neither absorption nor emission spectra changes.
Size and ζ-potential measurements. Size and ζ-potential measurements were performed on a NanoZS instrument (Malvern Instruments, Worcestershire, UK). Typically, 50 µl of the polyplex or quantoplex solution were diluted in 1,000 µl of HBG for the measurements.
Titration of CdTe QD with BPEI. A QD solution (0.015 µmol/l) and a series of BPEI solutions (1–10 µg/ml BPEI) were prepared in HBG buffer. Equal volumes (0.5 ml) of QD solution and BPEI were mixed together and the ζ-potential determined as described above. The resulting ζ-potential is plotted versus BPEI/QD ratio. The ratio, where the ζ-potential changes from a negative to a positive value corresponds to the point of full neutralization of negative charges on QDs. The value obtained corresponds to ~16 BPEI molecules per QD. At least two independent experiments were carried out.
EtBr displacement assay. The influence of QDs on the ability of PEI to condense DNA was studied using an EtBr assay. PEI solution was added stepwise to a pDNA solution (10 µg/ml) or a mixture of DNA with QD in HBG containing EtBr (0.4 µg/ml). After each step, fluorescence intensity was monitored (λex = 510 nm, λem = 590 nm). The fluorescence intensity of the EtBr solution in the presence of free DNA was normalized to 100%.
Gel retardation assay. QDs (2 pmol), pDNA (5 µg), or BPEI N/P 6 quantoplexes (containing 2 pmol QDs and 5 µg pDNA) were mixed with loading buffer and loaded onto a 1% agarose gel containing 500 ng/ml EtBr (for pDNA imaging) or without EtBr (for QD imaging). Electrophoresis was performed at a voltage of 80 mV for 60 minutes. Fluorescence images of gels were obtained on an IVIS Lumina Imaging System (Caliper Life Sciences) by illumination with a halogen lamp using an appropriate filter combination for QD imaging (excitation filter 710–760 nm, emission filter 810–875 nm) or pDNA/EtBr imaging (excitation filter 500–550 nm, emission filter 575–650 nm) and 2-seconds exposure time. Reflected light images are taken during illumination with four white light-emitting diodes. Image acquisition and processing was carried out using Living Image 2.60.1—IGOR Pro 4.09 software (Caliper Life Sciences GmbH, Rüsselheim, Germany).
Transmission electron microscopy. TEM images were recorded on a JEOL JEM-1011 electron microscope (Jeol, Tokyo, Japan) at an accelerating voltage of 100 kV. Samples for the TEM were prepared by dropping diluted solutions of quantoplexes on carbon-coated copper grids and removing excess water with filter paper after 30 seconds.
Mice and the mouse tumor model. Nude mice (Rj: NMRI-nu, 4-week-old female) were purchased from Janvier (Le Genest-Saint-Isle, France). Tumor-free mice were used for imaging studies after 1 week of acclimatization at an age of 5 weeks. For tumor-targeting studies, murine neuroblastoma Neuro2A cells (ATCC CCl-131) grown in Dulbecco's modified Eagle's medium supplemented with 10% fetal bovine serum were harvested by trypsinization when reaching ~70% confluence and washed with phosphate-buffered saline to remove residual serum. For tumor inoculation 1 × 10⁶ Neuro2A cells in 100 µl phosphate-buffered saline were injected subcutaneously into the flank of 5–6-weeks old mice. Treatment starts after tumors reach a diameter of 7 mm. All animal procedures are approved and controlled by the local ethics committee and carried out in accordance with the guidelines of the German law for protection of animal life.
In vivo imaging studies, near-IR fluorescence. Mice were placed into a restrainer and injected with bare QDs (0.625 nmol/kg) or quantoplexes (2.5 mg/kg based on pDNA) via the lateral tail vein. At indicated time points after injection mice were anesthetized with 2.5 % isofluorane in oxygen, transferred to an IVIS Lumina Imaging System (Caliper Life Sciences) and the data collection started (image settings: field of view B, small binning). An untreated mouse was always measured at the same time to determine the background value (see “Image analysis and processing”). During the imaging process, mice were kept under anesthesia. Fluorescence images were obtained by illumination with a halogen lamp using an appropriate filter combination (excitation filter 710–760 nm, emission filter 810–875 nm) and 1-second exposure time. Reflected light pictures were taken during illumination with four white light-emitting diode. Image acquisition and processing is carried out using Living Image 2.60.1—IGOR Pro 4.09 software. For continuous fluorescence measurements starting immediately after injection, quantoplexes were intravenously injected into the lateral tail vein of isofluorane anesthetized mice, which were transferred into the imaging unit immediately thereafter, and fluorescent images collected every 15 or 30 seconds for up to 30 minutes.
In vivo imaging studies, bioluminescence imaging. Mice were anesthetized and polyplexes and quantoplexes generated with plasmid pCpG-LucSh and BPEI (N/P 10), respectively, were intravenously injected and fluorescence measured as described above. For bioluminescence imaging, 6 hours after polyplex or quantoplex injection Na-luciferin (Promega, Hilden, Germany; 6 mg in 100 µl sterile phosphate-buffered saline) was injected intraperitoneally. Ten minutes, thereafter mice were anesthetized and bioluminescence imaging carried out for 3 minutes (settings: stage B, large binning). Photons per second per ROI were calculated after background deduction from nontransfected areas.
Image analysis and processing. For quantitative analysis of fluorescence, ROI were defined and background fluorescence deducted from simultaneously measured control mice with a similar-sized background ROI in the similar body region. The total signal per ROI was calculated as photons/second/area.
Generation of video sequences was carried out by loading fluorescence images of all time points acquired with the Living Image software in “.tiff” format into Image J software version 1.40g (downloadable from rsb.info.nih.gov/ij/; National Institutes of Health, Rockville Pike Bethesda, MD). Image stacks were generated and, after automatic brightness and contrast adjustment, converted to “.mov” files [frame rate: 3.5 frames per second (Supplementary Video S2) or 7 frames per second (all other videos), compression: MPEG4, quality: maximum].
SUPPLEMENTARY MATERIALSupplementary Figure S1. Positions of ROI's in QD and quantoplex treated animals. Values obtained from background ROI's on untreated animals (left) are deducted from values measured in corresponding, similarly sized ROI's in treated animals (right).Supplementary Video S1. LPEI quantoplex dynamics after i.v. injection. Nude mice receiving LPEI quantoplexes N/P 6 (right animal) or no injection (left animal) were imaged as described in Methods with images taken every 15 seconds lasting for 30 min.Supplementary Video S2. QD dynamics after i.v. injection. Nude mice receiving 0.625 nmol/kg QD (right animal) or no injection (left animal) were imaged as described in Methods with images taken every 30 seconds lasting for 15 min.Supplementary Video S3. Biodistribution of PEGylated quantoplexes in tumor-bearing animals. Nude mice receiving PEG-BPEI quantoplexes N/P 6 (right animal) or no injection (left animal) were imaged as described in Methods with images taken every 15 seconds lasting for 15 min.Supplementary Video S4. Biodistribution of BPEI quantoplex in tumor-bearing animals. Nude mice receiving BPEI quantoplexes N/P 6 (right animal) or no injection (left animal) were imaged as described in Methods with images taken every 15 seconds lasting for 15 min.
Supplementary Material
Positions of ROI's in QD and quantoplex treated animals. Values obtained from background ROI's on untreated animals (left) are deducted from values measured in corresponding, similarly sized ROI's in treated animals (right).
LPEI quantoplex dynamics after i.v. injection. Nude mice receiving LPEI quantoplexes N/P 6 (right animal) or no injection (left animal) were imaged as described in Methods with images taken every 15 seconds lasting for 30 min.
QD dynamics after i.v. injection. Nude mice receiving 0.625 nmol/kg QD (right animal) or no injection (left animal) were imaged as described in Methods with images taken every 30 seconds lasting for 15 min.
Biodistribution of PEGylated quantoplexes in tumor-bearing animals. Nude mice receiving PEG-BPEI quantoplexes N/P 6 (right animal) or no injection (left animal) were imaged as described in Methods with images taken every 15 seconds lasting for 15 min.
Biodistribution of BPEI quantoplex in tumor-bearing animals. Nude mice receiving BPEI quantoplexes N/P 6 (right animal) or no injection (left animal) were imaged as described in Methods with images taken every 15 seconds lasting for 15 min.
Acknowledgments
This work was supported by the EC funded project GIANT, the DFG SFB486 and SPP1230, the DFG Excellence Cluster “Nanosystems Initiative Munich” (NIM) and the LMUexcellent program. Melinda Kiss is gratefully acknowledged for cloning of plasmid pCpG-LucSh. We thank Dr Martin Schleef from PlasmidFactory for providing pCpG-LucSh in “ccc” quality. Prof Don C. Lamb is greatly acknowledged for careful review of the manuscript.
REFERENCES
- Medarova Z, Pham W, Farrar C, Petkova V., and , Moore A. In vivo imaging of siRNA delivery and silencing in tumors. Nat Med. 2007;13:372–377. doi: 10.1038/nm1486. [DOI] [PubMed] [Google Scholar]
- Bartlett DW, Su H, Hildebrandt IJ, Weber WA., and , Davis ME. Impact of tumor-specific targeting on the biodistribution and efficacy of siRNA nanoparticles measured by multimodality in vivo imaging. Proc Natl Acad Sci USA. 2007;104:15549–15554. doi: 10.1073/pnas.0707461104. [DOI] [PMC free article] [PubMed] [Google Scholar]
- Duncan R. The dawning era of polymer therapeutics. Nat Rev Drug Discov. 2003;2:347–360. doi: 10.1038/nrd1088. [DOI] [PubMed] [Google Scholar]
- Schaffert D., and , Wagner E. Gene therapy progress and prospects: synthetic polymer-based systems. Gene Ther. 2008;15:1131–1138. doi: 10.1038/gt.2008.105. [DOI] [PubMed] [Google Scholar]
- Zhang Y, Bradshaw-Pierce EL, Delille A, Gustafson DL., and , Anchordoquy TJ. In vivo comparative study of lipid/DNA complexes with different in vitro serum stability: effects on biodistribution and tumor accumulation. J Pharm Sci. 2008;97:237–250. doi: 10.1002/jps.21076. [DOI] [PubMed] [Google Scholar]
- Hackett NR, El Sawy T, Lee LY, Silva I, O'Leary J, Rosengart TK, et al. Use of quantitative TaqMan real-time PCR to track the time-dependent distribution of gene transfer vectors in vivo. Mol Ther. 2000;2:649–656. doi: 10.1006/mthe.2000.0203. [DOI] [PubMed] [Google Scholar]
- Schwerdt A, Zintchenko A, Concia M, Roesen N, Fisher KD, Lindner LH, et al. Hyperthermia induced targeting of thermosensitive gene carriers to tumors. Hum Gene Ther. 2008;19:1283–1292. doi: 10.1089/hum.2008.064. [DOI] [PubMed] [Google Scholar]
- Ogris M, Brunner S, Schüller S, Kircheis R., and , Wagner E. PEGylated DNA/transferrin-PEI complexes: reduced interaction with blood components, extended circulation in blood and potential for systemic gene delivery. Gene Ther. 1999;6:595–605. doi: 10.1038/sj.gt.3300900. [DOI] [PubMed] [Google Scholar]
- Merdan T, Kunath K, Petersen H, Bakowsky U, Voigt KH, Kopecek J, et al. PEGylation of poly(ethylene imine) affects stability of complexes with plasmid DNA under in vivo conditions in a dose-dependent manner after intravenous injection into mice. Bioconjug Chem. 2005;16:785–792. doi: 10.1021/bc049743q. [DOI] [PubMed] [Google Scholar]
- Oupicky D, Ogris M, Howard KA, Dash PR, Ulbrich K., and , Seymour LW. Importance of lateral and steric stabilization of polyelectrolyte gene delivery vectors for extended systemic circulation. Mol Ther. 2002;5:463–472. doi: 10.1006/mthe.2002.0568. [DOI] [PubMed] [Google Scholar]
- Masotti A, Vicennati P, Boschi F, Calderan L, Sbarbati A., and , Ortaggi G. A novel near-infrared indocyanine dye-polyethylenimine conjugate allows DNA delivery imaging in vivo. Bioconjug Chem. 2008;19:983–987. doi: 10.1021/bc700356f. [DOI] [PubMed] [Google Scholar]
- Alivisatos P. The use of nanocrystals in biological detection. Nat Biotechnol. 2004;22:47–52. doi: 10.1038/nbt927. [DOI] [PubMed] [Google Scholar]
- Medintz IL, Uyeda HT, Goldman ER., and , Mattoussi H. Quantum dot bioconjugates for imaging, labelling and sensing. Nat Mater. 2005;4:435–446. doi: 10.1038/nmat1390. [DOI] [PubMed] [Google Scholar]
- Nabiev I, Mitchell S, Davies A, Williams Y, Kelleher D, Moore R, et al. Nonfunctionalized nanocrystals can exploit a cell's active transport machinery delivering them to specific nuclear and cytoplasmic compartments. Nano Lett. 2007;7:3452–3461. doi: 10.1021/nl0719832. [DOI] [PubMed] [Google Scholar]
- Sandros MG, Behrendt M, Maysinger D., and , Tabrizian M. InGaP@ZnS-Enriched chitosan nanoparticles: A versatile fluorescent probe for deep-tissue imaging. Adv Funct Mater. 2007;17:3724–3730. [Google Scholar]
- Kim S, Lim YT, Soltesz EG, De Grand AM, Lee J, Nakayama A, et al. Near-infrared fluorescent type II quantum dots for sentinel lymph node mapping. Nat Biotechnol. 2004;22:93–97. doi: 10.1038/nbt920. [DOI] [PMC free article] [PubMed] [Google Scholar]
- Schleef M., and , Schmidt T.2004Animal-free production of ccc-supercoiled plasmids for research and clinical applications J Gene Med 6suppl. 1): S45–S53. [DOI] [PubMed] [Google Scholar]
- Yong KT, Roy I, Ding H, Bergey EJ., and , Prasad PN.2009Biocompatible near-infrared quantum dots as ultrasensitive probes for long-term in vivo imaging applications Smallepub ahead of print). [DOI] [PubMed]
- Qian X, Peng XH, Ansari DO, Yin-Goen Q, Chen GZ, Shin DM, et al. In vivo tumor targeting and spectroscopic detection with surface-enhanced Raman nanoparticle tags. Nat Biotechnol. 2008;26:83–90. doi: 10.1038/nbt1377. [DOI] [PubMed] [Google Scholar]
- Cai W., and , Chen X. Preparation of peptide-conjugated quantum dots for tumor vasculature-targeted imaging. Nat Protoc. 2008;3:89–96. doi: 10.1038/nprot.2007.478. [DOI] [PubMed] [Google Scholar]
- Rogach AL, Franzl T, Klar TA, Feldmann J, Gaponik N, Lesnyak V. Aqueous synthesis of thiol-capped CdTe nanocrystals: state-of-the-art. J Phys Chem C. 2007;111:14628–14637. [Google Scholar]
- Mamedova NN, Kotov NA, Rogach AL., and , Studer J. Albumin-CdTe nanoparticle bioconjugates: preparation, structure, and interunit energy transfer with antenna effect. Nano Lett. 2001;1:281–286. [Google Scholar]
- Parker AL, Oupicky D, Dash PR., and , Seymour LW. Methodologies for monitoring nanoparticle formation by self-assembly of DNA with poly(L-lysine) Anal Biochem. 2002;302:75–80. doi: 10.1006/abio.2001.5507. [DOI] [PubMed] [Google Scholar]
- Ballou B, Ernst LA, Andreko S, Harper T, Fitzpatrick JA, Waggoner AS, et al. Sentinel lymph node imaging using quantum dots in mouse tumor models. Bioconjug Chem. 2007;18:389–396. doi: 10.1021/bc060261j. [DOI] [PubMed] [Google Scholar]
- Choi HS, Liu W, Misra P, Tanaka E, Zimmer JP, Itty Ipe B, et al. Renal clearance of quantum dots. Nat Biotechnol. 2007;25:1165–1170. doi: 10.1038/nbt1340. [DOI] [PMC free article] [PubMed] [Google Scholar]
- Jeong GJ, Byun HM, Kim JM, Yoon H, Choi HG, Kim WK, et al. Biodistribution and tissue expression kinetics of plasmid DNA complexed with polyethylenimines of different molecular weight and structure. J Control Release. 2007;118:118–125. doi: 10.1016/j.jconrel.2006.12.009. [DOI] [PubMed] [Google Scholar]
- Chollet P, Favrot MC, Hurbin A., and , Coll JL. Side-effects of a systemic injection of linear polyethylenimine-DNA complexes. J Gene Med. 2002;4:84–91. doi: 10.1002/jgm.237. [DOI] [PubMed] [Google Scholar]
- Ma Z, Zhang J, Alber S, Dileo J, Negishi Y, Stolz D, et al. Lipid-mediated delivery of oligonucleotide to pulmonary endothelium. Am J Respir Cell Mol Biol. 2002;27:151–159. doi: 10.1165/ajrcmb.27.2.4653. [DOI] [PubMed] [Google Scholar]
- Boeckle S, von Gersdorff K, van der Piepen S, Culmsee C, Wagner E., and , Ogris M. Purification of polyethylenimine polyplexes highlights the role of free polycations in gene transfer. J Gene Med. 2004;6:1102–1111. doi: 10.1002/jgm.598. [DOI] [PubMed] [Google Scholar]
- Plank C, Zatloukal K, Cotten M, Mechtler K., and , Wagner E. Gene transfer into hepatocytes using asialoglycoprotein receptor mediated endocytosis of DNA complexed with an artificial tetra-antennary galactose ligand. Bioconjug Chem. 1992;3:533–539. doi: 10.1021/bc00018a012. [DOI] [PubMed] [Google Scholar]
- Ogris M., and , Wagner E. Cold Spring Harbor Laboratory Press: Cold Spring Harbor, New York, pp. 521–526; 2008. Linear polyethylenimine: synthesis and transfection procedures for in vitro and in vivo. In: Friedmann, T and Rossi, J (eds). Gene Transfer: Delivery and Expression of DNA and RNA, A Laboratory Manual. [Google Scholar]
- Kursa M, Walker GF, Roessler V, Ogris M, Roedl W, Kircheis R, et al. Novel shielded transferrin-polyethylene glycol-polyethylenimine/DNA complexes for systemic tumor-targeted gene transfer. Bioconjug Chem. 2003;14:222–231. doi: 10.1021/bc0256087. [DOI] [PubMed] [Google Scholar]
Associated Data
This section collects any data citations, data availability statements, or supplementary materials included in this article.
Supplementary Materials
Positions of ROI's in QD and quantoplex treated animals. Values obtained from background ROI's on untreated animals (left) are deducted from values measured in corresponding, similarly sized ROI's in treated animals (right).
LPEI quantoplex dynamics after i.v. injection. Nude mice receiving LPEI quantoplexes N/P 6 (right animal) or no injection (left animal) were imaged as described in Methods with images taken every 15 seconds lasting for 30 min.
QD dynamics after i.v. injection. Nude mice receiving 0.625 nmol/kg QD (right animal) or no injection (left animal) were imaged as described in Methods with images taken every 30 seconds lasting for 15 min.
Biodistribution of PEGylated quantoplexes in tumor-bearing animals. Nude mice receiving PEG-BPEI quantoplexes N/P 6 (right animal) or no injection (left animal) were imaged as described in Methods with images taken every 15 seconds lasting for 15 min.
Biodistribution of BPEI quantoplex in tumor-bearing animals. Nude mice receiving BPEI quantoplexes N/P 6 (right animal) or no injection (left animal) were imaged as described in Methods with images taken every 15 seconds lasting for 15 min.


