Abstract
The integration characteristics of retroviral (RV) vectors increase the probability of interfering with the regulation of cellular genes, and account for a tangible risk of insertional mutagenesis in treated patients. To assess the potential genotoxic risk of conventional or self-inactivating (SIN) γ-RV and lentiviral (LV) vectors independently from the biological consequences of the insertion event, we developed a quantitative assay based on real-time reverse transcriptase—PCR on low-density arrays to evaluate alterations of gene expression in individual primary T-cell clones. We show that the Moloney leukemia virus long terminal repeat (LTR) enhancer has the strongest activity in both a γ-RV and a LV vector context, while an internal cellular promoter induces deregulation of gene expression less frequently, at a shorter range and to a lower extent in both vector types. Downregulation of gene expression was observed only in the context of LV vectors. This study indicates that insertional gene activation is determined by the characteristics of the transcriptional regulatory elements carried by the vector, and is largely independent from the vector type or design.
Introduction
Retroviral (RV) vectors were considered safe until lymphoproliferative disorders were reported in five patients undergoing gene therapy for X-linked severe combined immunodeficiency.1,2 In at least four of these patients, a RV vector derived from the Moloney murine leukemia γ-retrovirus (MLV) inserted into, and activated, the LMO2 T-cell proto-oncogene in hematopoietic progenitors.3 Recent studies showed that γ-RV vectors integrate preferentially around promoters and CpG islands,4 where the insertion of transcriptional enhancers contained in the viral long terminal repeats (LTRs) has a high probability of interfering with gene regulation. RV vectors have a high propensity to target proto-oncogenes and genes involved in cell proliferation and signaling,5 the activation of which may lead to clonal skewing or expansion of hematopoietic progenitors in animals6 as well as in patients.7,8,9 However, no adverse effects have been reported in other clinical trials with retrovirally transduced hematopoietic cells,10,11,12 suggesting that disease-, vector-, or transgene-specific factors may cooperate with insertional gene activation in inducing malignant or premalignant transformation.13
The use of human immuno-deficiency virus (HIV)-derived lentiviral (LV) vectors is expected to increase the safety profile of genetically modified hematopoietic cells. Compared to RV vectors, LV vectors do not favor integration in the proximity of regulatory elements4 or growth-controlling genes,5 and are associated with a lower frequency of tumor induction in vivo.14 However, tumorigenicity is highly dependent on the choice of the experimental model, and it is not necessarily predictive of the potential consequences of vector integration in different clinical contexts. Assessing the overall frequency by which an integrated provirus leads to deregulation of gene expression in a target cell provides an additional readout of its potential genotoxicity, which is independent from the biological consequences of the insertion event, e.g., clonal selection or tumor induction. We developed a quantitative assay to evaluate the expression of genes within a window of 200 kb from the insertion site of different RV and LV vectors in randomly selected, individual T-cell clones. We show that the nature of the transcriptional enhancer is more relevant than the vector type in perturbing gene expression in primary hematopoietic cells.
Results
Analysis of RV integration sites in T-cell clones
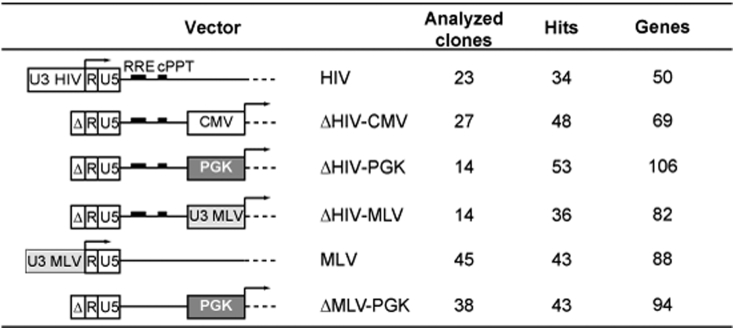
Cord blood or peripheral blood mononuclear cells were transduced at a multiplicity of infection of 10–25 with preparations of MLV- and HIV-derived vectors expressing a green fluorescent protein (GFP) gene from a wild-type LTR or from an internal viral [cytomegalovirus (CMV), MLV LTR] or cellular [phosphoglycerate kinase (PGK)] promoter in a ΔU3, self-inactivating (SIN) design (Figure 1). T-cell clones were obtained from transduced cultures by limiting dilution cloning (0.3–1 cell/well). RV integration sites in randomly selected GFP+ clones were sequenced by linker-mediated (LM) PCR and mapped onto the human genome. T-cell clones transduced by RV or LV vectors contained on average 1.1 and 2.2 independent integrations per cell, respectively (range: 1–5 and 1–7). To estimate the resolution power of one-enzyme LM-PCR in our clones we performed a Southern blot analysis on eight T-cell clones transduced with SIN LVs, used in this study, and compared it with the number of integration sites mapped by LM-PCR (Supplementary Figure S2). As shown, the number of integrations mapped by LM-PCR (Supplementary Figure S2c) underestimates only slightly the number of the integrated proviruses represented in the Southern blot (Supplementary Figure S2b), indicating that although we did not fully map the proviruses in each clone, the LM-PCR technique with one enzyme provides a nice estimate of the copy number of the proviruses integrated in a single clone.
Figure 1.
Schematic structure of retroviral and lentiviral vectors: U3, R, and U5 regions are indicated in the 5′ LTRs. Δ indicates deletion of the U3 element. For each vector, the number of analyzed genes in a window of ±100 kb from the insertion site, and the number of analyzed proviruses (hits) and T-cell clones, are reported. CMV, internal cytomegalovirus immediate-early promoter; cPPT, central polypurine tract; HIV, human immuno-deficiency virus; LTR, long terminal repeat; MLV LTR, internal Moloney leukemia virus LTR; PGK, internal phosphoglycerate kinase promoter; RRE, Rev-responsive element.
RV and LV vectors induce deregulation of gene expression in T cells
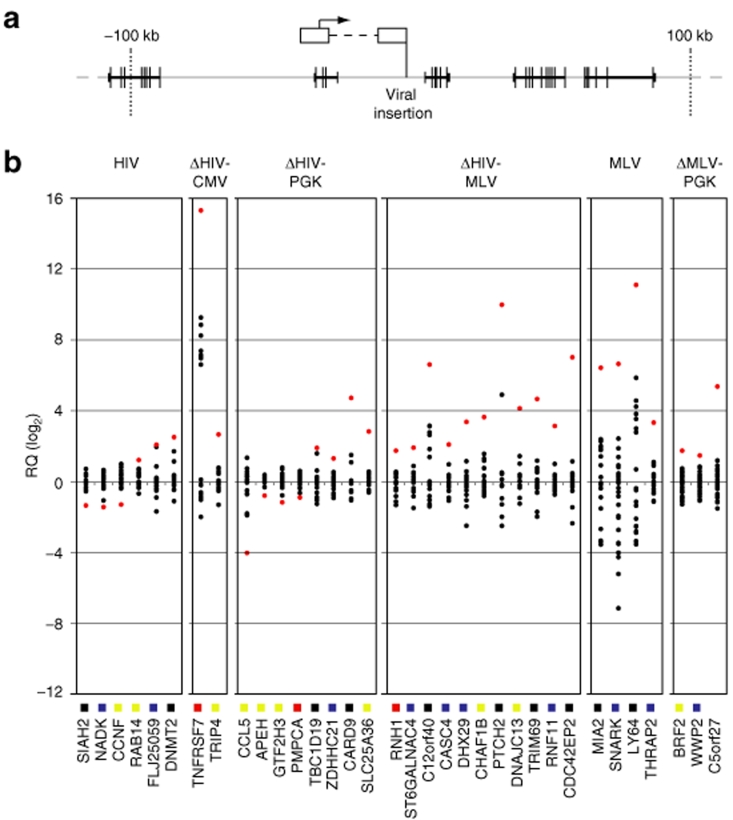
RNA was extracted from each T-cell clone, and the expression of Known Genes (UCSC definition) in a window of ±100 kb from each insertion site (Figure 2a) analyzed by quantitative reverse transcriptase–PCR on custom 7,900 TaqMan low-density arrays, with specific primers designed and validated by the manufacturer (Applied Biosystems, Foster City, CA). For each vector, we analyzed the expression of 50–106 genes flanking 34–53 integrated proviruses in 14–45 independent T-cell clones (Figure 1). Expression of each gene was determined in quadruplicate reactions on the same array in the test clone (the one with an integration at a distance of <100 kb from the gene) and in 10–31 control clones. Expression levels were measured as relative mRNA quantity (RQ) after normalization for the level of glyceraldehyde-3-phosphate dehydrogenase, and plotted as log2 variation from the median levels. The complete results of this analysis are shown in Supplementary Figure S1a–f. Genes showing RQ values significantly higher or lower than the average values in the control clones (z-score >2.81 or <–2.81, P < 0.005) are reported in Figure 2b. For each gene (x-axis), expression values in the test clones are indicated by red dots and those for the control clones by black dots. The average expression level of each gene in mock transduced bulk population of T cells was determined also by Affymetrix microarray analysis, and is indicated on the x-axis by color-coded symbols (black: no expression; blue: low expression; yellow: intermediate expression; red: high expression). This measure helps to understand whether an inserted provirus deregulates genes as active or not at the time of transduction.
Figure 2.
Retroviral (RV) and lentiviral (LV) vectors deregulate gene expression in T-cell clones. (a) Schematic representation of the genomic annotation window around the viral insertion site. Introns are represented by thick horizontal bars, exon by vertical bars. (b) Quantitative PCR analysis of the expression of genes significantly (P < 0.005) up- or downregulated in a ±100-kb window around the integration sites of RV and LV vectors in individual T-cell clones. Expression levels (y-axis) were measured as relative mRNA quantity (RQ) after normalization for the level of glyceraldehyde-3-phosphate dehydrogenase, and plotted as log2 variations from the median level (0) in all analyzed clones. For each gene (x-axis), the expression value in the test clone is indicated by red dots, the expression values in the control clones (10–31) are indicated by black dots. Color-coded symbols on the x-axis indicate the average expression level of each gene in proliferating T cells as determined by Affymetrix microarray analysis. Expression values were divided in four classes, i.e., absent (black), low (<25th percentile in a normalized distribution, blue), intermediate (>25th and <75th percentile, yellow), and high (>75th percentile, red). CMV, cytomegalovirus; HIV, human immuno-deficiency virus; MLV, Moloney leukemia virus; PGK, phosphoglycerate kinase.
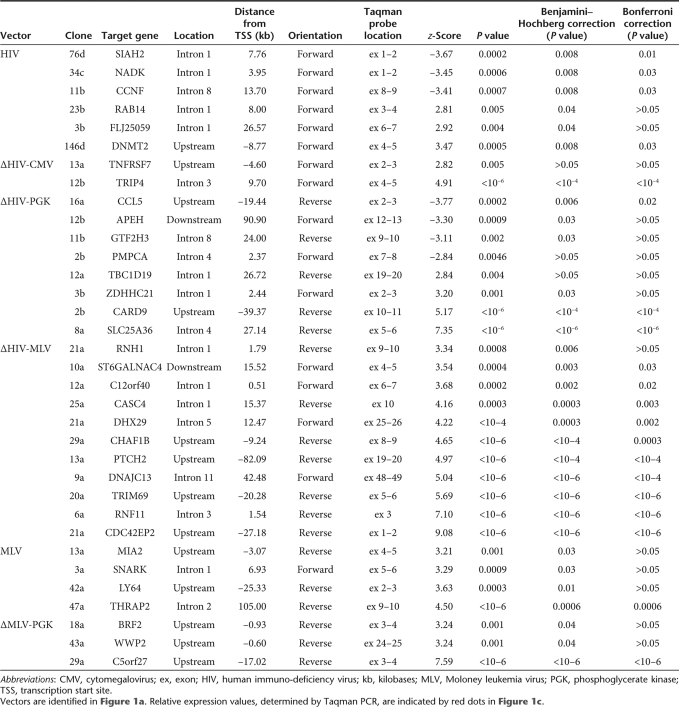
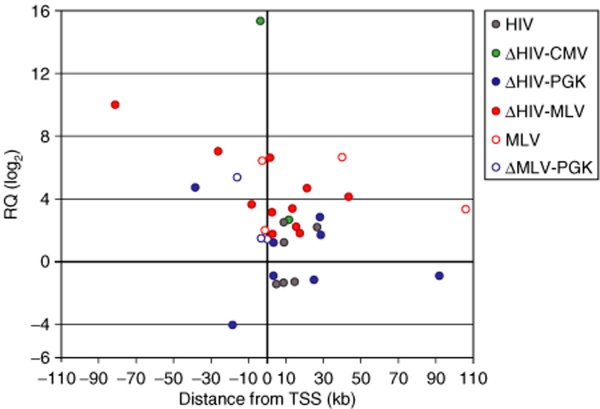
All proviruses induced insertional deregulation of gene expression in the 200-kb window from the integration site, although with different frequencies. The HIV LTR upregulated 3/50 tested genes (6.0%), the internal CMV promoter 2/69 genes (2.9%), and the internal PGK promoter 4/106 genes (3.7%) in a SIN-LV context and 3/94 genes (3.2%) in a SIN-RV context (Figure 2b). The frequency of upregulated genes decreases significantly if only the z-scores >3.29 (P < 0.001) are considered (Table 1). On the contrary, the MLV LTR upregulated genes at a higher frequency, i.e., 4/88 genes (4.5%) in its natural context (a wt-LTR MLV vector) and 11/82 genes (13.4%) as an internal promoter in a SIN-HIV vector (Figure 2b). Upregulation was more pronounced (up to 1,000 times) and more consistent (P < 0.0001 in 8/15 genes, Table 1) compared to that induced by the HIV LTR, CMV, and PGK promoters. Integrated proviruses caused deregulation of gene expression both upstream and downstream from transcription start sites (Figure 3), in most cases within a range of ±50 kb. However, 2/11 MLV LTR insertions upregulated gene expression from as far as –82 and +105 kb from the start site (Figure 3).
Table 1.
List of genes deregulated by γ-retroviral or lentiviral integration in T-cell clones
Figure 3.
Schematic plot representing relative mRNA quantity (RQ, y-axis) of the genes deregulated by viral integration, plotted against the distance of the integration site from the transcription start sites (TSSs, x-axis). The colored dots represent the retroviral and lentiviral vectors. CMV, cytomegalovirus; HIV, human immuno-deficiency virus; MLV, Moloney leukemia virus; PGK, phosphoglycerate kinase.
To increase the robustness of the analysis, P values of overexpressed genes were corrected for false discovery rate by the Benjamini–Hochberg and Bonferroni methods. Genes significantly overexpressed (P < 0.05) after the more stringent Bonferroni correction were 1/3 for the HIV LTR, 1/2 for the CMV promoter, 3/7 for the PGK promoter in both vector context, and 8/15 for the MLV LTR (Table 1), confirming the significant difference in the frequency of upregulation between the MLV LTR and the other promoter/enhancer elements.
LV vectors cause both up- and downregulation of gene expression
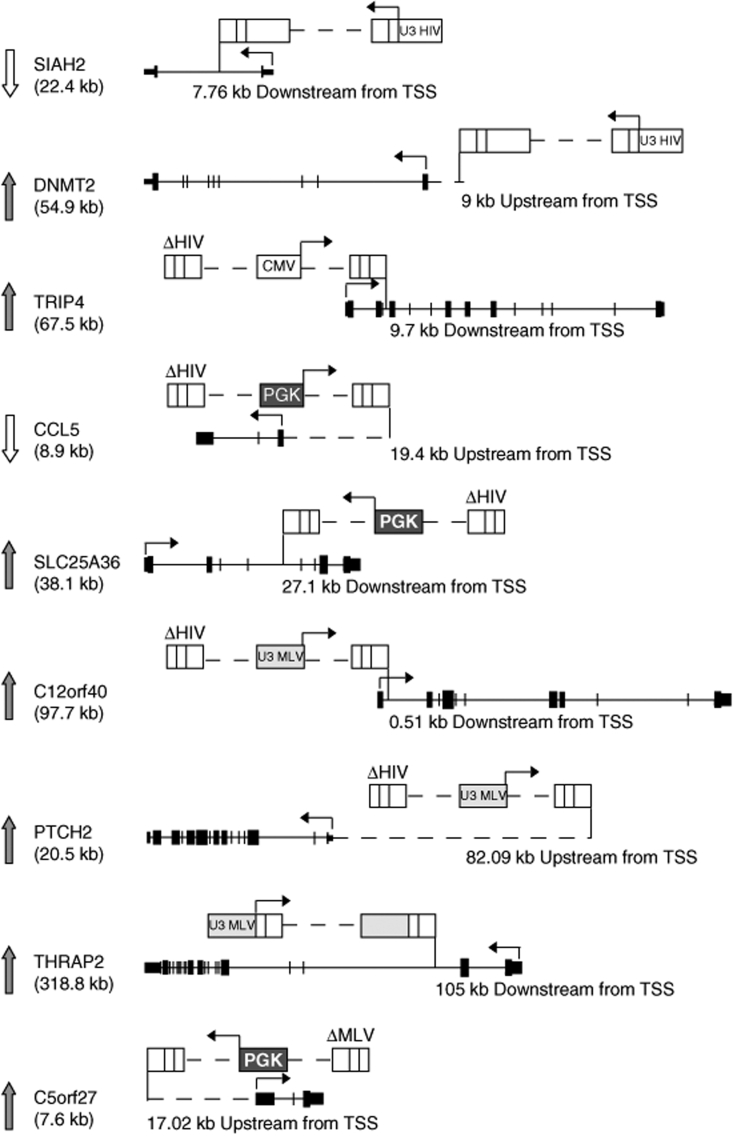
Unexpectedly, the HIV and ΔHIV-PGK vectors induced downregulation as often as upregulation, i.e., in 3/50 (6.0%) and 4/106 (3.7%) tested genes, respectively (z-score <–2.81, P < 0.005, Figure 2b). Half of these downregulations were still significant (P < 0.05) after Bonferroni correction (Table 1). Genes were downregulated two- to tenfold compared to the mean of the control clone population, and less than twofold compared to the lowest-expressing control clone (Figure 2b), consistent with inactivation of only one allele. The PGK promoter induced no significant downregulation of the 94 tested genes in a SIN-RV context (ΔMLV-PGK), suggesting that the LV vector backbone might have characteristics that favor this phenomenon. Indeed, in 4/7 cases the HIV and ΔHIV-PGK vectors inserted HIV-derived splicing and polyadenylation signals within the downregulated gene in direct transcriptional orientation and upstream from the TaqMan primer/probe (e.g., SIAH2 gene Figure 4), an event that might reduce transcript accumulation and detection by a post-transcriptional mechanism. In 2/7 cases, however, the vector integrated outside the target gene (e.g., CCL5 gene Figure 4), indicating reduced transcription as the likely cause of downregulation.
Figure 4.
Schematic representation of some proviral insertions leading to deregulation of gene expression. Integrated proviruses are shown above each gene locus, where black boxes represent exons and a vertical bar indicates the insertion sites. Arrows at the left of the panel represent the up- and downregulation of the hit gene. Arrows at the top of the vectors and the gene indicate transcription start sites (TSSs). CMV, cytomegalovirus; HIV, human immuno-deficiency virus; MLV, Moloney leukemia virus; PGK, phosphoglycerate kinase.
Discussion
Insertion of RV vectors carrying transcriptional and post-transcriptional regulatory elements in the human genome can perturb the normal regulation of genes surrounding the integration sites, and eventually induce clonal selection or neoplastic transformation in animal models6,15 or in patients.1,2,7,8,9 The choice of a vector type/design and of a promoter/enhancer element to drive a therapeutic transgene must take into account the potential genotoxicity of the integrated provirus in the target cell. This can be assayed in a variety of tests, which include induction of tumors in vitro16 or in vivo.14 These parameters, however, are highly dependent on the choice of the animal model or the test cell line, and are not necessarily predictive of the potential consequences of vector integration in different human cells, genetic backgrounds, and diseases contexts. The overall influence of a given provirus on the expression of surrounding genes provides an additional readout of its potential genotoxicity, which is independent from the biological consequences of the insertion event, e.g., clonal selection or tumor induction. We have developed a reliable assay to determine the a priori potential for gene deregulation of different vectors at clonal level and in a clinically relevant target cell, e.g., human primary T-lymphocytes. Very few studies have addressed this important safety parameter in the past17,18 and none has done so for different vectors and transcriptional regulatory elements. Our study shows that transcriptionally active enhancer/promoter elements may perturb expression of cellular genes at considerable distance from a RV insertion site, independently from the vector type (RV or LV) and design (LTR-based or SIN). A strong enhancer element such as the MLV LTR interferes with normal gene regulation more often, at a longer range and in a more pronounced fashion both in an MLV and in a SIN-HIV context, while a weaker enhancer such as PGK has a lower activity in both vector contexts. For all vectors, upregulation was observed in genes expressed at any basal level in T cells, indicating that enhancer insertion can activate inactive genes as well as overexpress active ones. Interestingly, LV vectors carrying either a wild-type or a SIN LTR induced downregulation of gene expression at a significant frequency, a phenomenon not observed in the case of RV vectors. In three quarter of the cases, the vectors integrated in direct transcriptional orientation within an intron of the downregulated gene, where the insertion of HIV-derived splicing and polyadenylation signals may cause aberrant splicing and/or premature transcript termination. Post-transcriptional gene inactivation may, therefore, be a relatively frequent consequence of LV integration, possibly underestimated by a PCR-based assay that would detect decreased transcript levels only when the specific probe/primer pairs are located downstream from the viral integration site. In some cases, however, reduced transcript accumulation may have been caused only by transcriptional mechanisms, since the vector integrated outside the transcribed portion of the target gene.
This study shows that the genotoxic potential of a RV vector depends on the activity of the elements used to drive transgene expression rather than on the vector type. The SIN design, typical of LV vectors, removes the enhancers contained in the LTR and reduces the potential for perturbation of gene expression. A SIN vector, however, can induce upregulation of gene expression at high frequency if a potent viral enhancer, such as the MLV LTR, or a cellular enhancer, such as the β-globin locus control region,17 is used to drive transgene expression. The SIN design can indeed be applied also to RV vectors, where it was reported to reduce the risk of insertional oncogenesis compared to an LTR-based design.16 Therefore, LV vectors are not inherently safer than RV vectors in terms of their potential to perturb gene expression in target cells, which appears to depend only on the activity of the elements used to drive transgene expression. It must be stressed, however, that a perturbation assay measures only one of the factors contributing to the overall genotoxic potential of a RV vector. An additional crucial factor is provided by the different propensity of LV and RV vectors to target potentially sensitive regions of the genome. In fact, MLV-based vectors target promoters and regulatory elements, and integrate in the proximity of growth-controlling genes, at a much higher frequency than HIV-based vectors.4,5 This is expected to increase the relative genotoxic potential of RV vectors by a significant factor, independently from the transcriptional activity of the internal elements. On the other hand, gene inactivation may largely depend on the frequency of intragenic insertion and the strength of the splice/polyadenylation signal carried by the vector, both higher in the case of LV vectors. Insertion of strong, HIV-derived splicing or polyadenylation signals within a gene might indeed reduce transcript detection by a post-transcriptional mechanism. Gene inactivation could represent a specific risk of LV vectors, which contain stronger splicing signals than most γ-RV vectors, and have a higher propensity to integrate within genes. Genotoxicity should, therefore, be assessed in a comprehensive fashion in relevant target cells and by a variety of parameters. We propose to measure the potential for deregulation of gene expression as one of these parameters. The automated quantitative PCR–based assay described in this study is relatively inexpensive and easy to perform, and could be easily standardized and validated for preclinical or follow-up assessment of vector genotoxicity.
Materials and Methods
RV vectors. Vectors pHR2pptGFP-PGKΔNGFrwpre (HIV), pRRLsin-18.pptCMV-GFPwpre (ΔHIV-CMV), pRRLsin-18.pptPGK-GFPwpre (ΔHIV-PGK), pRRLsin-18.pptMLV-GFPwpre (ΔHIV-MLV), SFCMM2 (MLV), and pSRS11.PGK.GFP.wpre (ΔMLV-PGK) were previously described.5,11,16 MLV vector supernatants were obtained from a stable, Am12-derived amphotropic packaging cell line.19 The ΔMLV-PGK vector was pseudotyped with VSV-G by transient cotransfection of 293T cells with MLV Gag-Pol and VSV-G expression plasmids. VSV-G-pseudotyped LV vector supernatants were produced by transient transfection of 293T cells, as previously described.5
T-cell isolation, transduction, and cloning. Ficoll-Hypaque mononuclear cell fractions were isolated from cord blood or peripheral blood from healthy donors, stimulated in culture with X-VIVO-15 (BioWhittaker, Verviers, Belgium) supplemented with 10% human serum (Cambrex BioScience, Walkersville, MD), 50 U/ml IL-2 (Chiron, Emeryville, CA), and 25 U/ml IL-7 (ImmunoTools, Friesoythe, Germany), in the presence of CD3/CD28 T-cell expander (Dynal, Lake Success, NY) at a ratio of 0.5 bead/cell for 3 days, transduced by spinoculation and cloned by limiting dilution in 96-well plates at a concentration of 0.3–1 cells/well, as previously described.19
Analysis of RV integration sites. Integration sites were cloned by LM-PCR as described previously.20,21 Briefly, genomic DNA was extracted from 106 infected cells and digested with MseI and a second enzyme to prevent amplification of internal 5′ LTR fragments (PstI for RV vectors and SacI/NarI for LV vectors). An MseI double-stranded linker was then ligated, and LM-PCR performed with nested primers specific for the linker and the 3′ LTR (MLV: 5′-GACTTGTGGTCTCGCTGTTCCTTGG-3′ and 5′-GGTCTCCTCTGAGTGATTGACTACC-3′; HIV: 5′-AGTGCTTC AAGTAGTGTGTGCC-3′ and 5′-GTCTGTTGTGTGACTCTGGTAA C-3′). PCR products were shotgun-cloned (TOPO TA cloning kit; Invitrogen; Carlsbad, CA) into libraries of integration junctions and sequenced. A valid integration contained the MLV or HIV nested primer, the entire MLV or HIV genome, and the linker nested primer. Sequences between the 3′ LTR and the linker primers were mapped onto the human genome (UCSC Human Genome Project Working Draft, hg17) using Blat22 requiring a 98% identity over the entire sequence length and selecting the best hit. The absolute genomic coordinates of the integration sites were defined as a result of the combination of genomic alignment and vector relative orientation data.
Gene expression profiling of mock-transduced T cells was determined in triplicate by Affymetrix HG-U133_Plus_2 Gene Chip analysis, as previously described.11 Expression values were divided in four classes, i.e., absent, low (<25th percentile in a normalized distribution), intermediate (>25th and <75th percentile), and high (>75th percentile).
Quantitative analysis of gene expression. Total RNA (100 ng) was reverse transcribed using the cDNA Archive kit (Applied Biosystems). TaqMan PCR reactions were carried out onto custom 7900 TaqMan low-density arrays (“Assay on Demand,” Applied Biosystems) on an ABI PRISM 7900 HT system. Gene expression levels were determined using the comparative CT method of relative quantification. ΔCTs were calculated using the CT of the glyceraldehyde-3-phosphate dehydrogenase gene as an internal control, and normalized (ΔΔCTs) using the median of ΔCTs in all samples as calibrator. The RQ of each transcript was calculated as 2–ΔΔCT, and plotted as log2 values. For each gene, the RQ value in the test T-cell clone was compared with the mean ± SD of a control cell population (10 < n < 31), and z-scores determined as  . P values were corrected for false discovery rate by the Benjamini–Hockberg and Bonferroni methods.
Supplementary MaterialFigure S1. (A-F) Quantitative PCR analysis of the expression in individual T-cell clones of all the analyzed genes in a window of ±100-kb around the integration sites of the RV and LV vectors indicated in Figure 1A.Figure S2. Analysis of lentiviral integration sites.
Supplementary Material
(A-F) Quantitative PCR analysis of the expression in individual T-cell clones of all the analyzed genes in a window of ±100-kb around the integration sites of the RV and LV vectors indicated in Figure 1A.
Analysis of lentiviral integration sites.
Acknowledgments
This work was supported by grants from Telethon Italy (GGP06101, GGP08095), the European Commission (VI FP, CONSERT and MAGSELECTOFECTION), Fondazione Cariplo, Associazione Italiana per la ricerca sul cancro (AIRC) and grant from Ministero della Salute. S.P. and C.Bov. are employees of Molmed S.p.A., a biotechnology company with an interest in gene therapy.
REFERENCES
- Hacein-Bey-Abina S, Garrigue A, Wang GP, Soulier J, Lim A, Morillon E, et al. Insertional oncogenesis in 4 patients after retrovirus-mediated gene therapy of SCID-X1. J Clin Invest. 2008;118:3132–3142. doi: 10.1172/JCI35700. [DOI] [PMC free article] [PubMed] [Google Scholar]
- Di Nunzio F, Maruggi G, Ferrari S, Di Iorio E, Poletti V, Garcia M, et al. Correction of laminin-5 deficiency in human epidermal stem cells by transcriptionally targeted lentiviral vectors. Mol Ther. 2008;16:1977–1985. doi: 10.1038/mt.2008.204. [DOI] [PubMed] [Google Scholar]
- McCormack MP., and , Rabbitts TH. Activation of the T-cell oncogene LMO2 after gene therapy for X-linked severe combined immunodeficiency. N Engl J Med. 2004;350:913–922. doi: 10.1056/NEJMra032207. [DOI] [PubMed] [Google Scholar]
- Bushman F, Lewinski M, Ciuffi A, Barr S, Leipzig J, Hannenhalli S, et al. Genome-wide analysis of retroviral DNA integration. Nat Rev Microbiol. 2005;3:848–858. doi: 10.1038/nrmicro1263. [DOI] [PubMed] [Google Scholar]
- Cattoglio C, Facchini G, Sartori D, Antonelli A, Miccio A, Cassani B, et al. Hot spots of retroviral integration in human CD34+ hematopoietic cells. Blood. 2007;110:1770–1778. doi: 10.1182/blood-2007-01-068759. [DOI] [PubMed] [Google Scholar]
- Kustikova O, Fehse B, Modlich U, Yang M, Dullmann J, Kamino K, et al. Clonal dominance of hematopoietic stem cells triggered by retroviral gene marking. Science. 2005;308:1171–1174. doi: 10.1126/science.1105063. [DOI] [PubMed] [Google Scholar]
- Ott MG, Schmidt M, Schwarzwaelder K, Stein S, Siler U, Koehl U, et al. Correction of X-linked chronic granulomatous disease by gene therapy, augmented by insertional activation of MDS1-EVI1, PRDM16 or SETBP1. Nat Med. 2006;12:401–409. doi: 10.1038/nm1393. [DOI] [PubMed] [Google Scholar]
- Schwarzwaelder K, Howe SJ, Schmidt M, Brugman MH, Deichmann A, Glimm H, et al. Gammaretrovirus-mediated correction of SCID-X1 is associated with skewed vector integration site distribution in vivo. J Clin Invest. 2007;117:2241–2249. doi: 10.1172/JCI31661. [DOI] [PMC free article] [PubMed] [Google Scholar]
- Deichmann A, Hacein-Bey-Abina S, Schmidt M, Garrigue A, Brugman MH, Hu J, et al. Vector integration is nonrandom and clustered and influences the fate of lymphopoiesis in SCID-X1 gene therapy. J Clin Invest. 2007;117:2225–2232. doi: 10.1172/JCI31659. [DOI] [PMC free article] [PubMed] [Google Scholar]
- Bonini C, Grez M, Traversari C, Ciceri F, Marktel S, Ferrari G, et al. Safety of retroviral gene marking with a truncated NGF receptor. Nat Med. 2003;9:367–369. doi: 10.1038/nm0403-367. [DOI] [PubMed] [Google Scholar]
- Recchia A, Bonini C, Magnani Z, Urbinati F, Sartori D, Muraro S, et al. Retroviral vector integration deregulates gene expression but has no consequence on the biology and function of transplanted T cells. Proc Natl Acad Sci USA. 2006;103:1457–1462. doi: 10.1073/pnas.0507496103. [DOI] [PMC free article] [PubMed] [Google Scholar]
- Aiuti A, Cassani B, Andolfi G, Mirolo M, Biasco L, Recchia A, et al. Multilineage hematopoietic reconstitution without clonal selection in ADA-SCID patients treated with stem cell gene therapy. J Clin Invest. 2007;117:2233–2240. doi: 10.1172/JCI31666. [DOI] [PMC free article] [PubMed] [Google Scholar]
- Bushman FD. Retroviral integration and human gene therapy. J Clin Invest. 2007;117:2083–2086. doi: 10.1172/JCI32949. [DOI] [PMC free article] [PubMed] [Google Scholar]
- Montini E, Cesana D, Schmidt M, Sanvito F, Ponzoni M, Bartholomae C, et al. Hematopoietic stem cell gene transfer in a tumor-prone mouse model uncovers low genotoxicity of lentiviral vector integration. Nat Biotechnol. 2006;24:687–696. doi: 10.1038/nbt1216. [DOI] [PubMed] [Google Scholar]
- Li Z, Dullmann J, Schiedlmeier B, Schmidt M, von Kalle C, Meyer J, et al. Murine leukemia induced by retroviral gene marking. Science. 2002;296:497. doi: 10.1126/science.1068893. [DOI] [PubMed] [Google Scholar]
- Zychlinski D, Schambach A, Modlich U, Maetzig T, Meyer J, Grassman E, et al. Physiological promoters reduce the genotoxic risk of integrating gene vectors. Mol Ther. 2008;16:718–725. doi: 10.1038/mt.2008.5. [DOI] [PubMed] [Google Scholar]
- Hargrove PW, Kepes S, Hanawa H, Obenauer JC, Pei D, Cheng C, et al. Globin lentiviral vector insertions can perturb the expression of endogenous genes in beta-thalassemic hematopoietic cells. Mol Ther. 2008;16:525–533. doi: 10.1038/sj.mt.6300394. [DOI] [PubMed] [Google Scholar]
- Recchia A., and , Mavilio F. Site-specific integration into the human genome: ready for clinical application. Rejuvenation Res. 2006;9:446–449. doi: 10.1089/rej.2006.9.446. [DOI] [PubMed] [Google Scholar]
- Marktel S, Magnani Z, Ciceri F, Cazzaniga S, Riddell SR, Traversari C, et al. Immunologic potential of donor lymphocytes expressing a suicide gene for early immune reconstitution after hematopoietic T-cell-depleted stem cell transplantation. Blood. 2003;101:1290–1298. doi: 10.1182/blood-2002-08-2351. [DOI] [PubMed] [Google Scholar]
- Schmidt M, Hoffmann G, Wissler M, Lemke N, Mussig A, Glimm H, et al. Detection and direct genomic sequencing of multiple rare unknown flanking DNA in highly complex samples. Hum Gene Ther. 2001;12:743–749. doi: 10.1089/104303401750148649. [DOI] [PubMed] [Google Scholar]
- Wu X, Li Y, Crise B., and , Burgess SM. Transcription start regions in the human genome are favored targets for MLV integration. Science. 2003;300:1749–1751. doi: 10.1126/science.1083413. [DOI] [PubMed] [Google Scholar]
- Kent WJ. BLAT—the BLAST-like alignment tool. Genome Res. 2002;12:656–664. doi: 10.1101/gr.229202. [DOI] [PMC free article] [PubMed] [Google Scholar]
Associated Data
This section collects any data citations, data availability statements, or supplementary materials included in this article.
Supplementary Materials
(A-F) Quantitative PCR analysis of the expression in individual T-cell clones of all the analyzed genes in a window of ±100-kb around the integration sites of the RV and LV vectors indicated in Figure 1A.
Analysis of lentiviral integration sites.


