

Abstract
Despite the importance of local structural detail to a mechanistic understanding of RNA catalysis and binding functions, RNA backbone conformation has been quite recalcitrant to analysis. There are too many variable torsion angles per residue, and their raw empirical distributions are poorly clustered. This study applies quality-filtering techniques (using resolution, crystallographic B factor, and all-atom steric clashes) to the backbone torsion angle distributions from an 8,636-residue RNA database. With noise levels greatly reduced, clear signal appears for the underlying angle preferences. Half-residue torsion angle distributions for α-β-γ and for δ-ε-ζ are plotted and contoured in 3D; each shows about a dozen distinct peaks, which can then be combined in pairs to define complete RNA backbone conformers. Traditional nucleic acid residues are defined from phosphate to phosphate, but here we use a base-to-base (or sugar-to-sugar) division into “suites” to parse the RNA backbone repeats, both because most backbone steric clashes are within suites and because the relationship of successive bases is both reliably determined and conformationally important. A suite conformer has seven variables, with sugar pucker specified at both ends. Potential suite conformers were omitted if not represented by at least a small cluster of convincing data points after application of quality filters. The final result is a small library of 42 RNA backbone conformers, which should provide valid conformations for nearly all RNA backbone encountered in experimental structures.
Keywords: RNA structure, RNA conformation, backbone conformers, quality filtering, all-atom contacts
RNA has long been known to play a central role in the storage, and especially in the communication, of biological information and to be well-suited for specific and regulated molecular-binding interactions. More recently, it has also been shown to perform enzymatic catalysis (1, 2) and is therefore quite likely to have been critical in the first development of living systems (3). The size, complexity, and specific detail of RNA 3D structure are essential to its various functions, and in that respect RNA is more like protein than like DNA. The determination, analysis, and modification of RNA structure have become an important aspect of biology, with major contributions from NMR (4), electron microscopy (5), and crystallography (6). Progress accelerated recently with the tour-de-force x-ray structures of the ribosomal 50S and 30S (7–9) subunits, which expanded the database of known RNA structures enough to make statistical analysis feasible.
Despite all the new information, determining and analyzing RNA structure are both still very difficult tasks. Large RNA structures can typically be determined only to resolutions of ≈2.5 Å or lower, where the phosphates and base planes can be located quite reliably, but the sugars and especially the rest of the backbone are not seen well at all. As shown in Fig. 1, there are six rotatable torsion angles per residue along the RNA backbone, with the dense phosphate as the only clear marker. Even in very carefully done structures, the possibility of conformational error is always quite real. The strengths and limitations in RNA crystal structures can be highlighted very clearly by independent information from all-atom contact analysis (10), which adds all hydrogen atoms and then calculates and displays the detailed van der Waals and H-bond contacts. As seen in Fig. 2a, for an internal section of rr0033 (7) 23S rRNA, the bases are very accurately placed, and their contacts show the well fit green and blue dots of excellent van der Waals packing plus the pale green lenses of favorably overlapped H bonds. (Note: Despite its size, rr0033 is better than usual for RNA at 2.4-Å resolution.) The backbone contacts, in contrast, as seen in Fig. 2b, are very difficult to get correct; most are excellent, but clusters of red spikes mark the fairly frequent physically impossible steric clashes where nonpolar atoms overlap by half an angstrom or more. This causes problems at three different levels: fitting and refinement are more difficult and structures less accurate than one would like; conformational analysis of RNA has a very high noise level, so that looking more closely can even make the problem worse (11); and finally, the detailed analyses of geometry and chemistry needed to understand specific drug and protein binding and RNA catalytic mechanisms are compromised. The usual solution is some form of simplification and variable reduction: treating pairs of adjacent angles (12), omitting or binning angles (13), or defining virtual dihedrals (14). These approaches are sensible and effective for one very important aspect of the task; the virtual-angle method, for instance, has already proven excellent at finding and comparing multiresidue RNA motifs (15, 16). However, almost by definition, such simplifications are avoiding rather than fixing the underlying problem. One recent initiative does incorporate the full set of torsion angles. As part of the very complete and useful RNABase web service (www.rnabase.org), Murthy and Rose (17) do both an analysis of probable errors based on theoretically calculated 2D plots for adjacent angle pairs (12) and a classification of the torsion-angle combinations that occur in their database. They flag about one probable error in some dihedral every two residues on average, and they list 13,756 distinct conformations as of October 2003, which seems an eloquent demonstration of why there is indeed a problem.
Fig. 1.

RNA backbone, with the six torsion angles α, β, γ, δ, ε, ζ labeled on the central bond of the four atoms defining each dihedral. The two alternative ways of parsing out a repeat are indicated: a traditional nucleotide residue goes from phosphate to phosphate (changing residue number between O5′ and P), whereas an RNA suite goes from sugar to sugar (or base to base).
Fig. 2.

A section with tertiary helix interactions inside the rr0033 23S rRNA at 2.4-Å resolution (chain 0 11–23, 520–57, 600–20), to show the contrasting accuracy with which bases vs. backbone can be determined for large RNAs. In a, the green and blue all-atom-contact dots show the nearly perfect van der Waals and H bond contacts of a well fit base stack, whereas in b, the red spikes mark impossible steric clashes of nonpolar atoms for residues with locally misfit backbone.
The current study applies to RNA backbone data the approaches we previously developed on proteins to analyze packing details (10), to diagnose and correct problems in the experimental structures (18, 19), and to produce low-noise data distributions for improved ϕ, ψ criteria and side-chain rotamers (20, 21). The results are the identification of particular valid RNA backbone conformers (several with known structural roles), the invalidation of many other potential conformations, and the construction of a small library of full torsion-angle backbone conformers.
Methods
A database of RNA crystal structure files at 3.0-Å resolution or better was chosen from the Nucleic Acid Database (NDB) (22) as of June 16, 2003, taking the highest-resolution example of each unique sequence and either the first or the best-ordered example for repeats within one file. One hundred thirty-two files are included [listed below† by NDB code and with Protein Data Bank (PDB) code, resolution, size, and title, in Table 2, which is published as supporting information on the PNAS web site], with 8,636 total nucleic acid residues. Dihedral angles were calculated by dang (23); their location and nomenclature are shown in Fig. 1. Hydrogens were added by reduce (24), and all-atom backbone clashes (disallowed steric overlaps ≥0.4 Å) were calculated by probe and clashlist (10). A backbone–backbone clash for any atom was flagged as a clash for all six backbone dihedral angles of that residue. Those angles and quality values, plus the resolution, base identity, and highest crystallographic B factor for any backbone atom in the residue, were entered into tables in excel (Microsoft). To facilitate analysis of sugar-to-sugar “suites” (see Results for definition), the δ–ε–ζ values for the preceding residue (where extant) were also included in the entry for each residue.
For a large sample of the data, kinemage graphics files were produced by prekin and examined in mage (18, 25), including all-atom contacts; for a small sample, 2Fo–Fc electron density contours were displayed as well. Individual regions showing bad steric clashes were refit by hand by using a dockable ideal-geometry model of a single RNA suite with rotatable backbone dihedral angles, to check whether suspect conformations could be successfully reinterpreted as better conformers.
Data-point distributions of backbone dihedral angle values in one, two, or three dimensions were also visualized in mage, along with smoothed contours of those distributions made by the methods reported in Lovell et al. (21), where each point is replaced by a smooth cosine mask, and the summed masks are contoured at levels that enclose normalized percentages of the data. Central values for conformers are reported as modes (peak values) in Table 3, which is published as supporting information on the PNAS web site, rather than averages, to avoid problems from skewed peak shapes or from bin boundary choices (20). Because the size of the database is only barely adequate to analyze the six backbone angles three at a time, the current work was not able to include base identity and χ angle. These clearly exert an important influence on the backbone but are less tightly coupled than the backbone dihedrals are to one another. Also, because our preliminary work showed that the amplitude of sugar pucker seems quite constant, and for RNA the only two puckers that occur in high-quality data are C3′endo and C2′endo, we were able to use the single variable of the δ dihedral angle to describe sugar pucker rather than the two variables of phase and amplitude. Consequently, the nine possible torsion variables are reduced to six, which can be divided into two 3D distributions, one for each heminucleotide. Full conformers were visualized for study by cutting the data into sets for each of the seven peaks of the δ–ε–ζ distribution and then plotting α–β–γ for each of those sets.
Quality filtering was applied to the data by using the all-atom clash and B factor criteria at the residue level and resolution at the file level. Resolution is a very powerful criterion of RNA backbone accuracy (see Introduction), but it is awkward for the present RNA dataset, because cutting below the rr0033 50S ribosome structure at 2.4 Å leaves very little of the data. The three quality filters were applied in pairs or all together at modest levels, and B and resolution were used at three or more stringency levels to study whether individual peaks in the distribution consistently gained or consistently lost in relative contribution as a function of data quality.
Results
The simplest level at which quality filters can improve the RNA conformational descriptions is for the 1D distributions of individual dihedral angles. The unfiltered plots are quite daunting, because not only do they all show multiple peaks, but in many cases the peaks are extremely broad, whereas for ζ, the distribution is flat and continuous over much of the range. For a representative view of the unfiltered data, Fig. 3a plots the α vs. β values for the entire data set. It is evident that β near 0° is disallowed, and that α has a significant preference for staggered values with a large peak at A form, but the noise level nearly obliterates any signal. Faith or imagination is required to detect the shoulder above A form or the peak at α –110°, β 80° that will be demonstrated and discussed below. As hoped, quality filters make a significant improvement, sharpening or breaking up some of the broader peaks and eliminating a few peaks altogether; for example, the points with ε near 70° in the bottom half of the unfiltered ε–ζ distribution of Fig. 3b are absent after filtering. Because of crowding by the 2′OH, the ε angle in RNA is restricted to one range of approximately eclipsed values between ≈–100° and –170°.
Fig. 3.

2D plots of the unfiltered data to 3-Å resolution for: α vs. β (a) and ε vs. ζ (b) torsion angles, to illustrate the severe signal-to-noise problem in the raw data. The large cluster in each plot is A form. The origin is at a corner rather than at the center to avoid splitting the data peaks, but angle values are labeled on the axes.
As is clear from the success of Ramachandran plots and sidechain rotamers for proteins, conformational angles are seldom independent and are much more powerful when analyzed together in two or more dimensions. A majority of all of the 2D angle distributions for RNA backbone show significant interdependence, even for nonadjacent angles within a suite. However, we find the most informative presentation is two 3D distributions, one for the α, β, and γ angles between the 5′ phosphate and the sugar and one for the δ, ε, and ζ angles from the sugar ring through the 3′ phosphate. Following Malathi and Yathindra (26), the two half-residues can be called heminucleotides.
The unfiltered 3D distribution plots have obviously complex shapes, definite relative occurrence preferences, and some blank areas, but the populated regions are all continuous and vary rather smoothly with few clearly separate peaks aside from the huge maximum at A form. Quality filtering to remove angle-sets that include an all-atom clash overlap ≥0.4 Å (see Methods) or have a backbone atom with crystallographic B factor >60 makes a qualitative change in the information content and uncovers a large but manageable set of distinct conformations (Fig. 4). At the most generous estimate, there are 15 peaks in the α–β–γ plot for each pucker of the adjacent sugar; peaks occupy a 3 × 3 grid of approximately staggered values in the α and γ dimensions, but β also changes significantly. The δ–ε–ζ plot has seven peaks, three for C2′endo and four for C3′endo pucker as measured by δ. It is notable that δ is clearly bimodal, its two values corresponding cleanly to the above sugar puckers. As noted above, in reliable data ε is always essentially eclipsed, but its preferred value range is offset from one pucker to the other; for C3′endo sugar pucker, the ε distribution has mode –150°; whereas for C2′endo, the ε mode is at –100°.
Fig. 4.

Plots of the heminucleotide angle triplets for data filtered by clashes and B > 60, with smoothed contours enclosing the top 7–10 peak clusters: (a) α–β–γ plot for adjacent sugar pucker C3′ endo. (b) α–β–γ plot for adjacent C2′ endo pucker. (c) δ–ε–ζ plot (filtered also for resolution >2.5 Å).
Analyzing the backbone angles in two groups of three is convenient within the limitations of multidimensional visualization. That separation has turned out to confer real substantive advantages as well, because the two heminucleotides can be combined in either order to describe either a traditional phosphate-to-phosphate residue or else a base-to-base (or sugar-to-sugar) grouping as illustrated in Fig. 1, which we will call a “suite.” Division at the phosphorus is the chemically reasonable choice and seems constrained even by simple logic, because it is centered around the base whose variation defines the identity of the residue. That choice has tactical advantages for the early stages of crystallographic model-to-map fitting, and it is also necessary for comparison with previous studies. However, for a detailed geometrical description of nucleic acid backbone, the suite division is usually preferable. Both RNA and DNA structures are determined largely by base interactions, in patterns that make the relative positioning of successive bases the dominant influence connecting local conformation with larger motifs; that relationship between successive bases is reliably and accurately seen even at low resolution and therefore makes a good basis for a robust coarse description of conformation. Our analysis of serious (≥0.4 Å), local (±1 in sequence), all-atom steric clashes in RNA backbone shows that they involve 36 different atom-pair types, but that only 1% are between atoms on either side of the sugar (and thus within a traditional residue), whereas 99% are between atoms on either side of a phosphorus (and thus within a sugar-to-sugar suite). Those physically impossible atomic overlaps are our most direct evidence for the incorrectness of a specific backbone conformation, and so the suite description of backbone conformers is more amenable than the residue to a suitably critical analysis. Treatment of chain ends also favors the chemical residue less than one would expect. For a chain of n nucleotides, the traditional division defines all dihedrals for only n – 2 full residues, whereas the base-to-base division has n – 1 complete suites, all of which show normal patterns except that the final δ angle is less clearly bimodal than for internal sugars. For all of these reasons, therefore, both in the current study and in future work, we propose to make use of both the residue and the suite for analyzing the repeating units of RNA backbone.
The combinations of heminucleotide peaks from the separate 3D distributions produce 210 potential conformers per RNA suite (with sugar pucker specified on each end), not all of which are physically consistent. Estimating a central value for each peak and trying all combinations on an ideal-geometry model leave 146 suite conformers for a suite of sugar-phosphate backbone that are not ruled out by large steric clashes. Only 42 suite conformers actually show an acceptable cluster of data points (at least five points and 10% of their δ-ε-ζ heminucleotide peak) when filtered for clashes and B > 60. All but a few pairs of those peaks are widely separated in at least one angle dimension.
Table 1 summarizes these results as a matrix of peak identities and relative occurrence frequencies for the RNA backbone suite conformers, combined from the heminucleotide peaks of α–β–γ and δ–ε–ζ into full suites with sugar pucker specified at each end. The column and row headings in Table 1 and the conformer descriptions used in the text below (in bold face) function as names, simplified where possible to one character per angle. For uses such as model building, quantitative modal angle values are listed for each of the 42 conformers in Table 3. The major conclusion of this work is that RNA backbone conformation is actually rotameric at this detailed level, with a manageable number of common conformers that can be very useful in experimental structure determination and also in the prediction, calculation, and understanding of RNA 3D structure and activity.
Table 1. The 42 suite conformers for RNA backbone.

To get conformer “name,” list δεζ name of column, then αβγ of row, then second pucker (e.g., 3′ e m m t p 3′ for A form).
aUUCG tetraloop, suite 3–4.
bGNRA tetraloop, suite 1–2.
cGNRA tetraloop, suite 4–5 (past).
dA form double helix; 75% of total data.
ei to i + 1 base pair.
fNear A, dented inward, opposite S motif.
gSuite 1–2 of S motif.
hUUCG tetraloop, suite 1–2.
iUUCG tetraloop, suite 2–3.
jIntercalation.
Many of the specific peak pairs for the suite combinations of the 3D angle plots are found to correspond to specific previously described features of RNA structure. The global maximum, in the large peak for the A form double-helix conformation that accounts for 75% of the total data, is at 3′ e m m t p 3′. [Note: we abbreviate δ values as follows: near 84° for C3′endo pucker as 3′ and near 147° for the C2′ endo pucker as 2′; we use the m, p, t convention of Lovell et al. (20) for values near –60°, +60°, or 180°; and we give the actual angle value, suitably rounded, if there are two adjacent peaks or if the value is >40° off the major staggered position. Eclipsed ε is abbreviated as e. For suite conformations, both δ values are included.]
Gradual bending or twisting can be accommodated within the A form peak, whereas more abrupt local changes in the RNA backbone can be achieved by a significant shift in just one or two angles. Separating successive bases for intercalation is most often done by a shift in β value plus a C2′endo pucker for the second base. This common intercalation conformation appears as a distinct shoulder above A form in the α–β–γ C2′endo plot (Fig. 4b), centered near β = –135°; the successive bases are parallel but ≈7 Å apart, leaving just enough room for a flat aromatic intercalator to stack in between. This same conformer (3′ e m m –135 p 2′) is found in the high-resolution structures of small oligonucleotides with drugs intercalated (e.g., drb005 proflavin/CA, drb018 ethidium/UA) or in mid-sized aptamers (dr0005 biotin aptamer pseudoknot 26–7) and also in large RNAs with bases from elsewhere in the sequence acting as the intercalator (tr0001 tRNA Phe 8–9, pr0030 tRNA Arg 945–6, rr0033 23S rRNA 866–7). Changing just the β angle can move the two bases apart while keeping them parallel, because it happens that in A form, the C5′–O5′ bond around which β rotates is lined up parallel to the base planes. Various other conformers are seen for base-intercalation in the large RNAs, but this is the most common and the only one we can be sure is correct.
The well-known GNRA tetraloop motif (27) that closes the hairpin of many RNA stem-loops (rr0033 23S rRNA 805–6, pr0037 srp-RNA 154–5, ur0012 group I intron 150–1) is all A form except for the suite at residues 1–2 of the tetraloop, which makes the switch between base stacks. That conformer differs from A form in having α trans: 3′ emttp3′. The two base planes of the suite are approximately parallel and 7 Å apart, but their C1′ to N9 vectors point opposite rather than parallel, putting the G and A into separate base stacks rather than lining them up for intercalation, as the β change can do. Interestingly, the suite at residues 4–5, past the traditionally defined end of the tetraloop, also shows an unusual conformer: 3′ e m t t t 3′. The difference from A form is small but believable, because it occurs quite consistently including at atomic resolution (ur0007 sarcin/ricin loop 2662–3), and it produces a clearly observable shift of angle and offset between the stem base stack and the single-strand NRA stack of the tetraloop.
The UUCG tetraloop examples in our database are all at relatively low resolution, and their backbone conformations vary much more than for GNRA loops. They show a consensus for the nonclashing residues, however, of a series of three distinct non-A form conformers, for the three suites of the UUCG: 3′ e m p t m 2′, 2′ e m m t p 2′, and 2′ e p p t t 3′, as footnoted in Table 1.
A change in both ζ and the first sugar pucker of a suite can give successive bases that are coplanar and H bonded: 2′ e t m t p 3′. An i to i + 1 A-A base pair occurs in both the group I and II introns (ur0012 218–9; ur0019 17–18), and a successive G-U base pair is fairly common as part of the single-base bulge of the “loop E” or “S-motif” (28) (ur0007 sarcin/ricin loop 2655–6, rr0033 5S rRNA 78–9, rr0033 23S rRNA 175–6). This conformer helps populate the central peak on the C2′endo side of the δ–ε–ζ plot (Fig. 4c).
In quality-filtered data, nearly all β values are within 60° of trans. However, there is a substantial high-quality peak near β = 80°: 3′ e m –110 80 t 3′, with the second base nearly always an A. Although many angles are shifted, the change from A form double helix is more subtle than in the other examples above. The helical backbone is dented inward and shifted sidewise, the sugars are turned together just enough to make a good 2′OH to O4′ H bond, and the two successive bases of the suite pair toward opposite sides (first a sheared G-A, then an A-U) and do not stack with one another. In a symmetrical dimer such as ar0038, having this conformer on each strand shifts the entire double helix evenly to one side. More often (rr0033 5S 102–3, rr0016 (8)16S rRNA 906–7, ur0007 2664–5), there is an S motif bulge on the other strand with its i to i + 1 base pair forming a G-U-A base triple with the A of the β = 80° conformer.
Besides assigning well-defined peaks in dihedral-angle space to recognized, genuine RNA backbone conformations, it is at least equally important that some peaks in the unfiltered distributions can be definitively classed as errors and the examples refit in more comfortable conformers. These decisions were made by the combined evidence of (i) refitting specific examples in the interactive mage/probe system (29) with a dockable suite of RNA backbone, while maintaining good fit to the clear parts of the electron density; (ii) studying the systematic changes in percent occurrence of peaks as a function of the three quality filters; (iii) dramatic decreases in a given conformer when a large structure is redetermined more accurately; and (iv) whether an unusual conformation alters the surrounding phosphate or base positions enough for unambiguous identification in electron density maps. For instance, our disbelief in the small number of negative δ values in our dataset is strengthened by finding that all negative δ values in the original 2.4-Å 50S ribosome structure rr0011 became positive after rerefinement for rr0033.
The quality behavior of three different torsion-angle peaks, each starting out as 1–2% of the unfiltered data, can be contrasted strongly. The peak near β = 80° (see above) consistently increases or stays equal in percentage on application of any quality filter, doubling from 1% to 2% with a strong triple filter; although the difference from A form helix is modest, both phosphate and base positions change very recognizably. On the other hand, the α-β-γ ptm peak discussed below (1.2% of unfiltered data) tends to rise somewhat for C2′endo pucker when filtered but drops gradually to zero for strongly filtered C3′endo pucker. An even more extreme case of a pseudoconformer peak is for ε near 70°, which is 1.8% of the unfiltered data; plummets to 0.1% with mild filtering; and is completely absent with strong filters. Although quantitative results vary among clash, B, and resolution filters, all of the strong trends used here to eliminate or confirm potential backbone conformers are consistent, confirming that all three criteria are primarily measuring accuracy.
One of the most interesting and useful assignments of a disallowed pseudoconformer is the α-β-γ ptm combination for approximate A form. That peak is allowed in C2′endo pucker with the two bases not stacked, but within overall A form (defined by base positions), it swings the C5′ and its H atoms much too close to the previous sugar. This disallowed conformation is seen fairly often in structures at 2.3-Å or lower resolution (e.g., rr0033 541–2, 558–9, or 870–1, ur0019 61–2, url069 C 116–7), but it produces very bad all-atom clashes, and in all cases tested it could be successfully refit as standard A form (α-β-γ mtp and 3′ puckers). The rr0033 870–1 example is shown in Fig. 5a, with red spikes for the all-atom clashes. In Fig. 5b, the refit conformer is overlaid, with its favorable van der Waals contacts as green and blue dots. The sugar pucker changes from an intermediate δ of 124° to canonical 3′endo at 84°, and α and γ both change about 120° to standard A form values. As is typical at 2.4-Å resolution, the 2Fo–Fc electron density just necks down symmetrically and uninformatively between phosphate and sugar; original and rebuilt models each fit unimpressively but decently along one edge of the density, with unchanged phosphate and base positions. The rebuilt model also corrects a clash with the base and has greatly improved geometry. A water had originally been fit in space now used by the rebuilt model, but when that water is removed, the new model then makes good protein contacts. We have found no cases of the α–β–γ ptm3′ conformation within approximately A form structure that can be defended as correct, and its normalized peak size is lowered by all quality filters; therefore, we have rejected it as a possible backbone conformer.
Fig. 5.
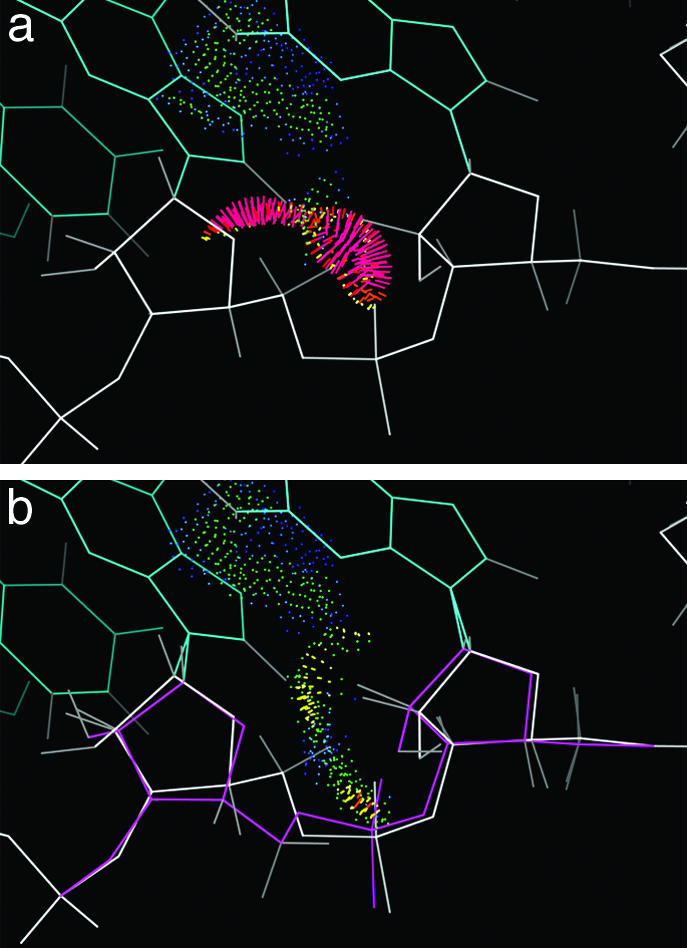
Identification and repair of an incorrect backbone conformation for suite 870–871 of the rr0033 23S rRNA. a shows the red spikes of bad clashes for the 5′ H atoms, in the original model with disallowed αβγδ values ptm3′; b shows good contacts for the refit model (magenta) in standard A form (mtp3′).
Discussion
This study establishes the feasibility of a full atomic-level analysis of RNA backbone conformation by demonstrating that the high noise level in the empirical torsion-angle distributions is due to data inaccuracies that can largely be eliminated, rather than being an intractably inherent property of the molecules themselves. Starting from a database improved by the landmark achievements of the ribosome structures and of crystallization for large RNAs at increasingly high resolution, the critical application of quality-analysis and filtering techniques has now permitted identification of a discrete, robust, and effective set of full torsion-angle conformers for RNA backbone.
This set of backbone conformers is analogous to the original sidechain rotamers defined for proteins by Ponder and Richards (30), and we hope it will be similarly influential both in helping the experimental determination of RNA structures by crystallography and NMR and also in the theoretical analysis of RNA conformation. As was true for the protein rotamers (20, 31), these RNA conformers will need revisions; based on new experimental data and further critical analysis, some peaks may be found erroneous and other rare ones added. This first cut of filtering and clustering, however, represents the major qualitative step of dramatic improvement over the raw data. For new structure determinations, the conformer list can be consulted to resolve ambiguities and avoid common misfittings, whereas the MolProbity service (21) at http://kinemage.biochem.duke.edu is available to add hydrogens and calculate all-atom contacts, with the results (as in Figs. 2 and 5) viewable in 3D online or downloadable. For any study that depends on the details of RNA structure, such as catalytic mechanism or differential binding of drugs or proteins, the same tools of critical analysis used in this study should be applied to the relevant structural data.
Future directions for this work aim at enhancing the usability of this new information for direct application in structural biology. Rules will be developed for a “key” to identify the correct RNA backbone conformation from those features most reliably observed in experimental maps, and then such procedures will be built into convenient software.
Supplementary Material
Acknowledgments
We thank Tom Steitz (Yale University, New Haven, CT) for structure factors of the rr0033 50S ribosome structure. This work was supported by National Institutes of Health Research Grants GM-61302 and GM-15000 and by a Howard Hughes graduate fellowship (to L.J.W.M.).
Footnotes
Datasets: ar0001, 02, 04, 05, 06, 07, 08, 09, 11, 12, 13, 20, 21, 22, 23, 24, 27, 28, 30, 32, 36, 38, 40, 44; arb002, 3, 4, 5; arf0108; arh064, 74; arl037, 48, 62; arn035; dr0005, 08, 10; drb002, 03, 05, 07, 08, 18; drd004; pd0345; pr0005, 06, 07, 08, 09, 10, 11, 15, 17, 18, 19, 20, 21, 22, 26, 30, 32, 33, 34, 36, 37, 40, 46, 47, 51, 53, 55, 57, 60, 62, 63, 65, 67, 69, 71, 73, 75, 78, 79, 80, 81, 83, 85, 90, 91; prv001, 04, 10, 20, 21; pte003; ptr004, 16; rr0005, 10, 16, 19, 33; tr0001; trna12; uh0001; uhx026; ur0001, 04, 05, 07, 09, 12, 14, 15, 19, 20, 22, 26; urb003, 08, 16; urc002; urf042; url029, 50; urt068; and urx053, 59, 63, 75.
References
- 1.Kruger, K., Grabowski, P. J., Zaug, A. J., Sands, J., Gottschling, D. E. & Cech, T. R. (1982) Cell 31, 147–157. [DOI] [PubMed] [Google Scholar]
- 2.Nissen, P., Hansen, J., Ban, N., Moore, P. B. & Steitz, T. A. (2000) Science 289, 920–930. [DOI] [PubMed] [Google Scholar]
- 3.Joyce, G. F. (2002) Nature 418, 214–221. [DOI] [PubMed] [Google Scholar]
- 4.Davis, P. W., Adamiak, R. W. & Tinoco, I. J. (1990) Biopolymers 29, 109–122. [DOI] [PubMed] [Google Scholar]
- 5.Frank, J. (2001) BioEssays 23, 725–732. [DOI] [PubMed] [Google Scholar]
- 6.Cate, J. H., Gooding, A. R., Podell, E., Zhou, K., Golden, B. L., Kundrot, C. E., Cech, T. R. & Doudna, J. A. (1996) Science 273, 1678–1685. [DOI] [PubMed] [Google Scholar]
- 7.Ban, N., Nissen, P., Hansen, J., Moore, P. B. & Steitz, T. A. (2000) Science 289, 905–920. [DOI] [PubMed] [Google Scholar]
- 8.Wimberly, B. T., Brodersen, D. E., Clemons, W. M. J., Morgan-Warren, R. J., Carter, A. P., Vonrhein, C., Hartsch, T. & Ramakrishnan, V. (2000) Nature 407, 327–339. [DOI] [PubMed] [Google Scholar]
- 9.Schluenzen, F., Tocilj, A., Zarivach, R., Harms, J., Gluehmann, M., Janell, D., Bashan, A., Bartels, H., Agmon, I., Franceschi, F. & Yonath, A. (2000) Cell 102, 615–623. [DOI] [PubMed] [Google Scholar]
- 10.Word, J. M., Lovell, S. C., LaBean, T. H., Taylor, H. C., Zalis, M. E., Presley, B. K., Richardson, J. S. & Richardson, D. C. (1999) J. Mol. Biol. 285, 1711–1733. [DOI] [PubMed] [Google Scholar]
- 11.Reijmers, T. H., Wehrens, R. & Buydens, L. M. (2001) J. Chem. Inf. Comput. Sci. 41, 1388–1394. [DOI] [PubMed] [Google Scholar]
- 12.Murthy, V. L., Srinivasan, R., Draper, D. E. & Rose, G. D. (1999) J. Mol. Biol. 291, 313–327. [DOI] [PubMed] [Google Scholar]
- 13.Hershkovitz, E., Tannenbaum, E., Howerton, S. B., Sheth, A., Tannenbaum, A. & Williams, L. D. (2003) Nucleic Acids Res., in press. [DOI] [PMC free article] [PubMed]
- 14.Duarte, C. M. & Pyle, A. M. (1998) J. Mol. Biol. 284, 1465–1478. [DOI] [PubMed] [Google Scholar]
- 15.Duarte, C. M., Wadley, L. M. & Pyle, A. M. (2003) Nucleic Acids Res. 31, 4755–4761. [DOI] [PMC free article] [PubMed] [Google Scholar]
- 16.Szép, S., Wang, J. & Moore, P. B. (2003) RNA 9, 44–51. [DOI] [PMC free article] [PubMed] [Google Scholar]
- 17.Murthy, V. L. & Rose, G. D. (2003) Nucleic Acids Res. 31, 502–504. [DOI] [PMC free article] [PubMed] [Google Scholar]
- 18.Richardson, J. S. & Richardson, D. C. (2002) in International Tables for Crystallography, eds. Rossmann, M. G. & Arnold, E. (Kluwer, Dordrecht, The Netherlands), Vol. F, pp. 727–730. [Google Scholar]
- 19.Richardson, J. S., Arendall, W. B., III & Richardson, D. C. (2003) in Methods in Enzymology: Macromolecular Crystallography, eds. Carter, C.W., Jr., & Sweet, R. M. (Academic, New York), Vol. 374, in press.
- 20.Lovell, S. C., Word, J. M., Richardson, J. S. & Richardson, D. C. (2000) Proteins 40, 389–408. [PubMed] [Google Scholar]
- 21.Lovell, S. C., Davis, I. W., Arendall, W. B., III., de Bakker, P. I. W., Word, J. M., Prisant, M. G., Richardson, J. S. & Richardson, D. C. (2003) Proteins 50, 437–450. [DOI] [PubMed] [Google Scholar]
- 22.Berman, H. M., Olson, W. K., Beveridge, D. L., Westbrook, J., Gelbin, A., Demeny, T., Hsieh, S.-H., Srinivasan, A. R. & Schneider, B. (1992) Biophys. J. 63, 751–759. [DOI] [PMC free article] [PubMed] [Google Scholar]
- 23.Word, J. M. (2000) Ph.D. thesis (Duke Univ., Durham, NC).
- 24.Word, J. M., Lovell, S. C., Richardson, J. S. & Richardson, D. C. (1999) J. Mol. Biol. 285, 1735–1747. [DOI] [PubMed] [Google Scholar]
- 25.Richardson, D. C. & Richardson, J. S. (1992) Protein Sci. 1, 3–9. [DOI] [PMC free article] [PubMed] [Google Scholar]
- 26.Malathi, R. & Yathindra, N. (1985) J. Biomol. Struct. Dyn. 3, 127–144. [DOI] [PubMed] [Google Scholar]
- 27.Heus, H. A. & Pardi, A. (1991) Science 253, 191–194. [DOI] [PubMed] [Google Scholar]
- 28.Leontis, N. B. & Westhof, E. (1998) J. Mol. Biol. 283, 571–583. [DOI] [PubMed] [Google Scholar]
- 29.Word, J. M., Bateman, R. C., Jr., Presley, B. K., Lovell, S. C. & Richardson, D. C. (2000) Protein Sci. 9, 2251–2259. [DOI] [PMC free article] [PubMed] [Google Scholar]
- 30.Ponder, J. W. & Richards, F. M. (1987) J. Mol. Biol. 193, 775–791. [DOI] [PubMed] [Google Scholar]
- 31.Dunbrack, R. L. & Cohen, F. E. (1997) Protein Sci. 6, 1661–1681. [DOI] [PMC free article] [PubMed] [Google Scholar]
Associated Data
This section collects any data citations, data availability statements, or supplementary materials included in this article.