

Abstract
The environmental topology of complex structures is used by Escherichia coli to create traveling waves of high cell density, a prelude to quorum sensing. When cells are grown to a moderate density within a confining microenvironment, these traveling waves of cell density allow the cells to find and collapse into confining topologies, which are unstable to population fluctuations above a critical threshold. This was first observed in mazes designed to mimic complex environments, then more clearly in a simpler geometry consisting of a large open area surrounding a square (250 × 250 μm) with a narrow opening of 10–30 μm. Our results thus show that under nutrient-deprived conditions bacteria search out each other in a collective manner and that the bacteria can dynamically confine themselves to highly enclosed spaces.
From the beginning of the modern study of bacterial chemotaxis, the process of chemotaxis has been viewed in terms of individual bacterial cells seeking out a better environment (1–3). In Escherichia coli, response to gradients of attractants and repellents is mediated by five transmembrane chemoreceptors: Tsr, Tar, Aer, Trg, and Tap (1, 2). Tsr, the serine receptor, is the most abundant chemotaxis receptor in E. coli, whereas Tar, the aspartate receptor, is also present at relatively high levels. Aer, the aerotaxis receptor, is present at low levels, but still effectively modulates chemotaxis. Tap mediates response to dipeptides, whereas Trg mediates responses to galactose and ribose (4). The complex sensing machinery of chemotaxis is not restricted to signals received from the environment. Bacteria can also interact with each other by chemotactic signaling through the chemoreceptors. A striking example is Budrene and Berg's observation that E. coli form patterns when grown on succinate in semisolid agar (5). Under these conditions, the cells both produce and sense aspartate. The initial work of Budrene and Berg was important because it showed that bacteria could form highly condensed structures by chemotactic communication. In their work the response depended on the presence of high levels of succinate that feed into the tricarboxylic acid cycle, resulting in the production of l-aspartate; the patterns seen were predominantly due to gradients in the local succinate concentration rather than intercellular communication.
These patterns are not of mere academic interest. Many selective advantages have been proposed for such collective behavior of bacteria (6, 7). One example is that many species of bacteria form biofilms on surfaces that allow the cells to resist antibiotics and environmental stresses (8, 9). The ability to form a biofilm clearly depends on the cells being able to congregate, reach sufficient density to form highly structured environments, and respond to the high density of other cells. The modification of the gene-expression profile of bacteria above a critical cell density is a phenomenon now called quorum-sensing (10). In the past, quorum-sensing was considered primarily in terms of bulk cell growth (11, 12). However, cell–cell communication and chemotaxis might be a much more effective strategy for bacteria to actively form a quorum within a small cavity, as we have recently shown (13).
Microfabrication can be used to create defined, complex micrometer-scale environments to excite and examine the collective behavior of microorganisms. A clever example of microfabrication to probe cell chemotaxis was the use of a maze to observe the collective behavior of slime mold (14). In this communication we explore in some detail both the design and construction of micro-fabricated structures we have used to observe cell–cell communication in E. coli.
Methods and Materials
Bacterial Strains. All strains listed in Table 1, except HCB317, were derivatives of the chemotactically wild-type strain E. coli RP437 and were transformed with pGFPmut2 (20) for ease of cell visualization. KX1485 (also referred to as PS2407) was constructed from RP437 by P1 transduction from KX1200. KX1200 is a derivative of MG1655 with the luxS gene replaced by a chloramphenicol resistance gene (ref. 21; K. Xavier and B. L. Bassler, personal communication). The absence of autoinducer 2 production in PS2407 and its presence in RP437 was confirmed by using the Vibrio harveyi reporter strain BB170 assay (11).
Table 1. Bacterial strains.
Growth Conditions. Cells were grown in LB broth, tryptone broth (TB), or minimal (M9) glycerol medium in a round polypropylene tube (12 × 75 mm) containing 1.5 ml of medium with aeration at 28–30°C. Difco LB medium (Becton Dickinson) consists of 0.5% yeast extract, 1% tryptone, and 1% NaCl prepared in deionized H2O and adjusted to pH 7.2. TB contained 1% Difco tryptone and 1% NaCl. M9 glycerol medium (Amresco, Solon, OH) consists of 6 mg/ml Na2HPO4, 3 mg/ml KH2PO4, 0.5 mg/ml NaCl, and 1 mg/ml NH4Cl at pH 7.2, supplemented with 1% glycerol, 2 mM MgSO4, 0.1 mM CaCl2, and 500 μg/ml each l-threonine, l-leucine, l-histidine, l-methionine, and thiamine. Ampicillin (50 μg/ml) was added to all media to maintain the GFP plasmid.
Cells were grown in M9 glycerol medium and aliquots were removed at different time points. The cells were pelleted by centrifugation at 12,000 rpm, and the supernatant was sterile filtered, frozen, and later analyzed. Free amino acid analyses of uninoculated and conditioned medium were performed on a Beckman model 6300 dedicated amino acid analyzer by the Scientific Research Consortium (St. Paul; www.aminoacids.com). Absorbance was measured at 440 and 570 nm after postcolumn color development by ninhydrin reagent at a constant temperature of 131°C (22). Glucosaminic acid (Sigma-Aldrich) was added to the medium as the preferred internal standard.
Preparation. The maze was generated by randomly generating edges (walls) on a square lattice (100 × 100 μm) with percolation probability P = 0.4 (23). The walls of the maze were 20 μm wide. Two opposing edges of the lattice were sealed, whereas the other two edges were open to allow for the introduction of medium. The pattern of the maze was printed on a transparent film by using a high-resolution Imagesetter (ECRM Imaging Systems, Tewksbury, MA) with an accuracy of 10 μm. The transparent film served as a mask for the subsequent photolithography. We similarly made masks for devices with single or multiple square enclosures (250 × 250 μm) with single-entrance channels from 10 to 30 μm wide, although with 100-μm-thick walls. Fig. 1 outlines the procedure used to fabricate our polydimethyl-siloxane (PDMS) devices (24). Thick photoresist (SU-8 10, MicroChem, Newton, MA) was spin-coated onto a polished silicon wafer to create a mold master with 30-μm-thick structures. The spin-coated wafer was exposed to UV light through the mask by an MA-6 aligner (SUSS MicroTec, Waterbury Center, VT). Unexposed resist was removed with SU-8 developer, and a raised surface remained that was the negative of the desired structure and served as a mold. The final step was to cast a maze from the biologically inert polymer PDMS (Sylgard 184, Dow Corning), which was heat-cured on the mold and then peeled away. Just before use, the PDMS structure was briefly treated in an oxygen plasma generator (150 mM Torr, 100 W) for 1 min to render it hydrophilic and to enable the PDMS to seal to the base material. In most cases, the base was a clean, oxygen plasma-treated glass microscope slide, although as mentioned below sometimes the base material was a gas-permeable polystyrene membrane called Opticell (Biocrystal, Westerville, OH). Three to 20 μl of a culture of cells were loaded into the PDMS structure through open edges on reaching an OD of 0.8 A/cm at 600 nm. Cells were loaded directly into the PDMS structures through open edges. Evaporation of the medium between measurements was prevented by keeping the microscope slide with the chamber on an elevated platform in a closed Petri dish with a layer of water across the bottom. Optimal cell congregation was obtained by maintaining the chamber at 28°C during the experiment.
Fig. 1.

Schematic diagrams of the fabrication process (A) and a single-square chip (B).
Tracking of cells expressing GFP was done by using Nikon SMZ1500 stereoscopic microscope with a P-FLA fluorescence attachment coupled to a Qimaging Retiga 1300 digital charge-coupled device camera (Burnaby, BC, Canada) by using 488 nm illumination from a Hg arc lamp. The images were processed for display by using photoshop software (Adobe Systems, Mountain View, CA) and analyzed by using the public domain nih image (http://rsb.info.nih.gov/nih-image/).
Results
E. coli expressing GFP in media were loaded into a maze constructed of silicone elastomers, care being taken to use bacteria in midlog phase (OD at 600 nm equal to 0.8 A/cm). We initially constructed mazes under the assumption that bacterial chemotaxis through a maze could be viewed as a solitary effort by the bacteria to disperse throughout this complex environment. However, Fig. 2 shows how, as a function of time, the initially uniform distribution of bacteria became inhomogeneous as the bacteria clustered into confining places within the maze. In all cases shown in this article, the bacteria are actively swimming and they dynamically cluster into the small volumes.
Fig. 2.
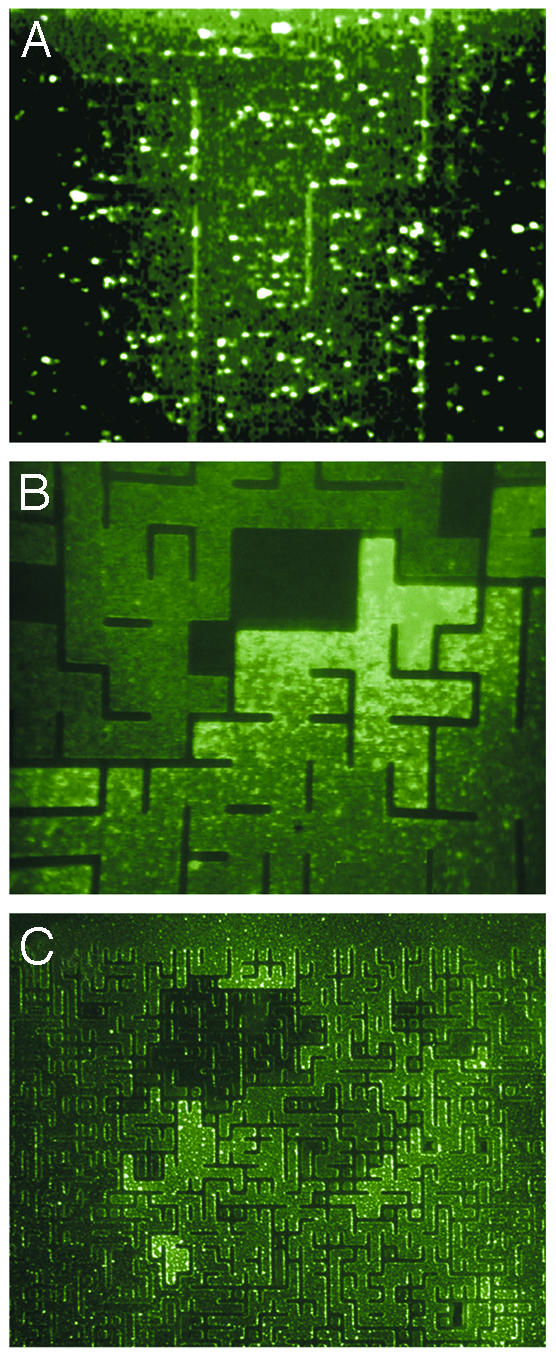
Epifluoresence images of GFP-expressing E. coli in a random maze. (A) Cells in the maze immediately after being loaded with a culture of a wild-type E. coli (RP437) in LB. (Magnification, ×600.) (B) Dynamical accumulation of cells at 2 h after the initial loading, showing accumulation in a “dead-end” part of the maze. (Magnification, ×400.) (C) Accumulation of cells into several different confining regions. No clustering is seen in the open region seen at the top. (Magnification, ×40.)
The fundamental phenomenon seen in Fig. 2 is the accumulation of the E. coli into confining areas of the maze. This accumulation only occurs for chemotactic bacteria. Motile, but nonchemotactic cells (PS2002), do not produce such patterns (data not shown). This lack of pattern formation shows that motility alone is not sufficient for this behavior. The clustering is also not due to oxygen consumption by the bacteria; the PDMS used to build our confined structure has high gas permeability (25), and the same clustering was seen when the silicone elastomer structures were placed on OptiCell, a gas-permeable membrane used in cell culture (data not shown).
A simpler topology than the maze, which still probes the essential elements of this bacterial communication, is an enclosed square that has a single inlet channel. This simple topology probes the ability of bacteria to communicate, because the enclosed 2D volume will provide a natural center for accumulation of cells. Fig. 3 shows that in a microfabricated environment it is possible to observe true congregation effects driven by confinement. We constructed a square box having a 250-μm length with a narrow channel (width, 30 μm) leading out of it. Fig. 3 shows several dramatic phenomena. In A–C, traveling waves of wavelength λ ≈ 500 μm are observed traveling through the open part of the structure. In B–D, the bacteria are observed to swim into the small square and cluster there to very high densities. Fig. 3B Inset shows local density of bacteria around the opening where the attractant gradient is highest. As with the maze structure, nonchemotactic cells do not show this response.
Fig. 3.
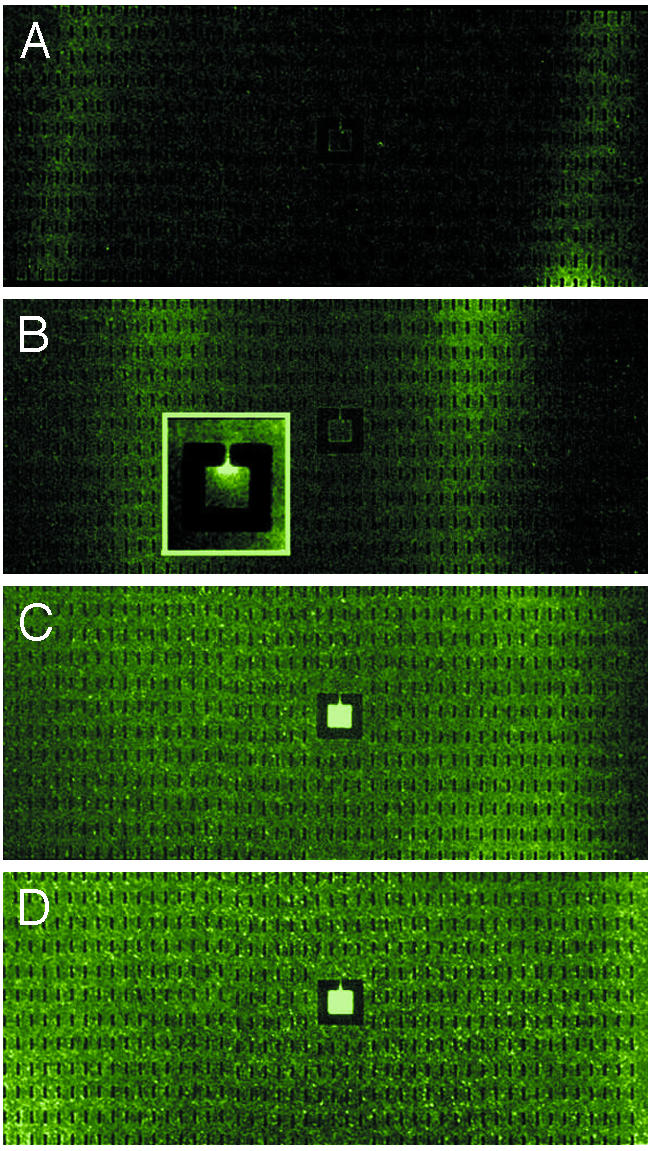
Epifluoresence images of RP437 E. coli grown in LB medium in a large open area with a center square. The center square is 250 μm per side and has a 30-μm-wide channel leading to the center. A culture of cells grown in LB are filled from both ends into a dry device, so the initial bacteria density is uniform. The small black rectangles are PDMS pillars that support the roof of the device. (A) Fifteen minutes after filling. (B) Thirty minutes after filling. (Inset) The pattern of E. coli around the opening at higher magnification. (C) Sixty minutes after filling. (D) Ninety minutes after filling.
Because complex media such as LB contain a significant amount of several attractants, such as l-aspartate and l-serine, a simpler medium, M9 glycerol medium, was selected to show that bacteria are not chasing residual attractants in the medium. The same conditions were used as with conditioned LB and clearly showed the bacteria accumulated in the center square. The first appearance of waves was within 15–30 min after filling the chip with the bacteria (Fig. 4 A and B). Each wave generated at both edges continuously moved toward the center and took 1 h to finally meet each other. The speed (1 mm/h) of the waves in M9 is approximately two times slower than the speed (2 mm/h) of the waves in LB. This difference in speeds seems to be related to the slower production rate of attractant in M9 than in LB. The waves merged and simultaneously leached into the square (Fig. 4 C–F). The square was saturated with bacteria (Fig. 4G), and the clustering in the square faded away after an additional hour (Fig. 4H).
Fig. 4.

Epifluorescence image of RP437 cells grown in M9 glycerol medium. Bacteria are inoculated from both ends into a dry device, so the initial bacteria density is uniform. The center square is 250 μm per side and has a 10-μm-wide channel leading to the square. The chip was photographed at 15 min (A), 30 min (B), 1 h (C), 1 h 30 min (D), 2 h (E), 2 h 30 min (F), 3 h 30min (G), and 5 h (H).
To determine which chemoreceptor might be involved, we tested several different strains in the apparatus. Whereas tsr-deleted strains (RP5700 and HCB317) were unable to congregate into the square, tar- or aer-deleted strains (RP2361 and UU1117) showed waves and accumulation in the square, as shown in Fig. 5. These results indicate that the serine receptor (Tsr) is required for the collective behavior. The behavior was suppressed when substances sensed by the serine receptor were added to a culture of RP437 grown in LB just before filling the apparatus; addition of saturating levels of l-serine (0.5–10 mM) completely suppressed waves and accumulation, whereas addition of saturating levels of l-aspartate (0.5–10 mM) did not suppress the behavior. The collective behavior was suppressed when the cells were treated with chloramphenicol to inhibit protein synthesis, suggesting that the observed behavior depends to some degree on gene expression and growth. Washing into either fresh or conditioned M9 medium did not suppress the collective behavior. Also, the collective behavior either was not suppressed when cells were resuspended into cell-free conditioned LB medium prepared from the cells. However, suppression occurred when cells were washed in fresh LB medium, indicating that, as expected, attractants in fresh LB overwhelm the chemoreceptors of cells. Table 2 summarizes our full results. A “+” was scored if the local intensity in the small square increased a factor of 2-fold over the background within 1–3 h (depending on the medium) after the device was filled with 3 μl of cell culture. A “–” was scored if the background did not rise more than a factor of 2-fold over background within 1–3 h (depending on the medium).
Fig. 5.

Comparison between the Δtar (RP2361) (A–D) and Δtsr (RP5700) (E–G) strains. The pictures are spaced at 15 min (A and D), 30 min (B and E), 60 min (C and F), and 90 min (D and G) after filling the chip with a culture of cells.
Table 2. Summary of bacterial behavior.
| E. coli strain, condition | Congregation into square |
|---|---|
| Wild type (RP 437), cLB | + |
| RP437, fresh LB | - |
| RP437, cMGM | + |
| RP437, fresh MGM | + |
| RP437, cTB | + |
| RP437, cLB + 10 μg/ml chloramphenicol | - |
| RP437, cLB + 0.5-10 mM l-serine | - |
| RP437, cLB + 0.5-10 mM l-aspartate | + |
| ΔcheA—Z (PS2002), cLB | - |
| Δtar (RP2361), cLB | + |
| Δtar (RP2361), cMGM | + |
| Δtsr (RP5700), cLB | - |
| Δtsr (RP5700), cMGM | - |
| Δtsr (HCB 317), cLB | - |
| Δtsr (HCB 317), cMGM | - |
| Δaer (UU1117), cLB | + |
| Δaer (UU1117), cMGM | + |
| ΔluxS (KX1485), cLB | + |
| ΔluxS (KX1485), cMGM | + |
cLB, conditioned LB; cMGM, conditioned Mg, glycerol medium; cTB, conditioned TB.
Having determined that accumulation of the cells is mediated by Tsr, our concern was the exact identity of the secreted molecule or molecules being used by the E. coli for interbacterial communication. One possibility we considered is that the behavior observed depends on the bacteria's ability to synthesize the quorum-sensing molecule autoinducer 2 (26). However, experiments with a ΔluxS derivative of RP437, KX1485 (11), show the same rate and pattern of congregation in the enclosure (data not shown). From this finding we conclude that autoinducer 2-dependent quorum-sensing is not required. Because no acyl-homoserine lactone quorum-sensing system has been identified in E. coli, it seems that this motility-based quorum formation does not depend on any known quorum-sensing systems in E. coli.
An analysis of free amino acid content of the culture supernatant from minimal growth medium shown in Fig. 6 indicates that glycine is the excreted attractant responsible for the congregation behavior. Glycine is an attractant sensed by Tsr. The glycine concentration rises with time, beginning with early-exponential phase (OD600 = 0.2), suggesting that it is being continuously excreted. Although other attractants (l-aspartate, l-glutamate, and l-alanine) were also detected, these attractants could not be responsible for the observed congregation behavior. l-Aspartate and l-glutamate are ligands for Tar, deletion of which did not abolish the behavior. l-Alanine is a ligand for Tsr receptor (27). A separate amino acid analysis of conditioned LB medium showed that only the concentration of glycine steadily increased during the exponential phase, whereas l-serine was not detected at this period (data not shown). A similar amino acid excretion profile has been found in other work (28). In the stationary phase, the concentration of glycine decreased and, if cells at this growth stage were loaded into the device, the collective behavior was not observed.
Fig. 6.

OD (A) and extracellular amino acid concentration (B) plotted as a function of time for RP437 cells grown in M9 glycerol medium.
Discussion
The dynamical clustering of the bacteria we have depicted here should be amenable to mathematical analysis. Two separate but related phenomena exist that we would like to understand quantitatively: the formation of traveling waves that move along walls and the subsequent collapse of the cell density into small confining squares that the wave passes. We first discuss an analytical description of the formation of the waves with antinodes against the walls and then discuss the subsequent clustering of the bacteria in the square as driven by the attractant response.
We choose as the starting point the equations derived by Keller and Segel which were originally derived to explain slime-mold aggregation (29), and have been expanded by Brenner et al. to allow for wave propagation in bacterial colonies (30). As Schnitzer et al. (31) have pointed out there are approximations involved in these equations which render them less than of general applicability, but their analytical simplicity provides a starting point toward more sophisticated analysis beyond the scope of this paper. Our main purpose here is to discuss the influence of boundaries on the patterns.
The basic foundation of chemotaxis for motile bacteria such as E. coli is the fact that due to their random tumbling after runs of constant speed swimming for some time, τ, they can be considered to have an effective (nonthermal) “diffusion coefficient,” Db. They can also respond presumably by alterations in swimming speed, ν, or in the period between tumbles, τ (which are not equivalent), to local concentrations of chemicals, either food or attractants. Because we clearly see propagating waves of bacteria, we follow Brenner et al. and include generic “food” equations. The food equation which connects the production of chemoattractant to the local concentration of some sort of metabolic source f is needed if we are to have wave propagation within the bacterial population, because without consumption of food, no effective restoring force is generated for wave generation. We will assume that the bacteria of local density ρ produce the attractant, c, at a rate given by ∂c/∂t = βfρ, where f is an external food concentration necessary for chemoattractant production and β is the metabolic coefficient linking food concentration f and chemoattractant production ∂c/∂t. β has dimensions of 1/concentration-time. For simplicity here, we treat β as a constant.
The flux J of bacteria is given by
 |
[1] |
where κ is the “chemotactic coefficient” achieved by a signaling path and results in an alteration in ν and/or τ. We use a form of the Keller–Segel equations as modified by Brenner et al.:
 |
[2] |
 |
[3] |
 |
[4] |
where f is the concentration of the food used to produce the chemoattractant, Dc is the (thermal) diffusion coefficient of the chemoattractant, α is the growth coefficient of the bacteria, γ is the rate at which food is consumed by the bacteria, and Df is the diffusion constant of the food.
This set of coupled nonlinear differential equations is unfortunately difficult to solve analytically. We can make a few observations that provide intuitive guidance. If all of the time derivatives are set to zero (steady-state conditions) and the food concentration is constant, solutions exist to Eqs. 2 and 3 of the form ρ(x) ≈ ρosech2[x/l], where l is a length given by  . Note that the width of the solitary wave is inversely proportional to the amplitude of the wave as befits a nonlinear wave. In the presence of a wall boundary, the wall is always an antinode for the sech2 function, and, in fact, we always observe solitary waves that have antinodes at the wall (Fig. 7). Thus, we can say that the sech2 function is a basis function for the waves, the presence of walls leads to antinodes (high concentrations) of bacteria and serves to guide the solitary waves along the wall, and, as the concentration of the bacteria grows, the wave steepens. The food consumption term, Eq. 4, is necessary for the generation of propagating waves because it provides a restoring force to the bacterial density as food is consumed and reduces chemoattractant production. Because the food is consumed to generate the chemoattractant, as the waves collide with each other, they cannot propagate after the collision; that is also observed in our data, and thus the solitary waves we observe are not true solitons.
Fig. 7.

Wild-type E. coli collapsing into confining squares in LB broth. The collapse of the population into the squares is shown as a function of time. Waves launch within the confining structure (A), steepen (B), and finally localize in the small squares (C). Each frame is separated by 1 h. Simulations of Eqs. 2–4, with bacterial growth set to zero, are shown below the microphotographs.
Although Eqs. 2–4 are analytically intractable, they can be numerically simulated by using the mathematical package matlab (MathWorks, Natick, MA). For these simulations we set the growth coefficient α equal to zero. In the matlab program, space was cut into a n × n grid and three sets of 3D arrays were computed on this grid: b(i, j, t) was used to record the bacteria density in each grid element, where i; j denotes the coordinates of the x, y direction, and t denotes the coordinate of time, c(i, j, t) was used to compute the concentration of chemoattractant, and f(i, j, t) was used to compute the food concentration. The values of the grid elements next to the boundary walls were set to the same values as the values of the one adjacent element in the grid, according to the no-flux boundary condition at the walls.
This simulation of the bacterial dynamics was informative. For example, the formation of a solitary wave of cells, which we discussed above, is more than a curiosity; it self-generates a high-density wave of cells, which, once it hits the opening of the square, initiates the population collapse into the square, i.e., the wave guarantees that the local concentration of bacteria will exceed a critical collapse concentration that we discuss below. Fig. 7 shows a dramatic example of this searching ability of a wave guided by a confining boundary: a wave launches into an inner region and the population collapses into the small square. We also show in Fig. 7 how the basic set of Eqs. 2–4, when numerically simulated, are able to basically reproduce this behavior.
We now discuss the collapse of the bacterial population into a small square with a narrow opening, which is different from the wave propagation but connected to it, because it requires a chemoattractant response by the bacteria. We do this study by a stability analysis of a bacterial population to changes in the cell density in the presence of a chemoattractant response. This instability is triggered by the passage of a solitary cell wave guided by the walls of the structure and leads to the ultimate population collapse into the small square.
Consider a small volume, Vs, containing a bacterial number density, ρ, and attractant concentration, c, connected to a much larger volume, Vo, by an opening of cross-sectional area, S = Wh, where W is the width of the opening and h is the height of the opening. As a wave passes, more bacteria diffuse into the small volume and perturb the bacterial density in the volume by an amount δρ, and the concentration of bacteria outside becomes ρo. After the crest of the wave passes we can ask what is the subsequent fate of the bacteria in the volume. Ordinarily they would diffuse out and the density would return to the initial density, but this is a nonlinear system with positive feed back due to the chemoattractant that brings cells into the volume.
Let then the concentration of bacteria in the small volume have a increase δρ due to the passage of the solitary wave. Because the wave passes relatively quickly compared with cell growth and food consumption rates, we set the food production rate of chemoattractant βf as constant and assume that the bacterial population has no growth during this rapid process. The flux Jb of bacteria through the opening S and of chemoattractant Jc is from Eq. 1, to first order in the perturbation terms:
 |
[5] |
 |
[6] |
where lb and lc are characteristic lengths of decay of bacterial and attractant densities outside the opening. These decay lengths are a function of the external topology of the structure, and we will leave them as numbers for the discussion because they are topology-dependent.
Let us see how the small density perturbation δρ inside Vs evolves with time. Without chemotaxis the perturbation will soon disappear because of diffusion. Chemotaxis, however, changes the picture dramatically. A positive change in bacterial density, δρ, within the volume, Vs, induces a change in the chemoattractant density, δc, inside Vs. This change in turn induces an inward chemotactic flux, which, under favorable circumstances, cancels the diffusion of bacteria out of Vs, as is clear from Eq. 5. At some critical concentration, ρcrit, of bacteria outside the volume, the rate of change of the densities of the bacteria and the chemoattractant is zero; above that value the population of bacteria inside the square exponentially rises with time (population collapse). We can find ρcrit after a perturbation by setting the fluxes equal to zero:
 |
[7] |
 |
[8] |
Some algebra then yields
 |
[9] |
Note that the critical concentration of bacteria, ρcrit, is independent of lc but inversely dependent on the nonthermal lb, and intuitively is larger the bigger the ratio (DbDc)/(κβf) is. In addition, the ratio of the area of the opening to the volume should be made as small as possible to make the critical concentration small, which explains why our trapping volume with S/Vs = 4 × 10⁻⁴ μm–1 was so effective at trapping bacterial densities, as seen in Fig. 7 as the wave seeds the smaller S/V structures. We can now see the importance of the solitary waves that arise from the Brenner–Budrene–Keller–Segel equations. The waves are guided along the wall of a structure, perturb the bacterial populations in small volumes along the wall, and pass the critical population where the spatial collapse of the population occurs. The pulse of concentration could seed the construction of a biofilm just as quorum-sensing genes cause change of gene expression.
Finally, we discuss the rate at which the small volume fills with bacteria due to this chemoattractant-driven flux. If the filling of the volume by active movement of the bacteria proceeds at a rate faster than the diffusion times of the bacteria and the chemoattractant, we can simply obtain from Eqs. 5 and 6 the following differential equation:
 |
[10] |
which yields an exponential growth in time for the perturbation
 |
[11] |
which holds until our gross assumptions concerning constant food supplies, no growth, and no diffusion break down. Fig. 8 shows that this predicted exponential growth does occur as the volume dynamically fills; in this particular case the time constant τ = (κSρcritβf/Vslc)–1/2 is determined to be 22 ± 1 min.
Fig. 8.

Relative density of the bacteria in the center rectangle (solid squares) shown in Fig. 3 as determined from relative optical luminance vs. time after the passage of a wave at time t = 0. The relative density was determined by measuring the average gray-scale luminance in the square and subtracting the average gray-scale luminance in an equal area on either side of the square in Fig. 3. As the wave passes, this number can become negative. The solid curve is a fit to the increase in density.
Conclusions
In general, chemotaxis has been considered to be a sensing mechanism whereby individual bacterial cell disperses for exogenous sources of nutrients. Here, we have shown that, when the exogenous nutrients are depleted, cells respond to a gradient of chemoattractant that they excrete themselves. In a closed system, starved cells will sense and be attracted to nutrients emanating from other cells, including metabolic end products released from intact cells and the content of lysed dead cell bodies. We have found that, in the presence of appropriate environmental topologies, stressed bacteria will actively form solitary waves of bacteria and that these waves nucleate population collapse of the bacteria into the smallest confining structures that the wave passes. This finding may represent an important and previously unappreciated role for the bacterial chemotaxis system. It may be a much more effective strategy for bacteria to use their motility to actively collapse into a small cavity, rather than wait until the bulk density of bacteria reaches the necessary threshold. During periods of stress, such directed searching of confined structures may be critical for bacterial survival. In principle the mathematics describing this process can be used to quantitatively model the data, but we have at present too many variables and no local probes of critical quantities.
Acknowledgments
We thank R. Parkinson for strains and advice, H. C. Berg for strain HCB317 and advice, B. Bassler for strain BB170, M. Taga and K. Xavier for advice and assistance, C. Gabel for discussions, W. Austin for technical assistance, and J. Chen for swarm-plate assays. This work was supported by grants from the Defense Advanced Research Planning Agency (MDA972-00-1-0031), the National Institutes of Health (HG01506), and the State of New Jersey (NJCST 99-100-082-2042-007). P.S. is supported in part by Delegation Generale de l'Armement.
Abbreviations: PDMS, polydimethyl-siloxane; TB, tryptone broth.
References
- 1.Adler, J. (1966) Science 159, 708–716. [DOI] [PubMed] [Google Scholar]
- 2.Adler, J. (1969) Science 166, 1588–1597. [DOI] [PubMed] [Google Scholar]
- 3.Berg, H. C. (1975) Nature 254, 389–392. [DOI] [PubMed] [Google Scholar]
- 4.Adler, J. (1975) Annu. Rev. Biochem. 44, 341–356. [DOI] [PubMed] [Google Scholar]
- 5.Budrene, E. O. & Berg, H. C. (1991) Nature 349, 630–633. [DOI] [PubMed] [Google Scholar]
- 6.Tsimring, L., Levine, H., Aranson, I., Ben-Jecob, E., Cohen, I., Shochet, O. & Reynolds, W. N. (1995) Phys. Rev. Lett. 75, 1859–1862. [DOI] [PubMed] [Google Scholar]
- 7.Donlan, R. M. & Costerton, J. W. (2002) Clin. Microbiol. Rev. 15, 167–193. [DOI] [PMC free article] [PubMed] [Google Scholar]
- 8.Pratt, L. A. & Kolter, R. (1998) Mol. Microbiol. 30, 285–293. [DOI] [PubMed] [Google Scholar]
- 9.Davies, D. G., Parsek, M. R., Pearson, J. P., Iglewski, B. H., Costerton, J. W. & Greenberg, E. P. (1998) Science 280, 295–298. [DOI] [PubMed] [Google Scholar]
- 10.Bassler, B. L. (2002) Cell 109, 421–424. [DOI] [PubMed] [Google Scholar]
- 11.Surette, M. G. & Bassler, B. L. (1998) Proc. Natl. Acad. Sci. USA 95, 7046–7050. [DOI] [PMC free article] [PubMed] [Google Scholar]
- 12.Swift, S., Downie, J. A., Whitehead, N. A., Barnard, A. M., Salmond, G. P. & Williams, P. (2001) Adv. Microb. Physiol. 45, 199–270. [DOI] [PubMed] [Google Scholar]
- 13.Park, S., Wolanin, P. M., Yuzbashyan, E. A., Silberzan, P., Stock, J. B. & Austin, R. H. (2003) Science 301, 188. [DOI] [PubMed] [Google Scholar]
- 14.Nakagaki, T., Yamada, H. & Toth, A. (2000) Nature 407, 470. [DOI] [PubMed] [Google Scholar]
- 15.Parkinson, J. S. & Houts, S. E. (1982) J. Bacteriol. 151, 106–113. [DOI] [PMC free article] [PubMed] [Google Scholar]
- 16.Ames, P. & Parkinson, J. S. (1988) Cell 55, 817–826. [DOI] [PubMed] [Google Scholar]
- 17.Gestwicki, J. & Kiessling, L. L. (2002) Nature 415, 81–84. [DOI] [PubMed] [Google Scholar]
- 18.Alon, U., Camarena, L., Surette, M. G., Aguera, Y. Arcas, B., Liu, Y., Leibler, S. & Stock, J. B. (1998) EMBO J. 17, 4238–4248. [DOI] [PMC free article] [PubMed] [Google Scholar]
- 19.Bibikov, S. I., Biran, R., Rudd, K. E. & Parkinson, J. S. (1997) J. Bacteriol. 179, 4075–4079. [DOI] [PMC free article] [PubMed] [Google Scholar]
- 20.Cormack, B. P., Valdivia, R. H. & Falkow, S. (1996) Gene 173, 33–38. [DOI] [PubMed] [Google Scholar]
- 21.Guyer, M. S., Reed, R. R., Steitz, J. A. & Low, K. B. (1981) Cold Spring Harbor Symp. Quant. Biol. 45, 135–140. [DOI] [PubMed] [Google Scholar]
- 22.Moore, S., Spachman, D. H. & Stein, W. H. (1958) Anal. Chem. 30, 1185–1190. [Google Scholar]
- 23.Stauffer, D. & Aharony, A. (1992) Introduction to Percolation Theory (Taylor & Francis, London), 2nd Ed.
- 24.Whitesides, G. M., Ostuni, E., Takayama, S., Jiang, X. & Ingeber, D. E. (2001) Annu. Rev. Biomed. Eng. 3, 335–373. [DOI] [PubMed] [Google Scholar]
- 25.Charati, S. G. & Stern, S. A. (1998) Macromolecules 31, 5529–5535. [Google Scholar]
- 26.Chen, X., Schauder, S., Potier, N., Van Dorsselaer, A., Pelczer, I., Bassler, B. L. & Hughson, F. M. (2002) Nature 415, 545–549. [DOI] [PubMed] [Google Scholar]
- 27.Hedblom, M. L. & Adler, J. (1983) J. Bacteriol. 155, 1463–1466. [DOI] [PMC free article] [PubMed] [Google Scholar]
- 28.Chang, D. E., Shin, S., Rhee, J. S. & Pan, J. G. (1999) J. Bacteriol. 181, 6656–6663. [DOI] [PMC free article] [PubMed] [Google Scholar]
- 29.Keller, E. F. & Segel, L. A. (1970) J. Theor. Biol. 26, 399–415. [DOI] [PubMed] [Google Scholar]
- 30.Brenner, M. P., Levitov, L. S. & Budrene, E. O. (1998) Biophys. J. 74, 1677–1693. [DOI] [PMC free article] [PubMed] [Google Scholar]
- 31.Schnitzer, M. J., Block, S. M., Berg, H. C. & Purcell, E. M. (1990) Symp. Soc. Gen. Microbiol. 46, 15–34. [Google Scholar]