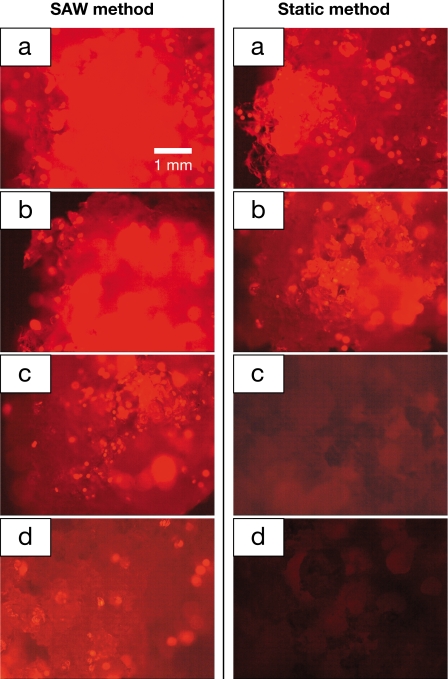
Figure 2.
Fluorescent images of cross sections of the scaffold at the positions corresponding to slices a–d, as shown in Fig. 1b. Slice a is the first slice where the cell suspension enters the scaffold. The left column shows the scaffold slices seeded by the SAW method. Significant penetration of the cells to the last slice is observed. The right columns are images of the static-loaded slices, showing little particle penetration beyond the first two slices. All images are at 20× magnification. In both cases, the scaffold dissection was carried out immediately after the entire suspension entered the scaffold, after an elapsed time of ten seconds for the SAW-driven samples and 30 min for the static seeding samples.

