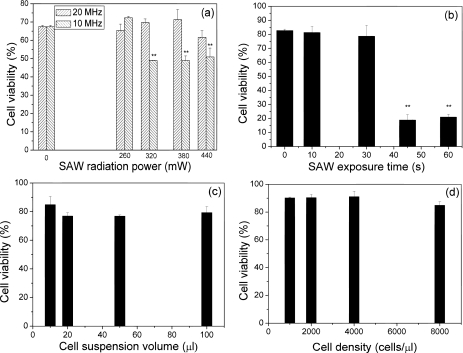
Figure 4.
Viability assessments of primary osteoblast-like cells after being treated with SAWs under different conditions. (a) Viability of cells treated by the SAW for 10 s at different frequencies and RF powers. The cell density is 5000 cells∕μℓ and the volume of cell suspension is 10 μℓ. (b) Viability of cells treated by the SAW for different exposure times at 20 MHz and 380 mW. The cell density is 5000 cells∕μℓ and the volume of the cell suspension is 10 μℓ. (c) Viability of cells treated by the SAW at 20 MHz and 380 mW for 10 s. The cell suspension is changed from 10 to 100 μℓ while maintaining the same cell density of 5000 cells∕μℓ. (d) Viability of cells treated by the SAW at 20 MHz and 380 mW for 10 s. The cell density is changed from 1000 to 8000 cells∕μℓ using the same 10 μℓ volume. The symbol “∗∗” indicates that there is significant difference between these data to the control group.

