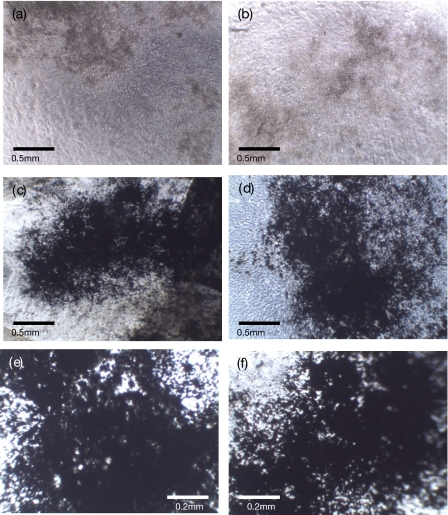
Figure 7.
Calcium phosphate deposits without [brown (a) and (b)] or with von Kossa staining [black (c)–(f)] of treated and untreated cells after being cultured for 18 days. Images of (a) untreated and (b) SAW-treated cells after being cultured for 18 days without von Kossa staining. The magnification is 40×. Images of (c) untreated and (d) SAW-treated cells after being cultured for 18 days with von Kossa staining. The magnification is 40×. Images of (e) untreated and (f) SAW-treated cells after being cultured for 18 days with von Kossa staining. The magnification is 100×. The cells were treated by the SAW at 20 MHz and 380 mW for 10 s. The volume of the cell suspension and cell density are 10 μℓ and 1000 cells∕μℓ, respectively.

