Abstract
A novel microfluidic pressure sensor which can be fully integrated into polydimethylsiloxane (PDMS) is reported. The sensor produces electrical signals directly. We integrated PDMS-based conductive composites into a 30 μm thick membrane and bonded it to the microchannel side wall. The response time of the sensor is approximately 100 ms and can work within a pressure range as wide as 0–100 kPa. The resolution of this micropressure sensor is generally 0.1 kPa but can be increased to 0.01 kPa at high pressures as a result of the quadratic relationship between resistance and pressure. The PDMS-based nature of the sensor ensures its perfect bonding with PDMS chips, and the standard photolithographic process of the sensor allows one-time fabrication of three dimensional structures or even microsensor arrays. The theoretical calculations are in good agreement with experimental observations.
INTRODUCTION
Polydimethylsiloxane (PDMS) is widely employed in microfluidic chip fabrication owing to its transparency, flexibility, and biocompatibility.1, 2 Current challenges include the miniaturization and integration of reliable electronic sensors and actuators into PDMS-based chips;3, 4 microfluidic applications demand pressure sensors which are indispensable in control5, 6 and actuation7 of microfluidic systems. While existing well developed microfluidic sensors are fabricated on silicon, silica, and glass substrates,8, 9, 10, 11, 12 the complex fabrication process, strict fabrication-environmental requirements, the tenuous bonding to PDMS, as well as the hardness and fragility of substrates diminish the advantages of PDMS chips. Moreover, the issue of opacity introduces another element of difficulty into optical monitoring of microfluidic conditions. To solve these problems, Whitesides and co-workers13, 14 developed diffractive elements inside PDMS chips, and Hosokawa et al.15 used these elements to measure pressure in PDMS chips.
In this paper, we report a micropressure sensor fabricated with a Ag∕PDMS conducting composite which was recently developed.16 This composite was used to form electrodes17 and heaters18 in microfluidic chips, but its usefulness in fabricating sensing elements was never proven by experiment. The sensor is of simple design, offering ease of fabrication, perfect bonding to or integration with PDMS chips, as well as one-time fabrication. One-time fabrication allows for complex structures or sensor arrays that can map pressure differences within chips. The output of this micropressure sensor is a direct electrical signal, which for microsystems is preferable to an optical signal.19 We observed hysteretic and time lag in relaxation; thus the sensor is recommended for long-term monitoring of microchannel pressure conditions and is especially recommended for monitoring of pressure in multilayer devices.20
EXPERIMENTAL
Working principle
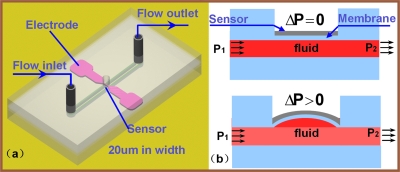
To prove the working concept of our sensor, several test devices consisting of various micro-fluidic channels and micro-pressure sensors were designed and fabricated. Figure 1a is a schematic diagram of the design of the micro-pressure sensor. It has three layers, consisting of a flow channel (width: 200 μm; depth: 100 μm), a thin PDMS membrane (thickness: 30 μm, with embedded micro-pressure sensor), and a cover layer with a single hole (radius: 200 μm) overlaid on the micro-pressure sensor. This hole was designed to create enough space in which the sensor can freely deform and was created by punching a hole in the PDMS with a needle. All of the layers were bonded using the standard plasma surface-treatment technique,21 and the bonding strength was tested to be higher than 200 kPa. Figure 1b demonstrates its working principle. When the pressure difference between P1 and P2 is zero, the pressure sensor remains static with a constant resistance. When the pressure difference between P1 and P2 increases, the sensor deforms, increasing the sensor’s electrical resistance.
Figure 1.
(a) Schematic diagram of micropressure sensor. (b) Working principle of micropressure sensor.
Microfluid device
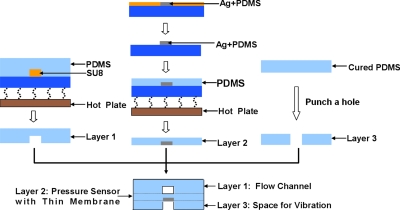
Figure 2 is the illustration of the fabrication process of this type of pressure sensor. The key component of the micropressure sensor is a flexible strip (width: 20 μm; thickness: 25 μm; length: 600 μm) fabricated of Ag∕PDMS conducting composite: A mixture of microsized granules of silver powder and PDMS gel. The silver power (diameter: 1–2 μm) was first mixed and ground together with PDMS gel in a mortar to a silver-weight concentration of 83%.16 Carbon black (diameter: 40–100 nm) was incorporated at different weight concentrations (0.2%–0.5%) to increase the resistance of this composite. The Ag∕PDMS gel was subsequently filled into AZ4903 molds (thickness: 25 μm). The samples were then solidified by baking at 70 °C for 0.5 h, after which the molds were rinsed away by acetone, leaving only the solid Ag∕PDMS sensor pattern on a glass substrate. Pure PDMS was then spin coated (at 1300 rpm) onto the sample surface and, after solidification, lifted off the substrate with the flexible resistance embedded in. This combined material (i.e., Ag∕PDMS embedded in PDMS) was further baked on a hotplate at 150 °C for 2 h in order to render it conductive. Such fabricated micropressure sensors typically show resistances ranging from 10 Ω (without carbon black powder) to 100 Ω (with carbon black powder). The Young modulus of this Ag∕PDMS∕PDMS material is 0.5765 MPa (measured with Alliance RT∕5, MTS) but with some variation due to the different preparation conditions (i.e., baking time and temperature).
Figure 2.
Fabrication process of micropressure sensor.
RESULTS AND DISCUSSIONS
Experiment results
In order to test the response of the resistance to pressure, water was supplied by syringe pump (KD Scientific) into the testing chips via tubing (B-44-4X, TYGON), allowing various steady pressures to be obtained by changing the pumping flow rate. A pressure as high as 100 kPa was produced and tested in this channel using a flow rate around 10 ml∕min. This rate is unusually high and is rarely encountered, so few devices are subjected to such conditions. Hence, we expect a steady performance for this device at pressures under 100 kPa (i.e., normal working conditions).
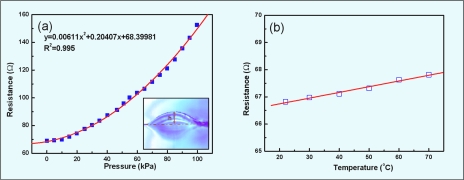
The characteristic sensor response curve is shown in Fig. 3a. The microsensor’s resistance variations resulting from the pressure changes were measured by a multimeter (34410A, Agilent) and then were calibrated to and compared with those of a standard pressure sensor (ASCX30DN, Honeywell). A custom-made data acquisition interface programed by LABVIEW (National Instruments) allowed us to monitor the resistance and pressure data simultaneously via a computer with a GPIB card (SCB-68 quick reference table, National Instruments). Figure 3a graphically represents the good quadratic relation found between the resistance and the pressure. The insert of Fig. 3a is a photo (DP71, OLYMPUS) of the thin membrane deformation under a given pressure, the deformation of which produced the changes in resistance. In our experiments, we found the resolution to be 0.1 kPa. Moreover, a keener resolution at higher pressures was observed; any change in pressure causes a larger increase in resistance at high pressure due to the quadratic relationship between pressure and resistance. Repeated experiments showed the accuracy to be about 0.5 kPa.
Figure 3.
Character of micropressure sensor. (a) Characteristic response of micropressure sensor to pressure. (b) Thermal response of micropressure sensor to pressure.
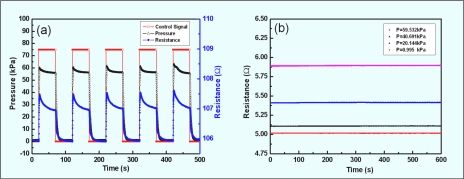
In order to investigate the temperature influence on the resistance, the micropressure sensor was heated on a hotplate and the resistance was recorded, which can be seen in Fig. 3b. From this experiment, a linear relation between resistance and temperature for the rapid heating process was identified. Heating the sensor from 22 to 70 °C under atmospheric pressure resulted in a 0.994 Ω increase in resistance. The detection ability of the micropressure sensor, defined as the extent of resistance under 100 kPa pressure, was 90 Ω. We compared the thermal noise (0.994 Ω) with the detection ability (90 Ω) and from this a thermal noise ratio of about 1.1% can be derived. The time-related performance of the micropressure sensor was also tested and the results are shown in Fig. 4, which shows the response time and the recovery time, together with the long-term stability. An electromagnetic valve (6012C, Burkert) operating at 0.02 Hz was used to control the flow of condensed air, which is the medium by which periodical pressure was delivered. It was assumed that the standard pressure sensor (ASCX30DN, Honeywell) indicated the actual pressure in the microfluidic testing channel. The uptrend and decline in response were repeatable and very sharp, as illustrated in Fig. 4a. From the raw data of Fig. 4a, we found that the micropressure sensor responded as quickly as the commercialized control sensor, sometimes up to 100 ms faster. However, the micropressure sensor takes an additional 30 s to relax to its resting state, which might be a function of the mechanical restoration lag of the elastomer. Figure 4b shows the time-related stability, which was evaluated under varying steady water pressures. Comparing the noise to the detection ability of the pressure sensor, we found the noise ratio to be less than 0.3% for our sensors.
Figure 4.
Time-related response of micropressure sensor. (a) Sample testing by periodic condensed air working at 0.02 Hz. The pressure drops due to the permeability of the PDMS membrane, which in turn causes the resistance to fall. (b) A 600 s test for long-term stability.
Discussion
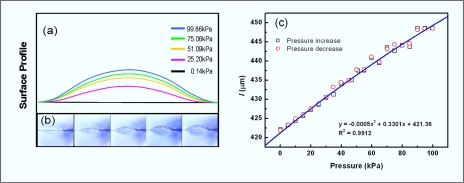
Understanding the quadratic behavior of the micropressure sensor requires an appreciation of the relation between pressure and sensor length as well as that between pressure and resistivity of the sensor. Therefore, we determined the length of the micropressure sensor by means of a surface profile of the sensor. Figure 5a shows the surface profile as derived from Fig. 5b, which is a series of real-time photographs (DP71, OLYMPUS). The changing length of the sensor under the different pressures was then obtained, which is plotted as a cartoon in Fig. 5c. A simple curve fitting revealed that the length of the micropressure sensor correlated with pressure in a second polynomial form, which slightly deviated from the linear relationship because the coefficient of the second order is three orders smaller than that of the first order.
Figure 5.
Surface profile and the length of the sensor under increasing pressure. (a) Portrait of surface profile from (b) under different pressures. (b) Real-time picture of the thin membrane with pressure load. The pressure sensor embedded in the center. (c) Plot of length vs pressure measured from (a).
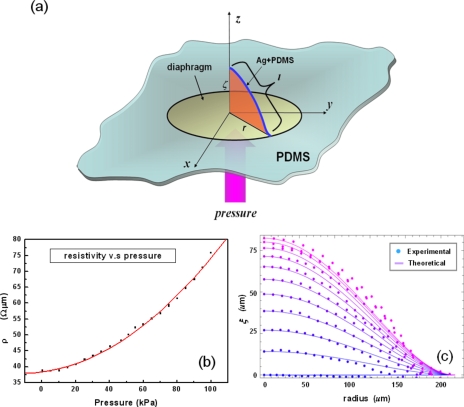
It is well known that the resistivity of the conductive polymer composite is not a constant parameter under stretching22 and can be backcalculated from experimental data. Assuming the volume (V) of the sensor is a constant, the resistivity (ρ) is calculated from ρ=RV∕l2 and plotted in Fig. 6b, where l is the length of the sensor. This increasing resistivity against increasing pressure was explained by Lu et al.23 as a result of the destructive effect on conductive networks of microsized metal powder.
Figure 6.
Analysis of underlying behavior of pressure sensor. (a) Schematic of employed physical quantity. (b) Plot of resistivity vs pressure loading. (c) Comparison of theoretical and experimental results of surface profile (or length) of the sensor.
A comprehensive analysis of resistance behavior should consider both the resistor’s resistivity and length;24 the latter’s value is easily obtained in standard uniaxial stretching experiment.23, 25 However, in our case, the sensor undergoes a transverse deformation including both bending and stretching processes, which are more complicated analyses mathematically. Hence, we introduce a theoretical perspective to understand the action of length under pressure.
Usually, the deformation will occur when the elastic plate is under nonequilibrium pressure at the front and back sides, with simultaneous bending and stretching balancing the external force. From the perspective of energy, deformation imparts an increase in the plate’s free energy, which manifests in two distinct forms. One is a bending energy Fbend resulting from the change in the plate’s curvature, while the other is a stretching energy Fstretch from the increased surface area
where Fpl represents the free energy for the whole surface. The bending energy of this surface is
where E and σ are the Young modulus and the Poisson ratio, respectively, h is the thickness of the plate, x and y are coordinate values of a vector r(x,y), and ξ is the displacement in the direction perpendicular to the plane of the undeformed plate, as shown in Fig. 6a. The stretching energy is
where the suffixes i and j of strain tensor uij and stress tensor σij take values over x and y.
Hence we could obtain the well-known Föppl–von Kármán differential equations of the shell set for the equilibrium state26 by finding the minimum of the total free energy
| (1a) |
| (1b) |
where P is the total external pressure and D is the bending modulus.
These equations are complicated due to their nonlinearity and cannot be analytically solved. However, one model, which ignores stretching energy, is solvable: Eq. 1 is simplified to
where D=Eh3∕12(1−σ2). If the edge of the plate is clamped, the boundary conditions are
where is the normal unit vector at the edge, pointing outside. Suppose that the plate is circular and of radius r0; then, the equilibrium solution is
| (2) |
with amplitude β as a linear function of P, as
This solution is valid only when the displacement ξ is small. Under large deformation conditions, the nonlinear effect from stretching will become non-negligible and solution equation 2 will be adjusted in two ways: One is a change in amplitude β and the other a change in shape. The amplitude will be less than that as a linear function for large deformation, since the effect of balance is partly shared by the stretching; β(P) will become a nonlinear increasing convex function of pressure. Since the surface area of the plate is larger for stretching, the equilibrium profile of the plate will be wider for a fixed boundary, as if for a sphere.
In our approximation method, we considered only the nonlinear effect of amplitude β(P), which could be determined from the experimental results of measured length shown in Fig. 5b. By measuring the maximum displacement at the middle point of the plate under various pressures, we could obtain as a function of P, and thus could determine the linear function β(P) both by interpolation and by the shape of the plate. These theoretical results are compared with the experimental findings in Fig. 6c. As we expected, the shape of the plate according to the experimental results was similar to that for the theoretical results, a shape-widening deviation occurring under a higher pressure. The good correlation between the experimental and theoretical results indicates that the dominant energy of this deformable surface is the bending energy rather than the stretching energy. The stretching energy is an indispensably small correction term when pressure becomes high (in our case, at 60 kPa) and should be considered a small disturbance in theoretical work.
CONCLUSION
In this paper we present a micropressure sensor based upon conductive PDMS elastomer which can be fully integrated into PDMS chips with ease of fabrication and perfect bonding to PDMS material. The response of the sensor is sharp and the working range is within 0–100 kPa. The resolution of this micropressure sensor can reach 0.01 kPa, and the accuracy of the testing device is 0.5 kPa. That sensor is an ideal choice for PDMS-based microfluidics to map the pressure difference in chips due to its one-time fabrication for complex structures or sensor arrays. We further discussed the sensor’s behavior from the theoretical point of view by considering the sensor layer as a deformable thin plate. The theory fits experimental result well, which indicates that the dominating effect in this thin plate sensor is bending energy, and that surface stretching energy needs to be considered only as a correction term under high pressure.
ACKNOWLEDGMENTS
This publication is based on work supported by Award No. SA-C0040∕U.K.-C0016 made by the King Abdullah University of Science and Technology (KAUST) and Hong Kong RGC Grant No. HKUST 621006. This work was also partially supported by the Nanoscience and Nanotechnology Program at HKUST. The authors thank Dr. Niu Xize for fruitful discussions and preliminary experiments.
References
- Sia S. K. and Whitesides G. M., Electrophoresis 24, 3563 (2003). 10.1002/elps.200305584 [DOI] [PubMed] [Google Scholar]
- Leclerc E., Sakai Y., and Fujii T., Biomed. Microdevices 5, 109 (2003). 10.1023/A:1024583026925 [DOI] [Google Scholar]
- DeMello A. J., Nature (London) 442, 394 (2006). 10.1038/nature05062 [DOI] [PubMed] [Google Scholar]
- Hong J. W. and Quake S. R., Nat. Biotechnol. 21, 1179 (2003). 10.1038/nbt871 [DOI] [PubMed] [Google Scholar]
- Luo Y., Zhang Q., Qin J., and Lin B., Electrophoresis 28, 4769 (2007). 10.1002/elps.200700330 [DOI] [PubMed] [Google Scholar]
- Niu X., Zhang M., Peng S., Wen W., and Sheng P., Biomicrofluidics 1, 044101 (2007). 10.1063/1.2795392 [DOI] [PMC free article] [PubMed] [Google Scholar]
- Li B., Jiang L., Wang Q., Qin J., and Lin B., Electrophoresis 29, 4906 (2008). 10.1002/elps.200800336 [DOI] [PubMed] [Google Scholar]
- Akiyama M., Morofuji Y., Kamohara T., Nishikubo K., Tsubai M., Fukuda O., and Ueno N., J. Appl. Phys. 100, 114318 (2006). 10.1063/1.2401312 [DOI] [Google Scholar]
- Arshak K., Morris D., Arshak A., Korostynska O., and Kaneswaran K., Conference Proceedings of the ISSE 2006 - 29th International Spring Seminar on Electronics Technology: Nano Technologies for Electronics Packaging, 2006. (unpublished), Vol. 334.
- Arshak K. I., Morris D., Arshak A., Korostynska O., and Jafer E., IEEE Sens. J. 7, 122 (2007). 10.1109/JSEN.2006.886879 [DOI] [Google Scholar]
- Schweeger G., Lang C., Fricke K., Hartnagel H. L., Dolt R., and Hohenberg G., Electron. Lett. 30, 1355 (1994). 10.1049/el:19940910 [DOI] [Google Scholar]
- Wang Y. -H., Chen C. -P., Chang C. -M., Lin C. -P., Lin C. -H., Fu L. -M., and Lee C. -Y., Microfluid. Nanofluid. 6, 333 (2009). 10.1007/s10404-008-0383-4 [DOI] [Google Scholar]
- Schueller O. J. A., Duffy D. C., Rogers J. A., Brittain S. T., and Whitesides G. M., Sens. Actuators, A 78, 149 (1999). 10.1016/S0924-4247(98)00242-8 [DOI] [Google Scholar]
- Rogers J. A., Qin D., Schueller O. J. A., and Whitesides G. M., Rev. Sci. Instrum. 67, 3310 (1996). 10.1063/1.1147413 [DOI] [Google Scholar]
- Hosokawa K., Hanada K., and Maeda R., J. Micromech. Microeng. 12, 1 (2002). 10.1088/0960-1317/12/1/301 [DOI] [Google Scholar]
- Niu X., Peng S., Liu L., Wen W., and Sheng P., Adv. Mater. 19, 2682 (2007). 10.1002/adma.200602515 [DOI] [Google Scholar]
- Gong X. and Wen W., Biomicrofluidics 3, 012007 (2009). 10.1063/1.3098963 [DOI] [PMC free article] [PubMed] [Google Scholar]
- Liu L., Cao W., Wu J., Wen W., Chang D. C., and Sheng P., Biomicrofluidics 2, 034103 (2008). 10.1063/1.2966453 [DOI] [PMC free article] [PubMed] [Google Scholar]
- Bao N., Wang J., and Lu C., Anal. Bioanal. Chem. 391, 933 (2008). 10.1007/s00216-008-1899-x [DOI] [PubMed] [Google Scholar]
- Long Z., Shen Z., Wu D., Qin J., and Lin B., Lab Chip 7, 1819 (2007). 10.1039/b711741h [DOI] [PubMed] [Google Scholar]
- Eddings M. A., Johnson M. A., and Gale B. K., J. Micromech. Microeng. 18, 067001 (2008). 10.1088/0960-1317/18/6/067001 [DOI] [Google Scholar]
- Flandin L., Chang A., Nazarenko S., Hiltner A., and Baer E., J. Appl. Polym. Sci. 76, 894 (2000). [DOI] [Google Scholar]
- Lu J., Weng W., Chen X., Wu D., Wu C., and Chen G., Adv. Funct. Mater. 15, 1358 (2005). 10.1002/adfm.200400298 [DOI] [Google Scholar]
- Hu W., Zhao L., Wu L., Wang L., Zhang B., and Guan H., J. Appl. Phys. 79, 866 (1996). 10.1063/1.360906 [DOI] [Google Scholar]
- Mansour S. A., Express Polymer Letters 2, 836 (2008). 10.3144/expresspolymlett.2008.98 [DOI] [Google Scholar]
- Guha P. and Shipman P., Chaos, Solitons Fractals , 41, 2828 (2008). 10.1016/j.chaos.2008.10.025 [DOI] [Google Scholar]


