Abstract
Nanoparticle image velocimetry (nano-PIV), based on total internal reflection fluorescent microscopy, is very useful to investigate fluid flows within ∼100 nm from a surface; but so far it has only been applied to flow over smooth surfaces. Here we show that it can also be applied to flow over a topologically structured surface, provided that the surface structures can be carefully configured not to disrupt the evanescent-wave illumination. We apply nano-PIV to quantify the flow velocity distribution over a polydimethylsiloxane surface, with a periodic gratinglike structure (with 215 nm height and 2 μm period) fabricated using our customized multilevel lithography method. The measured tracer displacement data are in good agreement with the computed theoretical values. These results demonstrate new possibilities to study the interactions between fluid flow and topologically structured surfaces.
INTRODUCTION
Recent publications have reported that topologically structured surfaces can exhibit modulated wetting characteristics and slip-length values.1, 2, 3 These features can be particularly useful to control flows inside microfluidic and nanofluidic devices,4, 5 where the surface effects are much stronger than the bulk effects. Related to this, previous researchers have been successfully using the microparticle image velocimetry (micro-PIV) method to quantify the effects of the micrometer-scale structures on the flows.6, 7, 8, 9 A single-pixel resolution micro-PIV method was proposed recently to enhance the velocimetry quality close to the channel sidewalls,10 resulting in lateral-resolution of 300 nm. However, because the depth resolution of micro-PIV is mainly limited by the optical diffraction to ∼500 nm, it cannot be used to perform velocimetry close to the channel lower wall, particularly when the structure topology variation at the lower wall is less than the depth resolution. To overcome this problem, nanoparticle image velocimetry (nano-PIV), based on total internal reflection fluorescence microscopy (TIRFM), is usually employed at the lower wall because it offers depth resolution in the order of ∼100 nm.11, 12 In nano-PIV, an incident laser impinges upon a dielectric interface (between the solid channel lower wall and the liquid inside the channel, each with a different refractive index) with an angle θ larger than the critical angle θc,
| (1) |
where n is the refractive index, such that the light is totally reflected by the liquid-solid interface.
Although all of the incident light is reflected, a nonpropagating (i.e., evanescent) electric field must be present beyond the dielectric interface to satisfy the boundary conditions of the Maxwell equations.13 This electric field, called the evanescent wave, has an intensity I that decays exponentially with distance z normal to the interface,
| (2) |
where d is the penetration depth given by
| (3) |
while λ is the wavelength of the incident light.14 When the liquid is seeded with nanometric-scale fluorescent particles, the displacement of the particles can then be imaged by TIRFM recordings and further analyzed to deduce the fluid velocity distributions.11, 12 This method is particularly advantageous because the penetration depth is in the order of ∼100 nm, such that the evanescent-wave illumination selectively probes only the near-wall flow properties close to the surface under study. This method has allowed previous researchers to characterize the pressure driven as well as electro-osmotic near-wall velocities, both at hydrophobic and hydrophilic surfaces.15, 16, 17, 18, 19, 20
While the nano-PIV method can readily be used at chemically structured (but topologically smooth) surfaces,18 it poses a delicate challenge when being applied at topologically structured surfaces. To achieve this, the most important challenge is to minimize the unwanted scattering of the incident light by the surface structures,14 which would result in both propagating and evanescent wave in the illumination. Here we demonstrate that the nano-PIV method can also be applied to flow over a topologically structured surface (and, consequently, has the potential to quantitatively study the modulated wetting characteristics and slip-length values exhibited by the structured surface), provided that the optical effects of the surface structures on the TIRFM imaging are carefully taken into account. In Sec. 2, these optical effects will be described. Next, we present our multilevel lithography method, with which we fabricate polydimethylsiloxane (PDMS) surfaces, with n=1.43 and a thickness of 165 μm (thus made suitable for conventional lens-based TIRFM imaging), equipped with gratinglike structures (also from PDMS) with a height and period of 215 nm and 2 μm, respectively. Afterward, the experimental method is explained. Finally, we will present and discuss our results.
OPTICAL EFFECTS OF THE SURFACE STRUCTURES
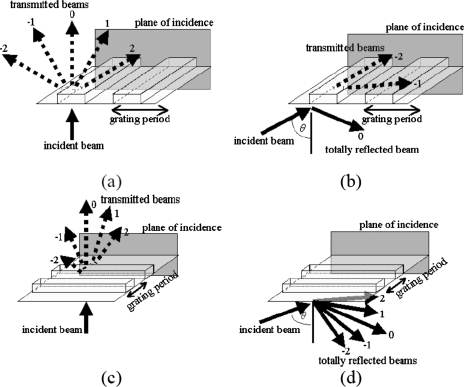
To properly apply nano-PIV to flow over a structured surface, the optical effects of the structure topology on the evanescent-wave illumination need to be considered. In general, any arbitrary surface topology could be decomposed into several one-dimensional periodic topologies with different amplitudes and spatial frequencies. Therefore, in this study we focus only on the simplest case, where we have a single one-dimensional periodic topology, which would then act as a one-dimensional optical diffraction grating. Figure 1 shows schematics of four different cases, i.e., when the grating period is parallel to the plane of incidence (i.e., the plane that is parallel to both the incident beam and the transmitted∕reflected nondiffracted beam), for (a) θ=0 and (b) θ>θc, and when the grating period is perpendicular to the plane of incidence, for (c) θ=0 and (d) θ>θc.
Figure 1.
Schematics (not to scale) of the cases when the grating period of the surface structures is parallel to the optical “plane of incidence” for (a) θ=0 and (b) θ>θc, and when the grating period is perpendicular to the plane of incidence for (c) θ=0 and (d) θ>θc.
Figures 1a, 1b focus on the cases where the grating period is configured parallel to the optical plane of incidence. When θ=0 [Fig. 1a], the transmitted beams form an array of diverging subbeams. The numbers (−2), (−1), 0, 1, and 2 depicted in Fig. 1 illustrate the “diffraction orders” of the subbeams. The angle of each subbeam is governed by the diffraction equation: P sin θm=mλ (Ref. 13), where P is the grating period, m is the diffraction order (m=…,−2,−1,0,1,2,…), and θm is the angle of the subbeam of order m. Meanwhile, for θ>θc [Fig. 1b], the diverging subbeams have been rearranged: Subbeams (−2) and (−1) are still transmitted, whereas subbeam 0 is now totally reflected by the structures (note that the subbeams 1 and 2, not shown in Fig. 1b, have also been totally reflected). Due to the total internal reflection (TIR) of subbeam 0, an evanescent wave occurs at the structures, which can then be used as illumination for the velocimetry. However, subbeams (−2) and (−1) are still transmitted through the nanostructures, implying that the total illumination actually consists of the evanescent wave induced by subbeam 0 and the transmitted propagating subbeams (−2) and (−1). Note that even though these propagating subbeams (−2) and (−1) have lower intensities than the totally reflected subbeam 0, they still illuminate the tracer particles located near the surfaces. Therefore, I(z) does not decay exponentially, as defined by Eq. 2, and this illumination is not selectively probing the near-wall flow properties of the surface.
Figures 1c, 1d focus on the cases where the grating period is configured perpendicular to the optical plane of incidence. When θ=0 [Fig. 1c], the transmitted beams again form several diffracted subbeams. However, for θ>θc [Fig. 1d], all the subbeams now simultaneously experience TIR, in contrast to the case shown in Fig. 1b. Because the transmission of the subbeams through the structures are minimized, an evanescent-wave illumination can be maintained at the structured surface, with an illumination intensity expressed by Eq. 2; hence it can be properly used to probe the near-wall flows over structured surfaces.
For lens-based TIRFM setups (which require an immersion oil in its operation), the material of the structures may have a different refractive index compared to both the immersion oil and the studied liquid, i.e., noil>nstructures>nliquid, such that the structured surface forms an intermediate layer.14 On one hand, for the specific cases where sin θ>(nstructures∕noil), the TIR would occur at the oil-structure interface. This is not preferable because the penetration depth described in Eq. 3 would generally be too thin to penetrate the required structured surface thickness (which is approximately 170 μm, i.e., the thickness of conventional glass cover slips used in lens-based TIRFM setups). On the other hand, for the other specific cases where sin θ>(nliquid∕nstructures), the TIR would start occurring at the structure-liquid interface, thus would be able to probe the fluorescent particles seeded in the studied liquid. However, when inducing TIR at the PDMS-water interface, the possible scattering of the evanescent-wave illumination at the structured PDMS-water interface must be taken into account; this scattering could convert the evanescent-wave light into a propagating wave light,21 hence resulting in unwanted additional illumination. However, the configuration proposed previously in Fig. 1d, where the grating period of the surface structure is configured perpendicular to the optical plane of incidence (and the grating period is several times larger than the incident light wavelength), could be used to minimize the scattering. Even though scattering might still occur, particularly at the corners of the structures topology, the tracer particles could still be classified based on their location, and analysis could then be focused on the ridges and the valleys of the structure.
METHOD DESCRIPTION
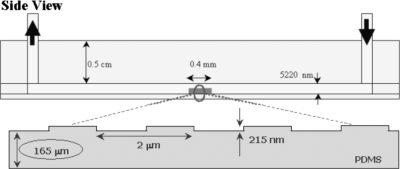
Figure 2 shows the schematic drawing of the microchannel used in our experiments, which has a structured surface at the lower wall. The channel walls and the structures are all made of PDMS, which is inherently hydrophobic22 and has a refractive index of n=1.43 (measured with an Abbe refractometer, Bleeker NV, The Netherlands). The depth, width, and length of the channels are 5.00(±0.01) μm (without the periodic grating), 50(±1) μm, and 5 cm, respectively. The structures are formed as a periodic grating with a height of (215±5) nm and a period of 2.00 μm, with the grating period configured along the microchannel length. The structures have a total length of 400 μm, i.e., comprising of 200 grating periods. The thickness of the lower wall is 165(±10) μm and is designed to take into account that lens-based TIRFM imaging usually uses glass cover slips (n=1.51) with a thickness of 170 μm.
Figure 2.
A schematic (not to scale) of the microfluidic setup in our experiments, shown in side view, with the inset displaying the fabricated structures’ dimensions.
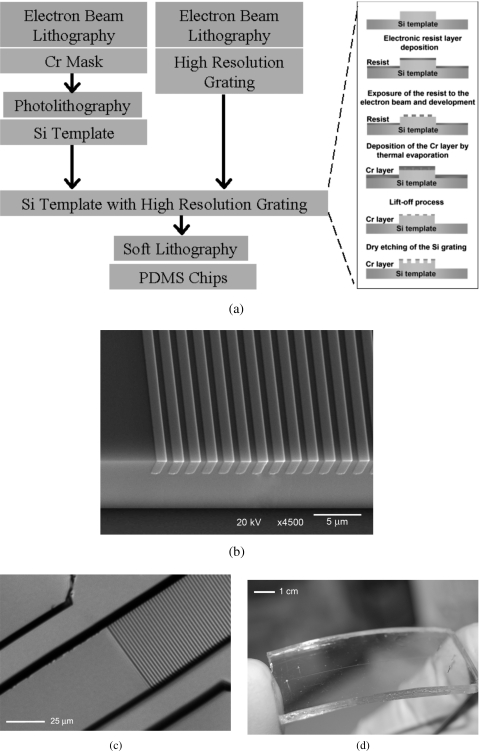
The fabrication was performed in several steps, as illustrated in Fig. 3a. First, the general pattern of the channel is created on a chromium (Cr) mask using electron beam lithography (EBL). Afterward, the Cr mask was used to create a negative master template from silicon (Si) by photolithography and wet etching. The structured grating with a period of 2 μm was then directly created onto the Si master template, shown in Fig. 3b, using EBL and dry etching [see the inset in Fig. 3a]. We develop a multilevel alignment process in order to directly produce the structures onto the microchannel surface by EBL. The realized Si master, which already incorporates the structures, was then used as the template for producing monolithic PDMS microchannels. In particular, the PDMS Sylgard 184 solution (Dow Corning, MI, USA) was used and two PDMS layers were fabricated by different relative concentrations of base and curing agent. A ratio of 5:1 (of base and curing agent, respectively) was used for the layer containing the microchannels and structures, whereas a 20:1 ratio was employed for the flat layer (i.e., for the upper wall of the microchannel); this combination was chosen to ensure that both the required thickness (allowed by the 5:1 mixture) and the necessary bonding ability (using the 20:1 mixture) are satisfied. Note that the thickness of the layer containing the microchannel network also needs to be optimized, in order to obtain values suitable for the nano-PIV measurements. A thickness of less than 170 μm is generally preferable when using conventional TIRFM lenses. However, the thickness should also not be too thin, as thin PDMS structures are very delicate and can be damaged during handling or assembly. Bonding between the PDMS structured layer and the PDMS flat layer was performed using thermal curing at 75 °C for 2 h, effectively forming a monolithic network of channels. In Fig. 3c, an optical micrograph is shown with the structured PDMS replica before the sealing procedure, where the structures fabricated onto the surface of the microchannel are clearly visible. In Fig. 3d, the picture of a typical monolithic PDMS chip is given.
Figure 3.
(a) The multilevel fabrication method; (b) a scanning electron microscope image (in tilted view) of the resulting Si master template; (c) optical micrograph of the structured PDMS replica, with the grating structures shown; (d) a monolithic PDMS chip after the final assembly.
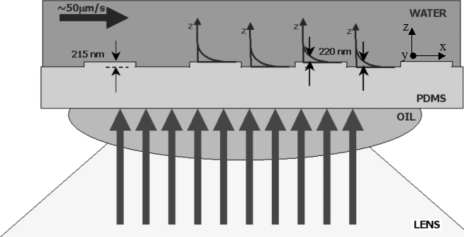
Figure 4 illustrates the TIRFM configuration used at our structured PDMS surfaces; note that the laser’s incident angles at the oil-PDMS interface and at the PDMS-water interface are not observable in Fig. 4 because the laser incident plane is configured perpendicular to the grating period. A Nikon Ti-E microscope (Nikon Instruments Europe B.V., Amstelveen, The Netherlands), equipped with an APO-TIRFM lens (60×, numerical aperture of 1.49 with oil immersion, working distance of 0.12 mm, and refractive index of immersion oil of 1.51) was used along with a TIRFM laser beam position manipulator (controlled using the “NIKON TI CONTROL” software). The laser is a Nd:YAG (yttrium aluminum garnet) continuous-wave laser (Coherent Inc., Santa Clara, CA, USA) with a wavelength of 532 nm and a power of 150 mW. An optical fiber delivers the laser beam from the laser head to the TIRFM laser beam position manipulator of the microscope. The latter was used to control the translation of the laser beam with respect to the optical axis of the lens, which in turn affects the incident angle, θ, and the penetration depth, d.
Figure 4.
The schematic of the TIRFM configuration used at our PDMS surfaces, with the large arrows coming from below illustrating the incident laser. Note that the laser’s incident angles at the oil-PDMS interface (62.9°) and at the PDMS-water interface (70°) are not observable here because the laser incident plane is configured perpendicular to the grating period.
We use a 0.75 mm diameter capillary tube to supply the fluid into our PDMS microchannel device, where we used distilled water as the working liquid. We induce a pressure-driven flow by raising the inlet’s reservoir ∼1 mm higher than the PDMS microchannel, resulting in particle displacements (in the image plane) of ∼50 μm∕s along the streamwise direction (corresponding to particle displacements of ∼50 pixels, or ∼2.5 grating period, between successive image frames). Note that in a rectangular channel, the expected streamwise velocity, vx, as the function of y- and z-axes can be described as23
| (4) |
where h is the channel height, w is the channel width, L is the channel length, Δp the pressure difference between the inlet and the outlet, and η is the fluid dynamic viscosity.
The liquid was seeded using fluorescent tracer particles (Fluospheres, Invitrogen Co., Carlsbad, CA, USA), diluted with distilled water to obtain a final volumetric ratio of 1:105. These tracers have a diameter of 40 nm (with a coefficient of variation of 20%) and excitation∕emission wavelength peaks at 540∕560 nm. The fluorescent excitation, as well as the emission detection, of the tracer particles was performed using a customized filter set (AHF AG, Tubingen, Germany), comprising an exciter filter (HCLaser Cleanup MaxLine 532∕2), a dichroic beam splitter (Raman RazorEdge Beamsplitter 532 RU, reflection at 532.0 nm, transmission at 538.9–824.8 nm), and an emitter filter (Raman emitter RU 532 LP). For our experiments, the TIRFM laser beam manipulator is set such that an incident angle θ of 62.9° at the oil-PDMS interface (resulting in an angle θ of 70° at the PDMS-water interface) is obtained, corresponding to an evanescent-wave illumination with a calculated penetration depth, based on Eq. 3, of 220 nm. The fluorescent images were recorded using a charged coupled device (CCD) camera (Sensicam QE, PCO AG, Kelheim, Germany) that was cooled to allow a readout noise of as low as 4e− (rms). The CCD camera has 1376×1040 pixels, with individual pixel size of 6.45×6.45 μm2. The digital images were acquired by means of DaVis (LaVision GmbH, Goettingen, Germany). During the nano-PIV measurements, the exposure time of the CCD and the recording rate are set to 10 ms and 10 Hz, respectively.
The image analysis starts by removing the background average image from each digital image. The tracer images were then segmented using a fixed threshold algorithm24 implemented in MATLAB (Mathworks Inc., Natick, MA, USA) through the image processing toolbox DIPimage (Ref. 25). Along the channel length and width, the position of each particle image is estimated by fitting a two-dimensional Gaussian curve to the spatial intensity distributions.24 Meanwhile, to estimate the particle position along the channel depth, we have to use the highest intensity values of each particle image. If the particle image intensities before and after the displacement, I(z1) and I(z2), can be described as in Eq. 2,
| (5) |
then the estimation of particle displacement along the z-axis can be mathematically described as
| (6) |
Note that in Eq. 6, the particle displacement along the z-axis velocity is normalized by d, i.e., the calculated penetration depth of 220 nm.
Estimation of the velocity distributions is then performed using a statistical particle tracking algorithm,26 in which all possible tracking combinations within the interrogation window (with dimensions of 100×100 pixels, centered with respect to the first particle image for each particle image pair) are taken into account. This algorithm allows us to identify the Brownian diffusion of the tracer particles, even when the diffusion length (between the two images in each particle image pair) is comparable to the interparticle distances. For nano-PIV, the segmentation-based particle tracking method is more preferable than the widely used correlation-based PIV method10, 27 because the latter is more prone to errors induced by in-plane and out-of-plane loss of pairs28 and is less straightforward in estimating the particle positions∕displacements normal to the surface. Note, however, that the raw data of the statistical particle tracking also include the following: (1) random particle image matching between uncorrelated particles and∕or CCD camera noise and (2) the in-plane and out-of-plane loss of correlation of particle images with respect to the evanescent-wave illumination. These uncorrelated contributions, which are uniformly distributed, are then extracted (and subsequently subtracted from the raw data) by repeating our statistical particle tracking on the same data sets while ensuring that the image pairs being tracked have a sufficiently long interframe time difference (>5 s) and hence are not correlated.
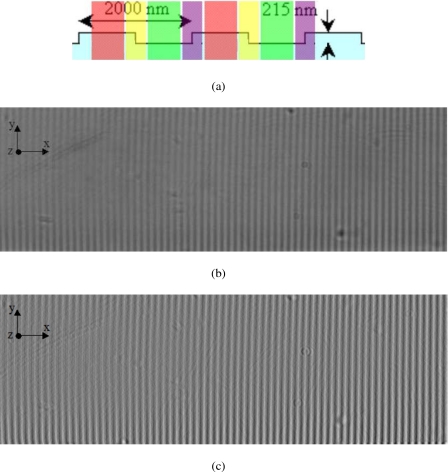
When analyzing the velocity distributions at the structured surface, we should consider the possibility of having unwanted optical scattering at the corners of the structure surface. To do this, the positions of the tracer particles need to be classified with respect to different regions of the structures, as illustrated in Fig. 5a: at the ridges (red regions), at the valleys (green regions), at the backward-facing step (yellow regions), and at the forward-facing step (purple regions). This is performed by first taking the average of ten images of the structured PDMS surface [see Fig. 5b], each taken using the transmission wide field illumination (with a light source positioned above the microchannel) rather than the TIRFM illumination. The intensity gradient (along the x-axis) of the image shown in Fig. 5b is then computed, resulting in the image shown in Fig. 5c; the low and high gray values in Fig. 5c now correspond to backward- and forward-facing steps, respectively, as shown in Fig. 5b. Afterward, the tracer positions are classified corresponding to the intensity gradients by using the gray values of the image in Fig. 5c, where the forward-facing steps (purple regions) and the backward-facing steps (yellow regions) correspond to gray values larger than 1 and smaller than (−1), respectively. All the other tracer positions are then grouped into two other classifications: the ridges (red regions) and the valleys (green regions) correspond to gray values larger than 190 and smaller than 190, respectively, in the image shown in Fig. 5b.
Figure 5.
(a) The four different regions at the structures (in side view): the ridges (the red region), the backward-facing steps (the yellow region), the valleys (the green region), and the forward-facing steps (the purple region); (b) the average of ten images of the structures (in top view), taken using the transmission wide field illumination rather than the TIRFM illumination; (c) the gradient (along the x-axis) of the image shown in (b).
RESULTS AND DISCUSSION
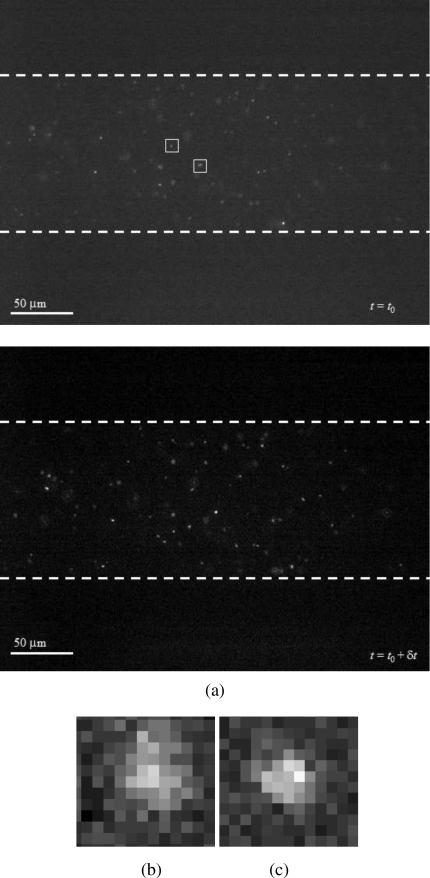
Figure 6 shows a typical TIRFM image obtained through our structured PDMS lower wall. This demonstrates that particle images can be obtained and TIRFM imaging can be performed properly even through structured PDMS surface (n=1.43) with a thickness of 165 μm (rather than conventionally used glass cover slips with n=1.51 and a thickness of 170 μm).
Figure 6.
(a) Two typical successive TIRFM images of the fluorescent showing that particle tracer images can be obtained even through the PDMS surface; [(b) and (c)] typical intensity distributions of particle images highlighted in (a), with estimated heights of 0.82d and 0.91d, respectively.
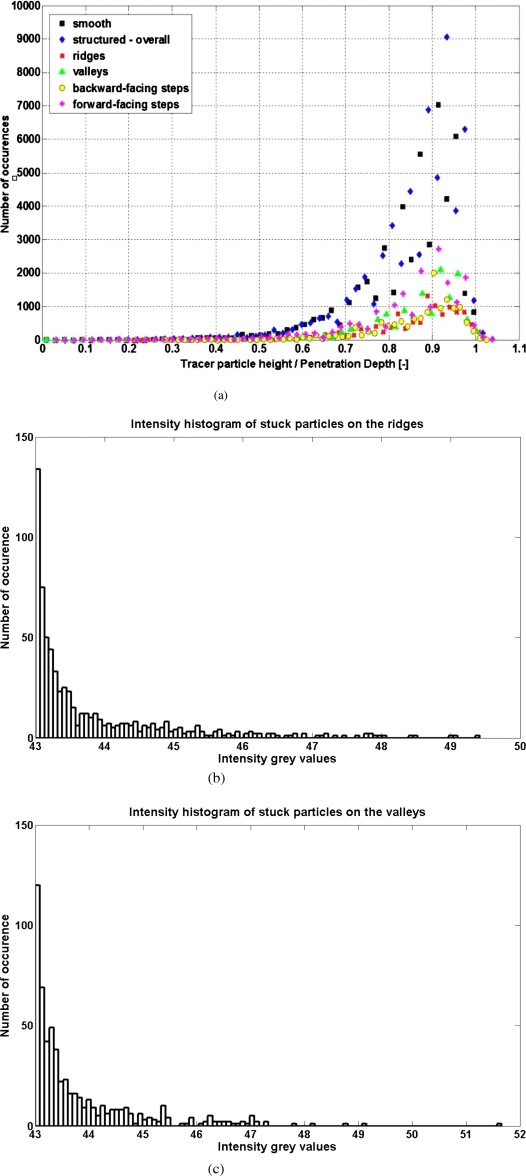
Figure 7a gives the height distribution of the 40-nm-diameter tracer particles close to the PDMS surface, where the calculated penetration depth value is 220 nm, while the surface position (i.e., at z=0) is determined using the average intensity of several tracer particles that are stuck to the surface. The black and blue points represent data for the smooth and the structured PDMS surface, respectively. The data from the structured PDMS surface are further classified (using the method illustrated in Fig. 5) as red, green, yellow, and magenta points, representing the ridges, valleys, backward-facing steps, and forward-facing steps, respectively. For all data, there are only a few tracer particles detected with a height lower than ∼110 nm, while the tracer particles with height higher than ∼220 nm have intensity levels that are as low as the CCD camera’s noise and are consequently eliminated in the image analysis. These data are consistent with earlier works based on experiments20 and calculations,29 where the nonuniform tracer distribution over the surface can be explained by the combination of electrostatic and van der Waals interactions between the particles and the wall. Note that in Fig. 7, the distribution data are deliberately not normalized so that we can comparatively show the amount of tracers detected at the smooth surface, at the structured surface, and at the four different regions along the structured surface. Note that the diameter of our tracer particles has a coefficient of variation of 20%, which would affect the precision of the measured tracer height, as also reported in previous nano-PIV experiments with fluorescent tracers.18, 20
Figure 7.
(a) The distribution of the particles distance z from the PDMS surfaces. Only a few tracer particles are detected for z less than ∼0.5 d, while the tracer particles located at z larger than ∼d have intensities levels comparable to CCD noise and are eliminated in the image analysis; [(b) and (c)] the intensity histogram of particles stuck on the ridges and the valleys, respectively.
To test whether the regions on the ridges and the valleys really provide us with consistent levels of intensity at the surface (i.e., at z=0), we let the microchannel dries with evaporation such that many particles are left stuck on the lower surface. Figures 7b, 7c show the intensity histogram of the particles stuck on the ridges and valleys, respectively. The similar distributions shown in Figs. 7b, 7c (in which the variation in each histograms can be explained by the particle polydispersity) indicate that the evanescent-wave illuminations at z=0 on the ridges and on the valleys are indeed similar, as expected in our discussion on the optical effects of the surface structures. Note that while previous researchers have tried calibrating their evanescent-wave intensity distribution (along the z-axis) by using precise z-axis displacement of a particle in the evanescent wave,11, 16 this calibration technique cannot be applied for our samples. This is because to operate this technique, the lower wall has to be disassembled from the complete microchannel and then laid directly on the TIRFM setup. Whereas other researchers’ lower walls are usually made from off-the-shelf glass cover slips, our lower walls are made from a single thin PDMS layer, which is mechanically much less robust and cannot be steadily set on top of the TIRFM setup.
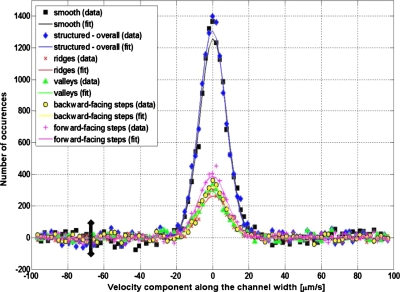
Figure 8 plots the distribution of tracer particle velocities along the channel width (i.e., the y-axis direction), where the black, blue, red, green, yellow, and magenta points represent data for the smooth surface, (overall) structured surface, ridges, valleys, backward-facing steps, and forward-facing steps, respectively. The nonuniform distributions of our data verify that we have properly tracked correlated particle displacements, rather than uncorrelated noise, which would have a statistically uniform distribution. All data distributions in Fig. 8 can be well fitted by Gaussian curves centered at approximately zero velocity (shown as colored lines), as is generally expected because there is no net flow perpendicular to the streamwise direction, such that the displacements of the tracer particles along the y- and z-axes directions are solely due to the Brownian motion. Note that even though the base lines of the Gaussian curves are located at zero occurrences, the measured data in Fig. 8 may have (small) negative values due to the subtraction of the uncorrelated tracking contributions from the raw data. In fact, the measured data in Fig. 8 have base lines with fluctuations of ∼100 occurrences, representing an estimate of the experimental errors in our measurement method. Also note that the nonzero base lines of the measured velocity distributions resulted from the nonideality of our method for “subtraction of the uncorrelated tracking contributions;” the ideal situation would only be achieved by using an infinitely large data set, while our data set comprises 5000 images.
Figure 8.
The distributions of the velocity components along the channel width, estimated from the measured particle displacements; the lines are Gaussian curves (centered on approximately the zero velocity) fitted on the experimental data, indicating that we have properly tracked correlated particle displacements (rather than uncorrelated noise), and that there is no net flow along these two directions, such that the tracer particle displacements are only due to the Brownian motion. The error bar gives an estimate of the experimental error.
If particle diffusion is not hindered by any surface, then the diffusion constant can be expressed as D0=(kBT)∕(6πμa),30 where kB is the Boltzmann constant (1.38×10⁻²³ J∕K), T is the absolute temperature (293 K), μ is the liquid dynamic viscosity (0.001 kg∕m s), and a is the particle radius (i.e., 20 nm), resulting in D0=10.7 μm2∕s. When diffusion is hindered by a surface, the hindered diffusion constant parallel to the surface is described as31
| (7) |
where z is the distance of the particle from the surface (i.e., ∼200 nm), resulting in Dy,theory=10.1 μm2∕s. In our experiments, the 10 Hz recording rate implies that we have an interframe time difference of 0.1 s. Hence the Gaussian curves in Fig. 8 represent diffusion lengths in the orders of ∼1 μm, which correspond to diffusion constants of Dy,data=∼10 μm2∕s (along the channel width), hence on the same order as Dy,theory.
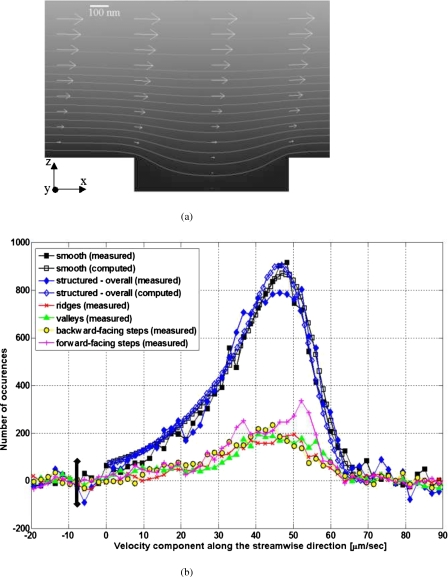
The next analysis is focused on the velocity distribution along the channel length, i.e., the streamwise direction. Figure 9a displays the result of a two-dimensional flow velocity computation (COMSOL Inc., USA) along the center of the channel (i.e., the microchannel is shown in side view). The gray values indicate normalized velocity values in the channel (i.e., brightest and darkest intensities represent highest and lowest velocities, respectively), while the arrows indicate the normalized velocity variation at various regions along the lower-wall surface. Meanwhile, in Fig. 9b, the filled black squares, filled blue diamonds, and all the red, green, yellow, and magenta points represent the measured streamwise velocity distribution over the smooth surface, (overall) structured surface, ridges, valleys, backward-facing steps, and forward-facing steps, respectively. Again, the measured data distributions verify that we have tracked correlated particle displacements, as opposed to uncorrelated noise that would display a uniform distribution. Also note that similar as in Fig. 8, the measured data in Fig. 9b may have (small) negative values due to the subtraction of the uncorrelated tracking contributions from the raw data. Meanwhile, the unfilled black squares and blue diamonds shown in Fig. 9b represent computed streamwise velocity distribution data over the smooth and structured surfaces, respectively, obtained using the following steps. First, we extract the experimentally measured height distribution of the tracer particles (as shown in Fig. 7), taken from the first image in each analyzed image pair. Second, for each detected tracer particle, we use the computed particle velocity [as shown in Fig. 9a] for the corresponding tracer height; this results in distributions of the computed particle velocity. Third, to take into account the effect of random Brownian diffusion of the particles, the computed velocity distributions obtained from the previous step are convolved with the Gaussian curves obtained from Fig. 8 (where we assume identical Brownian diffusion along the channel width and along the channel length), resulting in the computed streamwise velocity distributions shown in Fig. 9b. We also show, in Fig. 9b, the velocity distributions at the ridges, valleys, and backward- and forward-facing steps. In general, the distributions at the ridges, valleys, and backward-facing steps display a similar trend: They have flattened peaks between ∼38 and ∼50 μm∕s.
Figure 9.
(a) The result of the flow velocity computation along the center of the channel (i.e., the microchannel is shown in side view), with the scale bar indicating the dimensions of the structure topology. (b) The distributions of the velocity components along the streamwise direction, with the error bar giving an estimate of the experimental error.
Note that as the peak height differences between the measured and computed values, as well as between the individual distributions (ridges, valleys, backward-facing steps, and forward-facing steps) of the measured values, are found to be well within the experimental error (i.e., ∼100 number of occurrences shown by the velocity distribution curve), we observe that (i) we obtain fairly good agreement between measured and computed velocity distributions and (ii) there is no systematic difference between contributions of each part in the surface structures.
CONCLUSIONS
While topologically structured surfaces have been frequently reported to exhibit modulated wetting characteristics and slip-length values, performing velocimetry studies very close to these surfaces is not straightforward, particularly when the structure topology is less than the diffraction-limited depth resolution of the imaging system. We demonstrate that this can be solved by using nano-PIV, which is developed based on TIRFM, while carefully taking into account the optical effects of the structured surfaces to the evanescent-wave illumination.
Using nano-PIV, we have quantified the velocity distributions of tracer particles seeded in liquid located ∼200 nm close to smooth and structured PDMS surfaces, which are fabricated using our customized multilevel lithography. The height distributions of the tracer particles near the surfaces are consistent with earlier reports, where the distribution nonuniformity is caused by the combination of electrostatic and van der Waals particle-surface interactions. The velocity distributions of the tracer particles along the channel width can be fitted with Gaussian curves centered approximately at zero velocity because there is no net flow along these directions. Meanwhile, for the velocity distributions of the tracer particles along the channel length, the differences between the measured and computed values are found to be within the experimental error. We expect these results to spur the applications of nano-PIV in investigating the interactions between fluid flows and topologically structured surfaces.
ACKNOWLEDGMENTS
We gratefully acknowledge our fruitful discussions with Minami Yoda, Kenneth Breuer, Mark Franken, Saputra, and Indraswari Kusumaningtyas. This research was funded by the EU ISP project INFLUS (Contract No. NMP3-CT-2006-031980).
References
- Quere D., Physica A 313, 32 (2002). 10.1016/S0378-4371(02)01033-6 [DOI] [Google Scholar]
- Müller-Plathe F., Pal S., Weiss H., and Keller H., Soft Mater. 3, 21 (2005). 10.1080/15394450500408959 [DOI] [Google Scholar]
- Choi C. -H. and Kim C. -J., Phys. Rev. Lett. 96, 066001 (2006). 10.1103/PhysRevLett.96.066001 [DOI] [PubMed] [Google Scholar]
- Atencia J. and Beebe D. J., Nature (London) 437, 648 (2005). 10.1038/nature04163 [DOI] [PubMed] [Google Scholar]
- Eijkel J. C. T., Lab Chip 7, 299 (2007). 10.1039/b700364c [DOI] [PubMed] [Google Scholar]
- Ou J., Perot B., and Rothstein J. P., Phys. Fluids 16, 4635 (2004). 10.1063/1.1812011 [DOI] [Google Scholar]
- Ou J. and Rothstein J. P., Phys. Fluids 17, 103606 (2005). 10.1063/1.2109867 [DOI] [Google Scholar]
- Davies J., Maynes D., Webb B. W., and Woolford B., Phys. Fluids 18, 087110 (2006). 10.1063/1.2336453 [DOI] [Google Scholar]
- Maynes D., Jeffs K., Woolford B., and Webb B. W., Phys. Fluids 19, 093603 (2007). 10.1063/1.2772880 [DOI] [Google Scholar]
- Westerweel J., Geelhoed P. F., and Lindken R., Exp. Fluids 37, 375 (2004). 10.1007/s00348-004-0826-y [DOI] [Google Scholar]
- Zettner C. M. and Yoda M., Exp. Fluids 34, 115 (2003). 10.1007/s00348-002-0541-5 [DOI] [Google Scholar]
- Jin S., Huang P., Park J., Yoo J. Y., and Breuer K. S., Exp. Fluids 37, 825 (2004). 10.1007/s00348-004-0870-7 [DOI] [Google Scholar]
- Born M. and Wolf E., Principles of Optics: Electromagnetic Theory of Propagation, Interference, and Diffraction of Light (Cambridge University Press, Cambridge, 1999). [Google Scholar]
- Axelrod D., Burghardt T. P., and Thompson N. L., Annu. Rev. Biophys. Bioeng. 13, 247 (1984). 10.1146/annurev.bb.13.060184.001335 [DOI] [PubMed] [Google Scholar]
- Gai H., Li Y., Silber-Li Z., Ma Y., and Lin B., Lab Chip 5, 443 (2005). 10.1039/b416476h [DOI] [PubMed] [Google Scholar]
- Huang P., Guasto J. S., and Breuer K. S., J. Fluid Mech. 566, 447 (2006). 10.1017/S0022112006002229 [DOI] [Google Scholar]
- Huang P. and Breuer K. S., Phys. Fluids 19, 028104 (2007). 10.1063/1.2539829 [DOI] [Google Scholar]
- Bouzigues C. I., Tabeling P., and Bocquet L., Phys. Rev. Lett. 101, 114503 (2008). 10.1103/PhysRevLett.101.114503 [DOI] [PubMed] [Google Scholar]
- Guasto J. S. and Breuer K. S., Exp. Fluids 45, 157 (2008). 10.1007/s00348-008-0471-y [DOI] [Google Scholar]
- Li H. F. and Yoda M., Meas. Sci. Technol. 19, 075402 (2008). 10.1088/0957-0233/19/7/075402 [DOI] [Google Scholar]
- Ohtsu M. and Kobayashi K., Optical Near Fields (Springer-Verlag, Berlin, Germany, 2004). [Google Scholar]
- Eddington D. T., Puccinelli J. P., and Beebe D. J., Sens. Actuators B 114, 170 (2006). 10.1016/j.snb.2005.04.037 [DOI] [Google Scholar]
- Bruus H., Theoretical Microfluidics (Oxford University Press, Oxford, 2007). [Google Scholar]
- Young I. T., Gerbrands J. J., and van Vliet L. J., The Digital Signal Processing Handbook (CRC, Boca Raton, FL, 1998), Chap. 51. [Google Scholar]
- See: http://www.diplib.org/.
- Guasto J. S., Huang P., and Breuer K. S., Exp. Fluids 41, 869 (2006). 10.1007/s00348-006-0202-1 [DOI] [Google Scholar]
- Westerweel J., “Digital particle image velocimetry: Theory and application,” Ph.D. thesis, Delft University, 1993. [Google Scholar]
- Huang P., “Near-surface slip flow and hindered colloidal diffusion at the nano-scale,” Ph.D. thesis, Brown University, 2006. [Google Scholar]
- Huang P., Guasto J. S., and Breuer K. S., J. Fluid Mech. 637, 241 (2009). 10.1017/S0022112009990656 [DOI] [Google Scholar]
- Cussler E. L., Diffusion: Mass Transfer in Fluid Systems (Cambridge University Press, Cambridge, 1997). [Google Scholar]
- Happel J. and Brenner H., Low Reynolds Number Hydrodynamics: With Special Applications to Particulate Media (Springer, New York, 1983). [Google Scholar]


