Abstract
In ac electrowetting, hydrodynamic flows occur within a droplet. Two distinct flow patterns were observed, depending on the frequency of the applied electrical signal. The flow at low-frequency range was explained in terms of shape oscillation and a steady streaming process in conjunction with contact line oscillation. The origin of the flow at high-frequency range has not yet been explained. We suggest that the high-frequency flow originated mainly from the electrothermal effect, in which electrical charge is generated due to the gradient of electrical conductivity and permittivity, which is induced by the Joule heating of fluid medium. To support our argument, we analyzed the flow field numerically while considering the electrical body force generated by the electrothermal effect. We visualized the flow pattern and measured the flow velocity inside the droplet. The numerical results show qualitative agreement with experimental results with respect to electric field and frequency dependence of flow velocity. The effects of induced-charge electro-osmosis, natural convection, and the Marangoni flow are discussed.
INTRODUCTION
In digital microfluidics or droplet-based microfluidics, tiny droplets are used as containers of reagents and biological particles, as well as a medium in which biochemical reactions and analyses are performed. The digital microfluidic operations can be performed on planar substrates or inside microchannels. Recently, the field of digital microfluidics has drawn much attention, owing to its several advantages. These include the following: (1) The required volumes of samples and reagents are reduced, (2) the duration of analysis is reduced, and (3) the adhesion problem is mitigated through the replacement of a liquid-solid wall contact by a liquid-liquid or liquid-gas interfaces.1
Electrowetting is one of the most popular methods to actuate droplets in digital microfluidics. In electrowetting, droplets can be transported, mixed, and split by electrically controlling the contact angle on a patterned electrode array.2, 3, 4, 5, 6 In electrowetting, however, the electrical wetting tension, which drives the spreading of a droplet, is only weakly dependent on the polarity of the applied voltage;7, 8, 9 therefore, one may use alternating voltage instead of direct current (dc) voltage. Use of ac signal has benefits including reduction in contact angle hysteresis,10 delay of contact angle saturation,11 and reduction in ion adsorption at the liquid-substrate interface.12 In ac electrowetting, the electrical wetting tension has a time-independent mean component and a time-periodic oscillatory component. The former contributes to the mean change in contact angle. The oscillatory component induces oscillation of the contact line,13, 14 which causes interesting phenomena such as generation of steady streaming13 and synthetic jetting,15 as well as reduction in contact line hysteresis.10
As for the hydrodynamic flows inside a droplet, two kinds of flow patterns have been observed13 for the needle-and-plane-electrode configuration (see Fig. 1 in Ref. 13). At low-frequency ranges up to ∼10 kHz, the flow direction is upward near the needle electrode [see Fig. 3a in Ref. 13]. As the frequency is increased further, the flow disappears at a certain frequency range. Above the certain frequency that depends on electrolyte concentration, a clearly different flow pattern from the low-frequency flow appears, in which the direction of flow is reversed when compared to the low-frequency flow [see Fig. 3c in Ref. 13]. Such hydrodynamic flows are applicable to mixing of droplets and may mitigate the adsorption problem of DNAs, polymers, and carbon nanotubes on substrate walls.
We previously suggested that the shape oscillation and steady streaming process are responsible for the low-frequency flow.13, 14 On the other hand, the oscillation amplitude becomes extremely small at high-frequency ranges to explain the observed high-frequency flow. The mechanism of the high-frequency flow has not yet been explained. In the present work, we investigate the origin of the high-frequency flow. We visualized the flow pattern and measured the flow velocity within the droplet. Incompressible flow inside a droplet was numerically analyzed, considering the Joule heating effect and the temperature dependence of the electrical conductivity and permittivity. The experimental results were compared to numerical results and the two showed qualitative agreement. We suggest that the high-frequency flow is caused mainly by the electrothermal effect, in which the electrical charges are induced by conductivity and permittivity gradients.
EXPERIMENTS
We employed a conventional needle-and-a-plane-electrode setup that has been employed for basic studies of electrowetting. In this setup, an aqueous NaCl droplet is placed on an insulator-coated indium tin oxide (ITO) electrode. The droplet is surrounded by air and its initial volume is 5 μl. The concentration of the NaCl solution (c) is 0.1 mM in the experiment, unless otherwise stated. The conductivity of the solution mixed with seeding particles is measured by a conductivity meter (Orion 4-Star, Thermo Scientific) and its value was 1.8 mS∕m. The seeding particle (Nile Red F8825, Molecular Probes) is supplied in the form of colloidal suspension. The lowest frequency at which the high-frequency flow appears increases with electrolyte concentration.13 The bandwidth of the amplifier we used is about 300 kHz. Such a low value of concentration is chosen to fully investigate the effect of frequency on flow velocity. On top of the ITO electrode, parylene-C and Teflon® AF1600 are coated in 5 μm and 100 nm thicknesses, respectively. We used a tungsten wire with an 80 μm diameter as the needle electrode. The electrical voltage and the frequency were changed in the range of 50–130 Vrms and 50–310 kHz, respectively. The applied voltage was monitored by an oscilloscope (Scope meter 199C, Fluke). The flow velocity was measured by the particle image velocimetry (PIV) method. Further details on the experimental method are described in Ref. 13.
The flow field is distorted by the lens effect of the droplet itself. As a consequence, the lower central part of a droplet image is enlarged due to the lens effect. This leads to overestimations of the observed velocities within that region. To obtain accurate values of the velocity, the distorted image should be corrected before calculating the flow velocity in the PIV technique. For this purpose, we adopted an image-correction method that is based on geometrical optics and developed by one of the authors.16
ELECTROTHERMAL FLOW AND GOVERNING EQUATIONS
The electrical body force acting on a fluid can be represented by the following Korteweg–Helmholtz body force density:
| (1) |
where ρf is the free charge density, E=−∇ϕ is the electric field, ϕ is the electrical potential, E=∣E∣ is the electric field strength, ε is the electrical permittivity, and ρ is the mass density of medium. The third pressurelike term (electrostriction term) has no effect on incompressible flows and can be absorbed into the pressure term of the Navier–Stokes equation. Equation 1 implies that free charge or gradient of electrical permittivity should exist for existence of a flow. The free charge can be induced inside a fluid medium by way of the Maxwell–Wagner polarization when a gradient of electrical conductivity or permittivity exists.17 On the other hand, both electrical conductivity and permittivity are quite significantly influenced by temperature. For example, for KCl solution, the electrical conductivity and permittivity change at rates of 2%∕K and −0.4%∕K, respectively. The resulting electrohydrodynamic (EHD) flow due to the imposed or induced temperature gradient by the Joule heating is called the electrothermal flow.
In the electrothermal flow, electric, flow, and temperature fields are, in principle, mutually coupled and should be analyzed simultaneously. Green et al.18, 19 developed a simplified approach toward the analysis of the electrothermal flow, which is based on the perturbation expansion of variables under the assumption of small temperature gradient. In Sec. 4, we briefly describe the method of Green et al. which was used in this work.
Under the quasielectrostatic approximation,20 the governing equation for electric field is reduced to the following Gauss law and charge conservation equation:
| (2) |
| (3) |
When diffusion currents and convection currents are negligible compared to electromigration, the current density J satisfies the following Ohm’s law:
| (4) |
The convective current is neglected because the electrical Reynolds number,18 which measures the ratio of convection current and conduction current, is as small as uε∕σl∼10−6, where u represents the characteristic flow velocity, σ is the electrical conductivity of fluid, l=(3V∕4π)1∕3 is the equivalent radius of a droplet, and V is the droplet volume. Diffusion current is important when concentration gradient of ions is significant, which is not the case of the present investigation.
When the temperature change is small, the resulting change in electrical conductivity and permittivity should be small. Therefore, ρf≅0 to the zeroth order. Substitution of Eq. 4 into Eq. 3 leads to the Laplace equation for the zeroth order electrical potential ϕ0. So, the complex potential satisfies
| (5) |
The complex potential is related with electric potential as , where Re[f] represents the real part of complex function f. Combining Eqs. 2, 3, we obtain the charge density for ac fields as
| (6) |
where , α≡ε−1(∂ε∕∂T), β≡σ−1(∂σ∕∂T), , ω=2πf is the angular frequency, and T is the temperature. For aqueous KCl solutions, α≈−4×10⁻³ K−1 and β≈2×10⁻² K−1. The NaCl solutions used in our experiments have almost similar thermal coefficients as KCl.21 Substituting Eq. 6 into Eq. 1, we obtain the time-averaged electrical force density as
| (7) |
where asterisk ( *) represents the complex conjugate operation and ⟨f⟩ is the time-averaged value of f. The charge density and body force can be computed, independent of flow field. To derive Eq. 7, the temperature fluctuation is assumed to be negligible.22 For the present system, typical heat-diffusion time, tα=l2∕αt, is about 0.1 s, where αt≡k∕(ρcp) is the thermal diffusivity, cp is the specific heat at constant pressure, and k is the thermal conductivity. It means that the temperature fluctuation is negligible for an electric field of frequency greater than roughly 10 Hz.
Time-averaged equations for the flow field and temperature field are described by the following continuity condition, time-averaged Navier–Stokes equation, and energy equation:
| (8) |
| (9) |
| (10) |
where u and p represent the time-averaged flow velocity and pressure, μ is the fluid viscosity, and σE2 is the rate of heat generation by the Joule heating. The typical values of the Reynolds number (Re=ul∕ν, ν≡μ∕ρ) and the Peclet number (Pe=ul∕αt) are about 1 and 10, respectively. Therefore, the convective contributions to the flow and temperature fields should be considered.
Other material properties of ρ, μ, cp, and k are also functions of temperature. The gradient of mass density may cause the natural convection, which will be separately considered later. We checked that the change in and resulting spatial gradient of μ, cp, and k each hardly affect the flow field. Therefore, in the simulation, we assumed that all material properties are constant except the electrical conductivity and permittivity.
NUMERICAL ANALYSIS
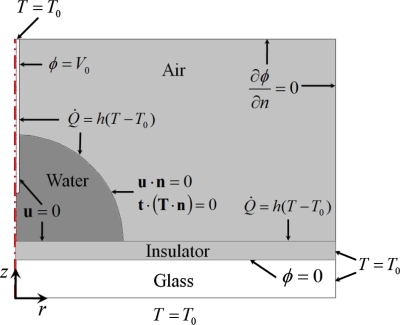
Equations 5, 8, 9, 10 were analyzed by using the commercial software COMSOL MULTIPHYSICS® 3.5a, which is based on the finite element method. We assumed that the present system is axially symmetric, and therefore, we considered only the half region of a droplet (Fig. 1). The numerical domain is composed of needle electrode, droplet, air, insulating layer, and glass substrate. The thickness of the insulation layer (d) is 5 μm and droplet volume is 5 μl, which are consistent with experimental conditions. When we considered the voltage dependence of the flow velocity, the contact angle was fixed at 90° for simplicity of analysis. The contact angle was fixed at 108° when we consider frequency dependency at Vrms=90 V. In reality, the contact angle does not change significantly with frequency at high-frequency range.11 The radius of the needle electrode is 40 μm. We confirmed that the tip shape of the needle electrode has only a negligible effect on both temperature and flow velocity. The volume change in the droplet due to evaporation was not considered. The thicknesses of the Teflon layer and the ITO layer are very thin, e.g., ∼100 nm; therefore, the electrical and thermal impedances are very small. We neglected the inclusion of two layers in the analysis of both the electric field and the temperature field. Distances between the tip of needle electrode and the substrate surface right beneath the needle electrode (L) are 0.58 and 0.60 mm. The numerical domain is 4 mm in the radial direction and 4.7 mm in the axial direction. We confirmed that this domain size is enough to analyze the electric field, and no noticeable boundary effect appears. The whole domain was discretized by about 60 000 elements, where elements were concentrated especially at the tip of needle electrode and insulating layer regions.
Figure 1.
Domain of analysis and applied boundary conditions.
First, the electric field was analyzed using Eq. 5, and then for a given electric field, the temperature and velocity fields were solved iteratively. The electrical field was analyzed for the droplet, air, and insulating layer regions. The boundary conditions used for solving the three fields are summarized in Fig. 1. At the needle and substrate electrodes, the time-periodic potential was assigned as . At every other interface, continuity conditions on the current were applied. At the outer boundaries of the computational domain, an insulating condition was applied. We chose the dielectric constants of water, air, and the insulating layer as εw=78.5, εa=1, and εi=3.1, respectively.23 The conductivities of water were σw=1.8×10⁻³ S∕m and 6.3×10⁻³ S∕m for the two different electrolyte concentrations of c=0.1 and 0.5 mM, respectively. Ohmic currents in the air and the insulation layer were neglected because the conductivities of air and the insulating layer are much smaller than those of electrolytes.
The temperature field was analyzed for the droplet, substrate, and needle electrode regions. At the droplet-air, needle-air, and substrate-air interfaces, the convection heat transfer condition was applied, in which the convection heat transfer coefficient was chosen as 10. The ambient temperature (T0) had no effect in the present steady-conduction problem. Little change occurred within the temperature field when we considered the conduction in air and apply the continuity of heat flux condition at the three interfaces, instead of applying the convection boundary condition. At other boundaries, a constant temperature condition was applied. The velocity field was analyzed only for the droplet region because the density of air is negligible. At the surface of the electrodes, the no slip was applied. At the droplet-air interface, the free surface condition was applied. In Fig. 1, T represents the hydrodynamic stress tensor, and n and t are the outward unit normal vector and unit tangential vector at droplet surface, respectively.
RESULTS AND DISCUSSION
To investigate the effect of frequency on the electric field inside a droplet, we computed the electric field for an aqueous 0.1 mM NaCl droplet with a 5 μl volume. The applied voltage was fixed at Vrms=90 V and frequency was changed to 0 Hz, 10 kHz, 100 kHz, and 1 MHz (Fig. 2). For the dc case, no electric field existed inside the droplet because the droplet behaves like a perfect conductor in this case.11 As frequency increases, the number of potential contours also increases, which means that the electric field gets stronger inside the droplet. In fact, the droplet-insulator system can be represented as a series of impedances of droplet and insulating layers. The impedance of the droplet is represented by a resistor and a capacitor in parallel, and the insulator as a capacitor.11 The capacitance of the droplet is much smaller than that of insulator. If the capacitor of insulator is completely charged, there will be no current flow and no electric field exists at the resistor. This case corresponds to the dc case. As the frequency increases, there is insufficient time to completely charge the capacitor of insulator; therefore a current flow and electric field exist in the resistor, i.e., inside the droplet. That is why the electric field becomes strong inside the droplet at high frequency.
Figure 2.
Potential distributions for Vrms=90 V, L=0.58 mm, and electrolyte concentration of 0.1 mM (σ=1.8 mS∕m). The contour interval is 10 V.
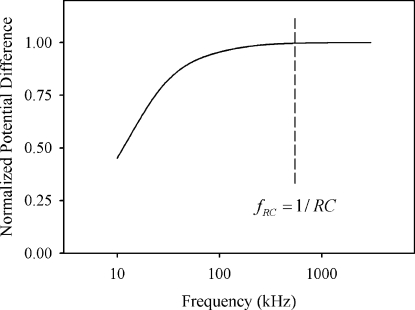
To see the effect of the frequency, we computed the potential difference between the tip of the needle electrode and the substrate surface right beneath the needle electrode (Fig. 3). The potential difference was normalized by the potential difference at f=3 MHz. The potential difference increased with frequency and became almost saturated at around RC frequency of fRC=1∕RC≈σwd∕εiL. Above this frequency region, the applied electric field inside the droplet hardly changed with frequency.
Figure 3.
Frequency dependence of the potential difference inside droplet.
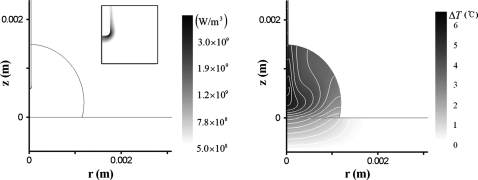
The electric field inside the droplet leads to the Joule heating of the fluid. The rate of heat generation by the Joule heating is proportional to E2. At low-frequency ranges, the electric field is rather weak; therefore, the Joule heating effect is more remarkable at high-frequency ranges. Figure 4 shows the electric field strength, heat generation rate, and temperature distribution when f=110 kHz, in which conditions are identical to those of Fig. 2. Because the electric field is most intense around the tip of the needle electrode, the heat generation rate and temperature should be greatest there. On the other hand, overall temperature distribution is highly affected by the convective motion of fluid (Fig. 4). We measured the temperature inside a droplet using a thermocouple submerged at the center region of the droplet. The data were read immediately after stopping application of voltage. The measured temperature rise was about 3 °C which is amid the numerical values in Fig. 4.
Figure 4.
Rate of Joule heating (left) and temperature distribution (right). Darkness level indicates magnitude of rate of the Joule heating and temperature. The maximum temperature rise is 6.9 °C. c=0.1 mM (σ=1.8 mS∕m), Vrms=90 V, L=0.58 mm, and f=110 kHz.
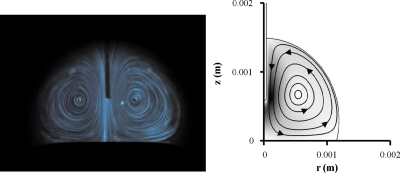
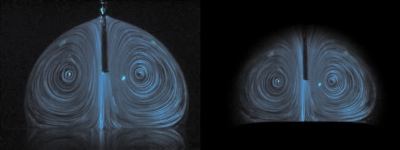
Such a nonuniform distribution of temperature induces the electrothermal flow, as described in Sec. 3. The computed results show that flow direction is counterclockwise at the right-hand side of a droplet (Fig. 5). The flow field is consistent with the experimental result.
Figure 5.
Comparison of streamlines between experimental (left) and numerical results (right). Darkness level represents the magnitude of flow velocity. Lens effect is corrected on the left-hand side photograph.
The numerical results for the flow field were compared to experimental results obtained by the PIV technique. As mentioned in Sec. 2, the lens effect of droplet was corrected before PIV processing. Figure 6 compares the images before and after the correction process. The center region is slightly contracted after the correction. The restoration quality is not satisfactory at the droplet-air interface. This is because the lens effect contracts images taken at the periphery of the droplet, and restoration to undistorted image is limited due to camera resolution.16 We used the velocity data of the center region for comparison with numerical result.
Figure 6.
Correction of lens effect. (Left photograph) Original image. (Right photograph) Restored image.
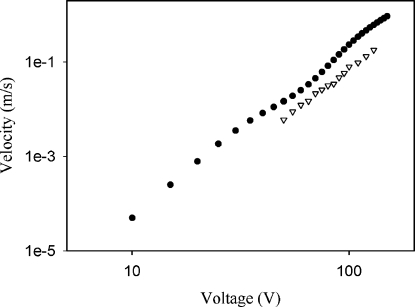
The flow velocity increased with a voltage applied at a rate of Ea. The value of a in experiment is about 3.5 (Fig. 7). Here, flow velocity represents an average of the flow velocity around the center region between the needle electrode and substrate. Such a large value of exponent is one of the characteristic features of the electrothermal flow.19 For many EHD flows, the free charge density is proportional to E, and therefore, flow velocity increases with approximately E2. For electrothermal flows, according to Eq. 7, the body force due to the electrothermal effect (∣fe∣) is proportional to ∣∇T∣×E2, where ∣∇T∣∝σE2. Therefore, ∣fe∣∝E4, and consequently, flow velocity is proportional to E4. However, there is a quite strong electrothermal flow inside a droplet, and temperature gradient is reduced due to the convective mixing. That is probably why a is slightly smaller than the ideal value of 4 in experiment. The numerical result for the flow velocity is about two times greater than experimental results. The deviation may be due to the simplifying assumptions introduced in the numerical analysis, such as the fixed shape of droplet and the assumed small change in temperature. In addition, the flow velocity due to the Marangoni flow, which may affect the flow velocity a little, is not considered in the numerical analysis. (The effect of Marangoni flow will be discussed later.)
Figure 7.
Voltage dependence of flow velocity for numerical results (filled circles) and experimental results (hollow triangle). c=0.5 mM (σ=6.3 mS∕m), L=0.60 mm, and f=110 kHz.
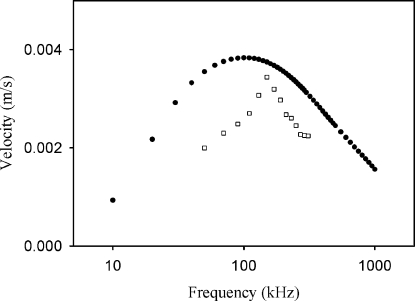
The flow velocity shows strong frequency dependence (Fig. 8). It has a peak at 110 kHz for numerical results and 150 kHz for experimental results. The frequency affects the flow velocity in two ways. First, it affects the strength of electric field inside the droplet. As shown in Fig. 3, electric field strength increases with frequency. Second, free charge density is inversely proportional to frequency, as shown in Eq. 6. Since the present EHD flow is caused mainly by the Coulombic force of ρfE, the flow velocity should have a peak frequency. Deviation between numerical result and experimental result in peak frequency is about 36%. First, we can assume that the uncertainty of electrical conductivity of electrolyte solution is responsible for the deviation. Because we used a rather dilute electrolyte solution, the conductivity was more or less sensitive to contamination by impurity. The conductivity of a sample solution increased by 20% of initial value after 48 h. Moreover, evaporation of water in the droplet during the experiment may anyhow lead to the increase in NaCl concentration and electrical conductivity. In fact, the peak frequency is linearly proportional to the conductivity of the electrolyte solution. This potential increase in electrical conductivity may explain the greater peak frequency observed in experiment. However, it is conflicting with the fact that the flow velocity obtained experimentally is smaller than numerical values. If the conductivity increases, the flow velocity should also increase. The reason of the deviation in peak frequency is unclear yet.
Figure 8.
A comparison of the frequency dependency of the flow velocity between the numerical (filled circles) and experimental results (hollow rectangles) (c=0.1 mM, σ=1.8 mS∕m, L=0.58 mm, and Vrms=90 V).
Comparing the voltage dependence of the flow velocity, we may conclude that the present flow is caused by the electrothermal effect, although there is some deviation in frequency dependence. In what follows, we consider the effect of natural convectional, the Marangoni flow, and the ac electro-osmosis.
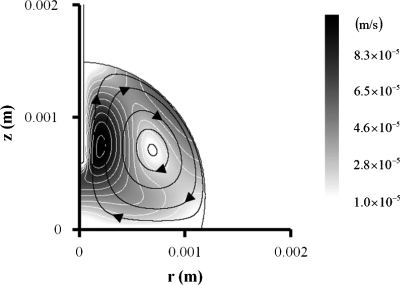
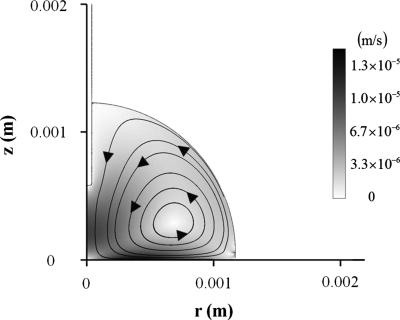
We computed the flow field due to natural convection, considering the buoyancy force term in the time-averaged Navier–Stokes equation [Eq. 9] (Fig. 9). The volumetric thermal expansion coefficient of water is set to 1.8×10⁻⁴ K−1. The density is lowest around the tip of electrode because the temperature is greatest at that region. Therefore, the buoyancy force is directed upward at that region, and the flow direction is upward near the tip of electrode. The flow direction is reversed with respect to the electrothermal flow, and the maximum flow velocity is as low as 1.03×10⁻⁴ m∕s. This value is one order of magnitude smaller than experimental values. As a result, natural convection seems to have a negligible effect on the present flow.
Figure 9.
Streamlines (solid lines) and velocity contours of the flow due to natural convection. Darkness level is proportional to fluid velocity (c=0.1 mM, σ=1.8 mS∕m, Vrms=90 V, L=0.58 mm, and f=110 kHz).
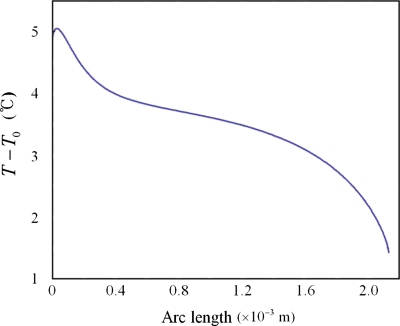
The thermocapillary (Marangoni) flow is generated due to the temperature gradient at the surface, and the resulting flow direction is from the high temperature region and toward the low temperature region. The temperature is generally greater at the top region and lower at the contact line region. Based on the computed temperature distribution shown in Fig. 10, we can conclude that the flow direction is again reversed with respect to the electrothermal flow. This is because the shear stress at the droplet surface due to the Marangoni effect is oriented toward the contact line region. We are not aware of how much the Marangoni flow affected the present flow. However, it is certain that the Marangoni flow is not the dominating mechanism for the present flow.
Figure 10.
Temperature distribution on the surface of a drop (c=0.1 mM, σ=1.8 mS∕m, Vrms=90 V, L=0.58 mm, and f=110 kHz).
The ac electro-osmotic flow (ACEOF) or induced-charge electro-osmosis is generated by nonuniform ac electric field. The direction of the ACEOF on top of electrodes is from the region of higher electric field strength to the region of lower electric field strength.24 Therefore, the direction of the ACEOF for the present system is from the center region of a droplet to the contact line region, near the droplet-substrate interface. Thus, the flow direction is consistent with the present flow. However, numerical analysis based on the method of Green et al.24 showed that the magnitude of the ACEOF is much smaller than the present flow (Fig. 11). The maximum flow velocity is in order of 0.01 mm∕s for the ACEOF while it is in order of 1 mm∕s for the present flow for the same conditions. Moreover, the velocity of the ACEOF is proportional to E2 and the flow pattern is very dissimilar with respect to the experimental results. Therefore, we can conjecture that the ACEOF only negligibly contributed to the flow observed in experiment. Previous experiment of our group showed that the flow patterns are strongly affected by the position and the direction of the needle electrode (see Figs. 5 and 6 in Ref. 13). This result also implies that the present flows are not generated near the droplet-substrate interface but near the needle electrode.
Figure 11.
Streamlines (solid lines) and velocity contours of the ACEOF. Darkness level is proportional to fluid velocity (c=0.1 mM, σ=1.8 mS∕m, Vrms=90 V, L=0.58 mm, and f=110 kHz).
CONCLUSIONS
We scrutinized the mechanism of high-frequency flows in ac electrowetting. The numerical simulation based on the electrothermal effect reproduced important characteristics of the high-frequency flow observed in experiment, such as the pattern of the flow streamlines, voltage, and frequency dependence of flow velocity. According to numerical analyses, the natural convection and ACEOF have only negligible effects on the present flow. The direction of the Marangoni flow is reversed to the present flow. These results strongly support the proposition that the flow originates from an electrothermal effect. A strong and nonuniform electric field near the needle electrode induces concentrated Joule heating, temperature gradient, and ultimately, the electrothermal flow. The present electrohydrodynamic flow is applicable to mixing of reagents and reducing adsorption of molecules to a liquid-solid interface in digital microfluidics. The flow can be produced not only in the needle-plane-electrode configuration but also in various electrode configurations of electrowetting, which can induce a nonuniform electric field.
Note added in proof. While revising this manuscript, we learned that similar work was reported by P. García-Sánchez, A. Ramos, and F. Mugele, “Mixing and electrothermally driven flow in ac electrowetting,” Phys. Rev. E (in revision).
ACKNOWLEDGMENTS
This work was supported by the Korea Research Foundation (KRF) grant funded by the Korean government (MEST) (Nos. KRF-2006-331-D00058 and R0A-2007-000-20098-0).
References
- Berthier J., Microdrops and Digital Microfluidics (William Andrew, Norwich, NY, 2008). [Google Scholar]
- Pollack M. G., Fair R. B., and Shenderov A. D., Appl. Phys. Lett. 77, 1725 (2000). 10.1063/1.1308534 [DOI] [Google Scholar]
- Cho S. K., Moon H., and Kim C. J., J. Microelectromech. Syst. 12, 70 (2003). 10.1109/JMEMS.2002.807467 [DOI] [Google Scholar]
- Mugele F. and Baret J. C., J. Phys.: Condens. Matter 17, R705 (2005). 10.1088/0953-8984/17/28/R01 [DOI] [Google Scholar]
- Mugele F., Baret J. C., and Steinhauser D., Appl. Phys. Lett. 88, 204106 (2006). 10.1063/1.2204831 [DOI] [Google Scholar]
- Nichols K. P. and Gardeniers H. J. G. E., Anal. Chem. 79, 8699 (2007). 10.1021/ac071235x [DOI] [PubMed] [Google Scholar]
- Quinn A., Sedev R., and Ralston J., J. Phys. Chem. B 107, 1163 (2003). 10.1021/jp0216326 [DOI] [Google Scholar]
- Kang K. H., Langmuir 18, 10318 (2002). 10.1021/la0263615 [DOI] [Google Scholar]
- Kang K. H., Kang I. S., and Lee C. M., Langmuir 19, 5407 (2003). 10.1021/la034163n [DOI] [Google Scholar]
- Li F. and Mugele F., Appl. Phys. Lett. 92, 244108 (2008). 10.1063/1.2945803 [DOI] [Google Scholar]
- Hong J. S., Ko S. H., and Kang K. H., Microfluid. Nanofluid. 5, 263 (2008). 10.1007/s10404-007-0246-4 [DOI] [Google Scholar]
- Yoon J. -Y. and Garrell R. L., Anal. Chem. 75, 5097 (2003). 10.1021/ac0342673 [DOI] [PubMed] [Google Scholar]
- Ko S. H., Lee H., and Kang K. H., Langmuir 24, 1094 (2008). 10.1021/la702455t [DOI] [PubMed] [Google Scholar]
- Oh J. M., Ko S. H., and Kang K. H., Langmuir 24, 8379 (2008). 10.1021/la8007359 [DOI] [PubMed] [Google Scholar]
- Ko S. H., Lee S. J., and Kang K. H., Appl. Phys. Lett. 94, 194102 (2009). 10.1063/1.3123165 [DOI] [Google Scholar]
- Kang K. H., Lee S. J., Lee C. M., and Kang I. S., Meas. Sci. Technol. 15, 1104 (2004). 10.1088/0957-0233/15/6/009 [DOI] [Google Scholar]
- Morgan H. and Green N. G., AC Electrokinetics: Colloids and Nanoparticles (Research Studies, Baldock, UK, 2003), Chap. 3. [Google Scholar]
- Green N. G., Ramos A., González A., Castellanos A., and Morgan H., J. Electrost. 53, 71 (2001). 10.1016/S0304-3886(01)00132-2 [DOI] [Google Scholar]
- González A., Ramos A., Morgan H., Green N. G., and Castellanos A., J. Fluid Mech. 564, 415 (2006). 10.1017/S0022112006001595 [DOI] [Google Scholar]
- Castellanos A., Electrohydrodynamics (Springer, New York, 1998), Chap. 1. [Google Scholar]
- CRC Handbook of Chemistry and Physics, 87th ed., edited by Lide D. R. (CRC, Boca Raton, FL, 2007), pp. 5–73. [Google Scholar]
- Ramos A., Morgan H., Green N. G., and Castellanos A., J. Phys. D: Appl. Phys. 31, 2338 (1998). 10.1088/0022-3727/31/18/021 [DOI] [Google Scholar]
- V&PS, parylene properties and characteristics, V&P Scientific, 2009, available via http://www.vp-scientific.com/parylene_properties.htm, accessed 17 August 2009.
- Green N. G., Ramos A., González A., Morgan H., and Castellanos A., Phys. Rev. E 66, 026305 (2002). 10.1103/PhysRevE.66.026305 [DOI] [PubMed] [Google Scholar]


