

Abstract
Odorants are represented as spatiotemporal patterns of spikes in neurons of the antennal lobe (AL; insects) and olfactory bulb (OB; vertebrates). These response patterns have been thought to arise primarily from interactions within the AL/OB, an idea supported, in part, by the assumption that olfactory receptor neurons (ORNs) respond to odorants with simple firing patterns. However, activating the AL directly with simple pulses of current evoked responses in AL neurons that were much less diverse, complex, and enduring than responses elicited by odorants. Similarly, models of the AL driven by simplistic inputs generated relatively simple output. How then are dynamic neural codes for odors generated? Consistent with recent results from several other species, our recordings from locust ORNs showed a great diversity of temporal structure. Furthermore, we found that, viewed as a population, many response features of ORNs were remarkably similar to those observed within the AL. Using a set of computational models constrained by our electrophysiological recordings, we found that the temporal heterogeneity of responses of ORNs critically underlies the generation of spatiotemporal odor codes in the AL. A test then performed in vivo confirmed that, given temporally homogeneous input, the AL cannot create diverse spatiotemporal patterns on its own; however, given temporally heterogeneous input, the AL generated realistic firing patterns. Finally, given the temporally structured input provided by ORNs, we clarified several separate, additional contributions of the AL to olfactory information processing. Thus, our results demonstrate the origin and subsequent reformatting of spatiotemporal neural codes for odors.
Introduction
Sensory systems sample the environment, translating external stimuli into transient and sometimes enduring internal neural codes or representations. In the olfactory system, volatile odorants are detected in the periphery by olfactory receptor neurons (ORNs), which transduce chemical stimuli into electrical signals that are relayed downstream to the olfactory bulb (OB) or the antennal lobe (AL). In the AL and OB, neural codes for odors take the form of spatiotemporal patterns of activity distributed across ensembles of principal neurons [projection neurons (PNs) in insects, mitral cells in vertebrates] (Laurent and Davidowitz, 1994; Laurent et al., 1996; Giraudet et al., 2002). These odor-evoked ensemble responses, which contain information about odor identity, intensity, and timing (Laurent et al., 1996; Stopfer et al., 2003; Brown et al., 2005; Bathellier et al., 2008), are reliable over repeated trials and, particularly in insects, can be quite elaborate, often consisting of sequences of excitation and inhibition that together can long outlast the eliciting odor stimulus (Perez-Orive et al., 2002; Brown et al., 2005). These dynamic patterns change most rapidly during the odor's onset and offset (Mazor and Laurent, 2005). When responding to the middle portions of lengthy odor presentations, the firings of principal neurons tend to settle into stable excitatory or inhibitory patterns; at the ensemble level, these steady-state epochs have been described, in the language of dynamical systems analysis, as “fixed points” (Mazor and Laurent, 2005; Bathellier et al., 2008).
How are these dynamic neural codes for odors generated? The spatiotemporal odor response patterns have been thought to arise primarily from excitatory and inhibitory neural network interactions within the AL/OB (Meredith, 1986; Wehr and Laurent, 1999; Laurent, 2002; Spors and Grisvald, 2002), an idea supported, in part, by the assumption that ORNs respond to odors with simple firing patterns that vary little in temporal profile across the population of ORNs (Bazhenov et al., 2001a,b). Recently, however, electrophysiological recordings from several species (Michel and Ache, 1994; Ochieng et al., 1998; Hallem and Carlson, 2006; Spors et al., 2006) have shown that ORNs can respond to a single odor puff in a variety of ways. Here we examined the contributions of the ORNs themselves to establishing spatiotemporal odor codes and reassessed the contributions of the AL circuits to processing olfactory information. First, we sought to characterize the temporal structures of odor-evoked responses of ORNs in locusts. We found that responses of ORNs are not temporally homogeneous across the population but, rather, are temporally heterogeneous: the firing rates, and the rates of change of those firing rates, varied both with the type of ORN and with the odor we presented. Using computational models constrained by results of our recordings, we then analyzed the contributions of the temporal structure of ORN responses to subsequent processing by the AL circuits. Specifically, we tested both in the model and in vivo the importance of temporal heterogeneity in ORN firing patterns to the generation of spatiotemporal responses within the AL. Finally, systematically comparing the characteristics of odor codes in populations of ORNs in the antenna and in ensembles of PNs in the AL, we revealed the separate contributions of these circuits for establishing the odor code.
Materials and Methods
Odor stimulation.
Odors were delivered as described previously (Brown et al., 2005). Briefly, odorant solutions (neat unless noted otherwise) were placed in 60 ml glass bottles. Odor pulses were delivered by injecting a measured volume (0.1 L/min) of the static headspace above the odorants into an activated, carbon-filtered air stream (0.75 L/min) flowing continuously across the antenna. A large (11 cm) vacuum funnel was placed behind the antenna to remove the delivered odorants. Odorants used in our study were as follows: hexanol (HEX); hexanal (HXA); octanol (OCT1, OCT10, OCT100; respectively, 1, 10, and 100% solutions diluted in mineral oil); 3-octanol (3OCT); linalool (LIN); geraniol (GER); trans-2-hexen-1-ol (T2H1OL); trans-2-hexenal (T2H); farnesol (FAR); octanoic acid (OCTAC); hexanoic acid (HXAC); methyl salicylate (MES); blend (BLND; a mix of all odorants); and grass blend (GRB; a mix of odor components of grass including HEX, OCT, 3OCT, and T2H1OL).
Electrophysiology.
Recordings were made from young adult locusts (Schistocerca americana) of either sex raised in a crowded colony. To make recordings from PNs, animals were immobilized, and the brain, along with the antennal nerve, was exposed, desheathed, and superfused with locust saline at room temperature as described previously (Laurent and Davidowitz, 1994; Stopfer and Laurent, 1999).
ORN recordings were made from different types of sensilla on immobilized, intact, or cut antennae. Sharpened tungsten electrodes or saline-filled blunt glass micropipettes (∼10 μm diameter, ∼10 MΩ) were inserted into the base of the sensilla to monitor ORN responses extracellularly. A reference Ag/AgCl wire was inserted into the cut end of the antenna or into the gut. Acquired signals were amplified using a differential amplifier (Grass P55). Sensillae contain multiple ORNs; spike sorting was achieved off-line with Spike-o-Matic software (Pouzat et al., 2002) implemented in IGOR Pro (Wavemetrics). In our recordings from ORNs, spike amplitude changed somewhat as ORNs adapted to odors. When sorting these spikes, we allowed each cell cluster to include events with amplitude variability as long as different sorted clusters remained well separated (by at least five times noise SD), and, within a cluster, an appropriate interspike interval distribution was maintained throughout an experiment. (We found that using multiple electrodes to record from a given sensilla contributed very little to the success of spike sorting as each electrode detected essentially the same waveform.) Examples of spike sorting of ORN responses are shown in supplemental Fig. S6 (available at www.jneurosci.org as supplemental material). A total of 53 ORNs were monitored. Our sample likely underestimates the full diversity of ORN response patterns.
Electroantennogram (EAG) recordings were made using AgCl wires inserted into the cut ends of isolated antennae. The acquired signals were amplified with a DC amplifier (Brownlee Precision). Intracellular recordings were made using sharp glass micropipettes (100–250 MΩ when filled with 0.5 m potassium acetate) pulled by a horizontal puller (P87; Sutter Instrument Company). Intracellular signals were sampled at 5 kHz (LabView software; PCI-MIO-16E-4 DAQ cards; National Instruments) and amplified in bridge mode (Axoclamp-2B; Molecular Devices). Bipolar electrical stimulation was achieved by inserting saline-filled blunt glass micropipettes (∼10 μm diameter, ∼10 MΩ) into the antennal nerve. Current injections (2–5 μA) were applied through a digital stimulus isolator (ISO-Flex; A.M.P.I.). Multiunit recordings from PNs were made using 16-channel, 4 × 4 silicon probes (NeuroNexus Technologies), sampled at 15 kHz, and amplified with a custom 16-channel amplifier (Biology Electronics Shop; Caltech, Pasadena, CA). Spike sorting was achieved off-line using the best four channels recorded and consistent with conservative statistical principles (Pouzat et al., 2002; Brown et al., 2005) using Spike-o-Matic software (Pouzat et al., 2002) implemented in IGOR Pro (Wavemetrics). Examples of spike sorting of PN responses are shown in supplemental Fig. S7 (available at www.jneurosci.org as supplemental material).
Receptor neuron model.
Odor representation in the antenna was modeled with a repertoire of 1000 ORNs consisting of 100 different types of ORNs (10 replicates of each type). The response of each ORN in the model to a given odorant was characterized by the following parameters: response amplitude (from prestimulus baseline to peak), latency, rise and fall time constants, adaptation rate, and baseline response (see Fig. 3 A). Parameter values were chosen to match those we observed in our recordings from ORNs.
Figure 3.
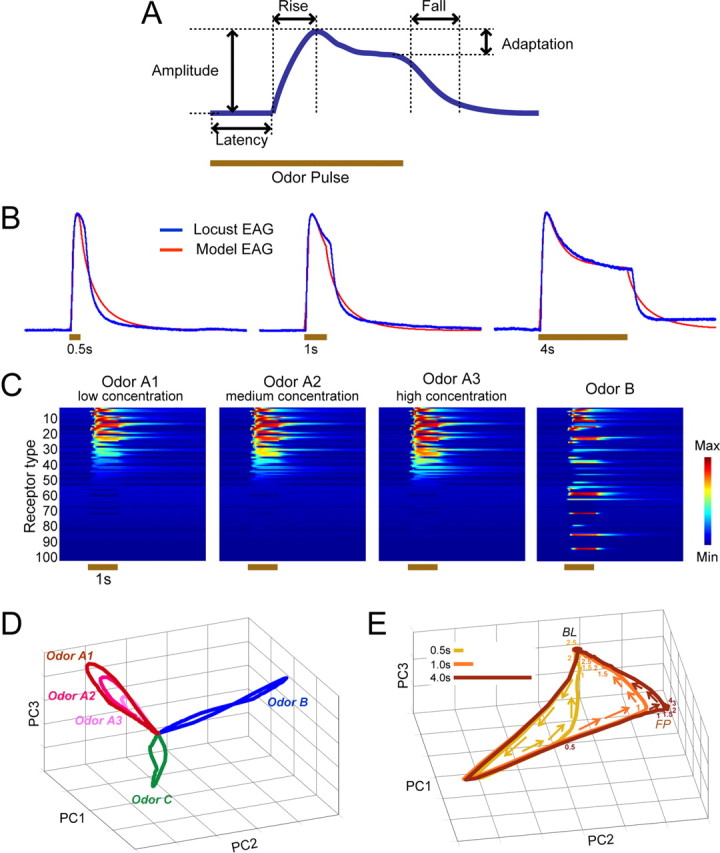
Odor coding in model ORNs. A, In a parametric model of ORNs, the response (firing rate) evoked by an odorant was characterized by its rise, saturation, and fall time constants; its peak amplitude; and its rate of adaptation. For each model ORN, parameters were selected at random from a range determined by our recordings from locust ORNs. B, Our model's diverse ORN responses were constrained such that the sum of its odor-elicited activity (model EAG, red traces) evoked by brief to prolonged stimuli match actual EAG recordings from locust antennae (blue traces). Brown bars indicate odor presentations. C, Model ORN population response. Responses of 100 different types of model ORNs to a single odor (odor A) presented at three different concentrations, and to a different odor (odor B), are shown. D, Model ORN population response trajectories (first 3 principal components) elicited by three concentrations of an odorant and by pulses (1 s) of three different odors show odor manifolds on which different concentrations traced trajectories of different lengths. E, Trajectories show model ORN population responses over time, elicited by odor pulses of three different durations: 500 ms, 1 s, and 4 s. Numbers on the trajectories indicate time (seconds) past odor onset. As in vivo (see Fig. 2 C), brief odor pulses (0.5 s, 1 s) generated only transient onset and offset response dynamics, whereas a long odor pulse (4 s) elicited a stable, fixed point (FP) between odor onset and offset. BL, Baseline; PC, principal component.
When stimulated with an odorant, the ORN response, after the initial latency period (randomly generated for each type from a uniform distribution [0, 200 ms]), increased from its baseline firing rate with a rise time constant (τrise) obtained from a uniform distribution [0, 600 ms]. The ORN response amplitude to a given odor was determined as follows:
where is the three-dimensional selectivity or affinity vector of receptor neuron i, is the three-dimensional vector that defines the odor A, || is the length of the odor vector that represents concentration, θ is the angle between the ORN selectivity vector and the odor vector, p defines the receptive field width of the neuron (uniformly randomly distributed between [1, 15]; small values of p create broadly tuned ORNs, whereas larger values generate sharply tuned receptor neurons), and σ is a sigmoid function (σ(x) = (1 + exp(−a 1(x − a 2))) −1 [a 1 = 15, a 2 = 0.8]). When θ was sufficiently large (θ ≥ 82°), the maximum response amplitude was set to zero to model the inhibitory ORN responses we (and others; Hallem and Carlson, 2006) observed in vivo.
To simulate results from our recordings of ORNs (and published results; Hallem and Carlson, 2006), we modeled two categories of ORN responses with equal probability: those that phasically terminate quickly after a strong initial response and those with more persistent, tonic responses. For ORNs with brief firings, responses were set to follow an α function (t × exp(−2t/τrise)). For ORNs whose responses persisted throughout the duration of the odor pulse, the initial response from baseline to peak amplitude followed t × exp(−t/τrise) (until t = τrise). Subsequently, the responses decreased linearly over time depending on adaptation rates obtained from a uniform random distribution between [0.1, 1]. Finally, after the odorant was removed, the ORN responses returned back to baseline following exp(−t/τfall), where the fall time constant (τfall) for each ORN type was randomly picked from a uniform distribution over the interval [0, 1200 ms].
To realize an ORN repertoire with heterogeneous odor selectivity, we simulated multiple ORN types by using different randomly generated affinity vectors, and by selecting a different set of values from the defined uniform distributions for the other parameters. We generated homogeneous ORN populations (see Fig. 5 A2) by uniformly applying the median rise time constant and adaptation values and by setting the response latency and fall time constants to fixed values (0 and 200 ms, respectively), and we set all receptor neurons to the persistent firing category. To create an ORN repertoire that had homogeneous amplitude (see Fig. 5 A3), we set the peak firing rate to 0.75 for all ORNs.
Figure 5.

PNs require input with heterogeneous time constants to generate realistic firing patterns. A, Model ORN firing patterns with heterogeneous time constants and heterogeneous response amplitudes (firing rates; A1) (see Materials and Methods); homogeneous time constants and heterogeneous response amplitudes (A2); and heterogeneous time constants and homogeneous response amplitudes (A3). Brown bars indicate odor pulses. B1, B3, When driven by temporally heterogeneous input from model ORNs (A1, A3), the model PNs (first trial shown as an intracellular current trace, following trials shown as rasters) exhibited a rich repertoire of lengthy and complex odor-evoked spatiotemporal patterns that qualitatively matched our recordings made in vivo (see Results). B2, When provided input from ORNs with homogeneous time constants, model PNs responded simply (A2). C, Histogram shows heterogeneous input caused PNs to generate more complex firing patterns (more response transitions; see Materials and Methods). These differences were statistically significant (see Results).
AL model.
The AL model consisted of 100 PNs and 30 local neurons (LNs). Each cell was modeled as a fast-spiking neuron using a computationally efficient map-based model (Rulkov et al., 2004). Our choice of neuronal model was not critical; we obtained comparable results using a different reduced Hodgkin-Huxley model (Izhikevich, 2003).
Each PN received multiglomerular inputs from 1 to 5% of ORN types. These convergence values are a little higher than approximations (one to three per glomeruli) obtained in the locust AL (Laurent, 1996; Farivar, 2005). Our simulations, though, showed that the model's properties were robust within a broad range of convergence values; odor separability in PN ensembles was consistent when up to 5% of ORN types converged on a glomerulus, but, as expected, separability success dropped gradually and monotonically as input from more types of ORNs were combined (supplemental Fig. S3, available at www.jneurosci.org as supplemental material).
Each LN received inputs from ∼70% of the ORNs [in the locust, LNs arborize extensively throughout the AL (Leitch and Laurent, 1996)]. Each PN also received fast GABAA-type (peak synaptic conductance g LN−PN,GABAA = 0.8 μS, synaptic time constant τLN−PN,GABAA = 6 ms, t × exp(−t/τLN−PN,GABAA) and slow GABAB-type (peak synaptic conductance g LN−PN,GABAB = 0.015 μS, synaptic time constant τLN−PN,GABAB = 150 ms, t × exp(−t/τLN−PN,GABAB)) inhibitory lateral inputs from 25% of the LNs (MacLeod and Laurent, 1996; Bazhenov et al., 2001b). A small amount of uniformly distributed noise ([0, 5%]) was introduced into each cell to create variability across trials. There were no excitatory lateral interactions between PNs; to date, none has been identified in locust. Each LN received excitatory input from 75% of the PNs (peak synaptic conductance g PN−LN,Cholinergic = 0.015 μS, synaptic time constant τPN−LN,Cholinergic = 5 ms, t × exp(−t/τPN−LN,Cholinergic)). Also, each LN received fast GABAA-type (peak synaptic conductance g LN−LN,GABAA = 0.4 μS, synaptic time constant τLN−PN,GABAA = 6 ms, t × exp(−t/τLN−PN,GABAA)) and slow GABAB-type (peak synaptic conductance g LN−LN,GABAB = 0.0075 μS, synaptic time constant τLN−LN,GABAB = 150 ms, t × exp(−t/τLN−PN,GABAB) inhibitory lateral inputs from 50% of the remaining LNs (Bazhenov et al., 2001a). No self-inhibition was included in the model. These connection probabilities and other network parameters including the type of synaptic currents were constrained by estimates made from locust AL circuits (Laurent, 1996; Leitch and Laurent, 1996; MacLeod and Laurent, 1996; Farivar, 2005).
Response motif analysis.
To analyze the PN response motifs induced by electrical or odor stimulation, we first binned the PN spikes into nonoverlapping 200 ms windows. To be considered stimulus evoked, responses had to meet two criteria applied to each time bin (Perez-Orive et al., 2002): (1) amplitude: the firing rate in each trial had to exceed 3 SDs of mean baseline activity; (2) reliability: the amplitude criterion had to be met in at least 5 of 10 trials. The number of response transitions (excitatory to no response, excitatory to inhibitory, inhibitory to no response, inhibitory to excitatory, no response to inhibitory, no response to excitatory) was counted in time bins starting from odor onset to 3 s after odor offset (20 time bins).
Trajectory analysis.
To generate odor-evoked response trajectories, we followed a procedure outlined previously (Stopfer et al., 2003; Brown et al., 2005). Briefly, for the trajectories calculated from our physiological records, odor-evoked responses of 53 ORNs (a subset of 46 ORNs was used to generate hexanol intensity trajectories in Fig. 2 B) were binned into 100 ms segments. Deviation from the baseline was computed as Euclidean distance from the mean baseline vector. Velocity of the trajectory was calculated as the magnitude of vector differences computed with ensemble ORN and PN firing rates in successive nonoverlapping 200 ms time bins. For trajectories calculated from the model, ORN responses and PN spike counts were binned into consecutive 50 ms segments independent of local field potential (LFP) cycle boundaries. For the purpose of visualization, the high-dimensional response vectors were subsequently projected onto the first three principal directions (eigenvectors of the response covariance matrix corresponding to largest eigenvalues) that accounted for maximum variance in the data (Duda et al., 2000).
Figure 2.

ORNs and PNs show similar response dynamics. A, Trajectories calculated from the odor responses of 53 ORNs over time (first 3 principal components; see Materials and Methods) revealed odor-specific patterns with a baseline, fast transient responses to odor onset, steady-state fixed-points activity, and off-transients that returned activity to baseline when the odor was removed. Numbers on trajectories indicate time (seconds) past odor onset. B, Trajectories calculated from the responses of 46 ORNs to hexanal (red) and three concentrations of hexanol (green) revealed odor-specific manifolds in which concentrations traced trajectories of varying lengths (monotonic with intensity). C, A long odor pulse (4 s, green) elicited fixed-points activity, but a brief pulse (1 s, purple) did not (50 ORNs). D, Trajectories calculated from the responses of 94 PNs evoked by the same set of odors used in A revealed dynamical properties similar to those of the ORNs. FP, Steady-state fixed-points activity; BL, baseline; PC, principal component.
Classification of odors based on responses of ORNs.
ORN spike counts were binned into consecutive 200 ms segments so that responses in each trial (3 s starting at odor onset) were represented by a 15-dimensional unit vector (Frobenius norm). Classification of a trial was correct if the Euclidean distance from that trial's response was less than the distance to means of responses elicited by other odors. For an analysis of instantaneous ensemble coding, spikes elicited by five odors in three ORNs were segmented into 50, 100, and 200 ms bins. The mean three-dimensional vector (one dimension from each ORN) of the five trials for each odor was used as the centroid for classification for the corresponding odor.
Correlation analysis.
Twelve odorants belonging to four different chemical classes were modeled in this study. Odorants that belonged to the same class had odor property vectors that were set to be more similar to each other than those belonging to different classes.
For the correlation analysis, ORN responses and PN spike counts were binned into consecutive 50 ms segments. Pairwise correlation coefficients between activity patterns were computed at different response times to quantify differences in responses to different odor pairs over time (Friedrich and Laurent, 2001).
To evaluate differences between odor representations in ORNs and in PNs over time, the similarity of the initial ORN and PN response correlation matrices (12 × 12 matrix) with those obtained at later response times was computed as second-order correlations. The analysis was repeated after removing either GABAA- or GABAB-type inhibitory currents or both GABAA- and GABAB-type inhibitory interactions.
Comparison of odor representation in ORN and PN coding space.
Fifty odorants were used to compare the odor representations in populations of ORNs and PNs. ORN responses and PN spike counts were binned into consecutive 50 ms segments. The high-dimensional response vectors in each time bin starting from 1 s before stimulus delivery to 3 s after odor onset (80 samples per odor, 50 odors, giving 4000 samples) were individually projected onto the first two principal directions that accounted for maximum variance in the data. To allow comparison of the intrinsic dimensionality of the ORN and AL coding space, eigenvalues of the ORN and PN response covariance matrices were divided by their sum and plotted in descending order.
LFP and sliding-window cross-correlograms.
The LFP in the model was computed as the sum of action potentials in PNs (filtered between 5 and 55 Hz). Spectrograms for each PN and LN with the LFP were computed in 200 ms sliding Hamming windows with 95% overlap and averaged (data not shown). The pairwise cross-correlations obtained for different PNs and LNs were then averaged.
Analysis of ORN convergence.
To systematically explore the relationship between the convergence of ORNs onto PNs and the separability of odor responses in the model, we simulated ORN responses to 50 odors and used different mixing matrices to homogeneously vary the number of ORN types that were integrated (1–25 ORN types) to generate AL input. Pairwise odor separability (1225 pairs, Euclidean distance measure) was computed for each convergence value and normalized by maximum distance to allow comparison. The means of the peak pairwise distances were then plotted as a function of the convergence values.
Results
Odorants, but not electrical pulses, evoke reliable, complex spatiotemporal patterns that outlast the stimulus
In the locust, ORNs distributed along the antenna send processes to the AL. There, responses of follower neurons arise through the interactions of the ORNs with two types of intrinsic neuron: the excitatory PNs (analogous to mitral/tufted cells) and the LNs, all of which in the locust appear to be inhibitory (analogous to granule and other inhibitory juxtaglomerular neurons) (supplemental Fig. S1a, available at www.jneurosci.org as supplemental material). Responses evoked by odors in PNs can consist of diverse, elaborate, and long-lasting temporal patterns that change with, and thus contain information about, the quality, the intensity, and the timing of odors (Laurent et al., 1996; Stopfer et al., 2003; Brown et al., 2005; Bathellier et al., 2008); some typical examples of multiphasic firing patterns elicited by different odorants in one PN are shown in supplemental Fig. S1b (available at www.jneurosci.org as supplemental material).
How are these complex firing patterns generated? In previous work to determine the aspects of spatiotemporal odor codes contributed by circuit interaction within the AL, Wehr and Laurent (1999) bypassed the ORNs completely, instead activating the AL directly by delivering electrical current pulses of varying profiles to the antennal nerve. Although some of the current pulse profiles used to artificially activate the AL had the effect of providing spatially and temporally varied input to the central circuitry, the response patterns of PNs elicited by electrical activation were neither as diverse nor as elaborate and lengthy as those evoked by pulses of odor.
Before beginning our own analysis, we repeated this experiment to quantitatively compare the response patterns evoked in PNs by simple square pulses of current with patterns evoked by odorants. Supplemental Fig. S1c (available at www.jneurosci.org as supplemental material) shows typical responses of PNs to electrical square pulses delivered to the antennal nerve (see Materials and Methods). Square-pulse stimulation of the AL, regardless of stimulus intensity or site of stimulation, evoked excitatory or inhibitory responses in PNs only during the stimulation period; these responses typically consisted of a single epoch of excitation or inhibition (35 PNs in seven experiments; 81 PN–electrical stimulus combinations). Odor-evoked responses in the same PNs, on the other hand, typically consisted of several alternating epochs of excitation and inhibition (see example in supplemental Fig. S1b, available at www.jneurosci.org as supplemental material). The response patterns elicited by odors were far more diverse and much lengthier than those elicited by electrical antennal nerve stimulation. Supplemental Fig. S1d (available at www.jneurosci.org as supplemental material) shows response motifs elicited in the same set of PNs by square pulses of electrical current and odor stimulation (see Materials and Methods). Overall, PNs responded with lengthy and elaborate patterns only when driven by odorants. In quantitative terms, the number of transitions between excitatory and inhibitory response motifs in PNs was much greater when responses were evoked by odors (supplemental Fig. S1e, available at www.jneurosci.org as supplemental material). Despite our best efforts to elicit complex responses from PNs by delivering pulses of current (see Materials and Methods), responses elicited by odors were more elaborate and enduring.
Our results confirmed the previous work (Wehr and Laurent, 1999) in that temporally simple input could evoke patterned responses in PNs. However, activation of the AL by simple square pulses of current never resulted in the complex, realistic responses that might be expected from a circuit capable of generating patterning on its own. Given that the previous results were supported, in part, by the assumption that ORNs respond to odorants with simple firing patterns, we considered that the realistic, complex patterning evoked by odors in the AL might depend critically on factors outside the AL, such as the temporal structure of odor-elicited activity in ORNs.
ORNs respond to odors with diverse temporal patterns
What are the characteristics of the antenna's output to the AL, and what roles does this activity play in establishing the spatiotemporal neural codes for odors observed in the output of the AL? To answer these questions, we first measured EAGs from isolated locust antennae; this measure provides an assay of the summed output of ORNs. Previous models of AL function were based on input similar to these EAG patterns (Bazhenov et al., 2001a). EAG responses evoked by different odorants all showed relatively similar and simple, nearly square, temporal profiles (supplemental Fig. S2a, available at www.jneurosci.org as supplemental material). However, since the EAG sums population activity, it obscures any possible diversity in odor-specific temporal structure contributed by individual receptor neurons. Thus, we next characterized the responses of the individual ORNs by making extracellular recordings from different types of sensilla on intact or cut antennae.
We examined the responses of 53 locust ORNs to many types and concentrations of odorants including monomolecular chemicals and complex, natural blends (see Materials and Methods). We used both brief (<1 s) and lengthy (4 s) pulses of odor so we could probe both dynamic and static properties of the ORNs. Brief and lengthy pulse durations both approximate natural situations: locusts in moving air distant from odor sources encounter intermittent and brief patches of odor; locusts close to odor sources encounter odors for longer durations.
We found that responses of the ORNs varied greatly in their tuning profiles and response kinetics. ORNs could respond to odorants with reliable spiking patterns that varied substantially in strength (firing rate) and time course (delay and duration). A single ORN could respond with different temporally structured firing patterns for different odors (Fig. 1 A), and a single odorant could evoke differently structured responses in different ORNs (Fig. 1 B). The timing of a given response's onset and offset depended on the ORN–odorant combination; an odorant could evoke a rapid, excitatory response in one ORN (e.g., ORNb8–hexanol) but produce a delayed response in another ORN (ORNb2–hexanol) (supplemental Fig. S2c, available at www.jneurosci.org as supplemental material, provides a view of this delay with an expanded time base). Not surprisingly, the probability of evoking a response in an ORN was related to the concentration of the stimulus; in a given ORN, high concentrations of an odorant could evoke responses, although lower concentrations did not [e.g., only the highest concentration of octanol (OCT100) evoked a response in ORN2a]. In some ORNs, odors could elicit responses that greatly outlasted the duration of the stimulus (ORN1a–hexanoic acid), as well as the duration of an EAG deflection (data not shown). Also, in many ORNs, odors could elicit lengthy inhibitory responses during which spiking fell well below the ORN's spontaneous firing rate (ORN1a–hexanol). Some ORNs responded to odors with simple but reliable sequences of inhibition and excitation (ORNb14). In many respects, these types of responses are evident in the ORNs of both insects and vertebrates (Sicard and Holley, 1984; Michel and Ache, 1994; Duchamp-Viret et al., 1999; Hallem and Carlson, 2006; Spors et al., 2006).
Figure 1.

ORNs responded to multiple odors with a variety of spatiotemporal patterns. A, Raster plots illustrate the responses of two ORNs to multiple odors (10 trials each, bottom to top, 20 s intertrial interval; brown bar, odor pulse; for odor list, see Materials and Methods). B, Raster plots illustrate the responses of 14 ORNs (recorded sequentially) to two odors. C, ORN firing patterns contain information about odors. Classification success over time calculated from amplitude-normalized responses of three sequentially recorded ORNs that responded to five odors demonstrates that, at every point during the odor response, temporal structures in the ensemble of ORNs contain information about odor identity. Performance improved as the duration of sample bins used for the analysis increased (see Materials and Methods).
To evaluate the information content of the temporal component of responses of ORNs to odors, we performed a simple classification analysis (see Materials and Methods) on a few ORNs in our set that responded to multiple odors and multiple concentrations of odors. Based on amplitude-normalized temporal pattern alone, ORN1a alone (Fig. 1 A) could be used to classify six odors correctly on 76% of trials; ORN2a (Fig. 1 A) could be used to classify five odors correctly on 74% of trials. Another ORN (supplemental Fig. S2b, available at www.jneurosci.org as supplemental material) could be used to classify three concentrations of octanol correctly on 80% of trials. Furthermore, instantaneous classification success far exceeded chance when ensembles of three ORNs that responded to all five odors in the stimulus set were analyzed together, with performance that improved as the duration of the sample bin used for the analysis increased (Fig. 1 C). Thus, ORNs could represent odors using both space (instantaneous ensemble responses) and time (firing patterns).
We found that the subset of actively spiking ORNs changed gradually and reliably over the time course of a lengthy odor stimulus. At the onset of a lengthy (>1 s) odor pulse, a group of rapidly and transiently firing ORNs (e.g., ORN6b–hexanal) and a separate group of more slowly and tonically firing ORNs (e.g., ORN9b–hexanal) both contributed to the odor response. But within 1 s of the odor's onset, the transiently active group of ORNs ceased firing, leaving only the stable excitatory or inhibitory responses of the subset of tonically spiking ORNs. Consistent with this observation, a trajectory analysis (Stopfer et al., 2003; Mazor and Laurent, 2005) examining the representation of lengthy 4 s odor pulses by groups of ORNs over time revealed reliable three-stage population dynamics [n = 53 (Fig. 2 a) and n = 48 (Fig. 2 b)]. These stages consisted of (1) a rapid, transient, odor identity- and intensity-specific response that then (2) settled within ∼1500 ms into the steady-state activity characterized as a “fixed point” (Mazor and Laurent, 2005) and then, (3) upon odor offset, a second burst of transient activity, leading to the response's gradual return to baseline. Brief 1 s odor pulses elicited responses in ORNs that traced response trajectories similar to those evoked by longer odor pulses, showing these response trajectories are reliable. However, brief pulses did not evoke fixed points (Fig. 2 C) (n = 50).
Like odor responses in ensembles of PNs (Fig. 2 D) (n = 94), odor responses in ORNs consisted of spatiotemporal patterns of spiking. What roles might these complex peripheral responses play in establishing neural codes for odors in the AL?
Odor coding by populations of ORNs
To allow us to systematically and comprehensively explore how response features we had observed in our recordings from ORNs could influence responses in the AL, we constructed a two-part computational model consisting of ORNs and AL circuitry. The model's first part was a simple parametric simulation of the ORN population (n = 1000 ORNs; see Materials and Methods). In this simulation, responses (firing rates) evoked in an ORN by a given odorant were characterized by five parameters (as shown in Fig. 3 A): latency; rise time; fall time; peak amplitude; and rate of adaptation. Based on our recordings from locust ORNs, we modeled two categories of ORN response (with equal probability): those that phasically terminate quickly after a strong initial response [e.g., ORNb6 (Fig. 1 B)] and those with persistent, tonic responses [e.g., ORNb9 (Fig. 1 B)]. To simulate an ORN's sensitivity to more than one type of odorant, we defined each odorant as an “n”-dimensional vector (Raman et al., 2006) of abstract molecular features (to represent characteristics such as carbon chain length, functional group, and charge distribution), and we defined the chemical selectivity or affinity of an ORN as a similar vector of features. The response of an ORN to a given odorant was determined by the similarity of the ORN's selectivity vector and the odorant's feature vector (see Materials and Methods). In our model, tuning width was uniformly and randomly distributed from sharp to broad. Guided by results obtained in Drosophila (Hallem and Carlson, 2006), model ORNs converging onto the same glomerulus had similar response profiles, affinities, noise levels, and time constants (although a strict convergence ratio was not critical for the model's function) (supplemental Fig. S3, available at www.jneurosci.org as supplemental material). Our model of peripheral responses to odors was not intended to realistically reflect mechanisms underlying the function of ORNs, but rather to allow us to systematically explore the significance of firing pattern heterogeneity and other characteristics of the ORNs' responses to odors.
We tightly constrained our receptor model parameters in two ways to generate ORN responses like those we observed in our electrophysiological recordings. First, the model's summed ORN population responses had to match EAG responses we recorded in vivo from locust antennae (Fig. 3 B); second, all response parameters were set such that odor responses of individual model ORNs had to qualitatively match responses we recorded in vivo from locust ORNs (Fig. 3 C). Increasing concentrations of an odor recruited increasing numbers of receptor types, and different odors elicited responses in different but overlapping sets of receptor types, as we and others have observed in vivo (Malnic et al., 1999; Hallem and Carlson, 2006).
Because responses of individual model ORNs varied in their temporal structure, the population of receptor neurons driven to spike by a given odor was not constant but varied during the course of odor presentations. Trajectory representations of the model ORN population responses (Fig. 3 D,E) (see Materials and Methods) showed that, in several respects, the ensemble responses of model ORNs resembled the ensemble responses of real ORNs and PNs (Fig. 2). When stimulated by brief odor pulses, model ORN responses traced closed paths away from, and then back to, the origin (the point signifying spontaneous activity). Model ORN responses formed manifolds for odor identity that encompassed trajectories for odor intensity (Fig. 3 D). Furthermore, when stimulated by lengthy odor pulses (>1 s), model ORN response trajectories settled into fixed points (Fig. 3 E). These results show that our model successfully mimicked the dynamical properties of the ORNs we had recorded in vivo and provide additional evidence that the odor response dynamics well characterized in the AL already exist in the ORNs.
Odor coding in the AL
To examine how the spatiotemporal output of the ORNs is subsequently processed, we prepared the second part of our computational model: a simulation of the AL network, consisting of PNs and LNs, and constrained by published descriptions of locust neural circuitry (Fig. 4 A) (see Materials and Methods) (Laurent, 1996; Leitch and Laurent, 1996; MacLeod and Laurent, 1996; Bazhenov et al., 2001a; Farivar, 2005). We used the output of our simulation of the population of ORNs as the input to our model of the AL. We found that, as a population, the model PN responses changed with both the identity and intensity of the odor stimulus (Stopfer et al., 2003). A trajectory analysis of our model's PN ensemble responses revealed fixed points elicited only by long odor pulses (Fig. 4 B) (Mazor and Laurent, 2005) and revealed concentration-specific trajectories traced on odor-specific manifolds (Fig. 4 C) (Stopfer et al., 2003). These results match those we had obtained in vivo (Fig. 2).
Figure 4.

Odor coding in a model AL. A, The AL network model. A population of 1000 ORNs (10 each of 100 different receptor types) provided temporally heterogeneous input to a model AL in which ORNs of the same type converged to the same glomerulus (although precise convergence, not known to exist in the locust, was unnecessary; see Materials and Methods and supplemental Fig. S3, available at www.jneurosci.org as supplemental material). The AL network comprised 100 excitatory PNs and 30 GABAergic LNs. B, A trajectory analysis (first 3 principal components) of model PN ensemble activity revealed transient dynamics elicited by brief odor pulses (500 ms, 1 s) and fixed points elicited by a long odor pulse (4 s), matching results obtained in vivo (see Fig. 2 C) (Mazor and Laurent, 2005) and similar to responses of model ORNs (see Fig. 3 E). C, Model PN response patterns formed manifolds for odor identity with subtrajectories for odor intensity, as in vivo (Stopfer et al., 2003) and similar to responses of model ORNs (see Fig. 3 D). FP, Fixed points; BL, baseline; PC, principal component.
We used our combined ORN–AL model to evaluate the properties of input to the AL needed to generate realistic firing patterns in groups of PNs. Given temporally heterogeneous output from ORNs (Fig. 5 A1), our model PNs individually displayed a rich repertoire of complex spatiotemporal firing patterns that often included multiple transitions between periods of excitation and inhibition (Fig. 5 B1). We found the diversity of PN patterns was significantly reduced (Fig. 5 B2) (Sign test, p < 0.0001) when we provided temporally homogenous input to the AL (Fig. 5 A2) (see Materials and Methods). When we provided temporally heterogeneous input with homogenous amplitudes (Fig. 5 A3), we could generate firing patterns in PNs no different (Fig. 5 B3) (Sign test, p = 0.3222) from those elicited by the full diversity of ORN responses. Thus, heterogeneity in the response time constants of ORNs rather than heterogeneity in response amplitude was the key requirement for generating complex firing patterns in PNs. Figure 5 C shows that the firing patterns of individual model PNs showed realistic complexity (quantified as the number of transitions between periods of excitation and inhibition; see Materials and Methods) only when they were driven by temporally heterogeneous input from ORNs.
The spatiotemporal structures generated by our combined ORN–AL model were reliable, repeatable, and substantially more complex, enduring, and realistic than those arising from previous models based on simple, homogenous ORN activity (Bazhenov et al., 2001a,b). Given the realistic temporally heterogeneous output of our simulated ORN set, our model of the AL successfully mimicked the odor response properties of the PN ensemble.
AL patterning requires temporally heterogeneous input from ORNs
The results of our computational model (Fig. 5) led us to predict that the AL cannot generate realistic, temporally structured output in PNs unless it receives temporally heterogeneous input from ORNs. To test this prediction in vivo, we made use of our finding that brief odor pulses elicit only heterogeneous ORN activity, but that long odor pulses elicit homogenous ORN activity during the fixed points (Fig. 2). By varying the durations of odor pulses, we could manipulate the temporal structure of the input to the AL, allowing a controlled shift from heterogeneous to homogenous response kinetics.
Figure 6 A shows the mean rate of change (velocity; see Materials and Methods) of the ORN ensemble response elicited by brief odor pulses (1 s; individual velocity traces for different odors are shown in supplemental Fig. S4, available at www.jneurosci.org as supplemental material). Brief odor pulses activated the population of ORNs in a temporally heterogeneous manner: the response consisted entirely of rapidly shifting on- and off-transients. Throughout the odor's duration, ORN patterning velocity greatly exceeded the baseline level. Long odor pulses, however, evoked both heterogeneous and homogenous responses. Figure 6 B shows the mean velocity of the ORN ensemble response to long odor pulses (4 s). ORN patterning velocity was high during the on- and off-transients (within 1 s of odor delivery and removal) but settled down to the baseline level during the fixed point.
Figure 6.

In vivo, odor response patterning in the AL requires temporally heterogeneous input from ORNs. A, Mean rate of change (velocity, arbitrary units) of ORN ensemble activity (50 cells from 13 animals) during the response to a short odor pulse (brown bar, 1 s). Response velocity exceeded baseline levels throughout the response. B, Mean ORN response velocity during exposure to a long odor pulse (4 s). During the fixed points (yellow area), response velocity dropped to baseline level. C, Mean rate of change of PN ensemble activity (94 cells from 9 animals) during the response duration for a short odor pulse (1 s). Response velocity exceeded baseline levels throughout the response. D, Mean PN response velocity during exposure to a long odor pulse (4 s). During the fixed points (yellow area), when the ORNs provide temporally homogenous output, response velocity in the PN ensemble dropped to baseline level; confirming results of our model, given temporally simple input, the AL does not generate temporally structured responses on its own.
If the AL can generate temporally structured patterns on its own, then the PN ensemble response should display rapidly shifting patterning when the AL is given either temporally heterogeneous or temporally homogenous input. In quantitative terms, the velocity of the PN ensemble response should remain high throughout both transient and fixed points of ORN activity. Our recordings from PNs revealed high-trajectory velocities when the ORNs provided heterogeneous input (Fig. 6 C; individual odor velocity traces are shown in supplemental Fig. S4, available at www.jneurosci.org as supplemental material). However, when the output of the ORNs shifted to the homogenous state, PN trajectory velocity dropped to the baseline level (Fig. 6 D). Thus, confirming our model's prediction (Fig. 5), the AL does not generate temporally structured response patterns except when provided temporally heterogeneous input from ORNs.
Olfactory information processing by AL circuits
Our physiological and computational results revealed that many features of odor codes (spatiotemporal patterns, details of response dynamics, partitioning of odor identity and intensity) are driven directly by ORNs. What then are the contributions of the AL circuits to odor coding?
In locusts and other insects, odors have been shown to elicit the oscillatory synchronization of AL neurons (Laurent and Davidowitz, 1994; Ito et al., 2009; Tanaka et al., 2009). In a few species (Dorries and Kauer, 2000; Ito et al., 2006), odors can elicit the oscillatory synchronization of ORNs. However, we never observed oscillatory synchronization among the ORNs we recorded in vivo from locusts; this characteristic of the AL's response to odors arises entirely within the circuitry of the AL. Our model of the AL mimicked the odor-elicited, ∼20 Hz oscillations observed in the locust (Fig. 7 A). An analysis of subthreshold activity in model PNs and LNs cross-correlated with the LFP revealed transient synchronization that was cell and odor specific (data not shown) as observed in vivo (Laurent and Davidowitz, 1994). Figure 7 B shows these transient oscillations in sliding-window cross-correlation diagrams obtained by averaging across all of the model's PNs (left) and LNs (right). The interval between the peaks is ∼50 ms, corresponding to ∼20 Hz oscillations, as observed in vivo. Consistent with previous physiological and computational results (MacLeod and Laurent, 1996; Bazhenov et al., 2001b), our model demonstrated that GABAA-type inhibitory currents originating from LNs within the AL underlie these odor-evoked oscillations (supplemental Fig. S5, available at www.jneurosci.org as supplemental material).
Figure 7.
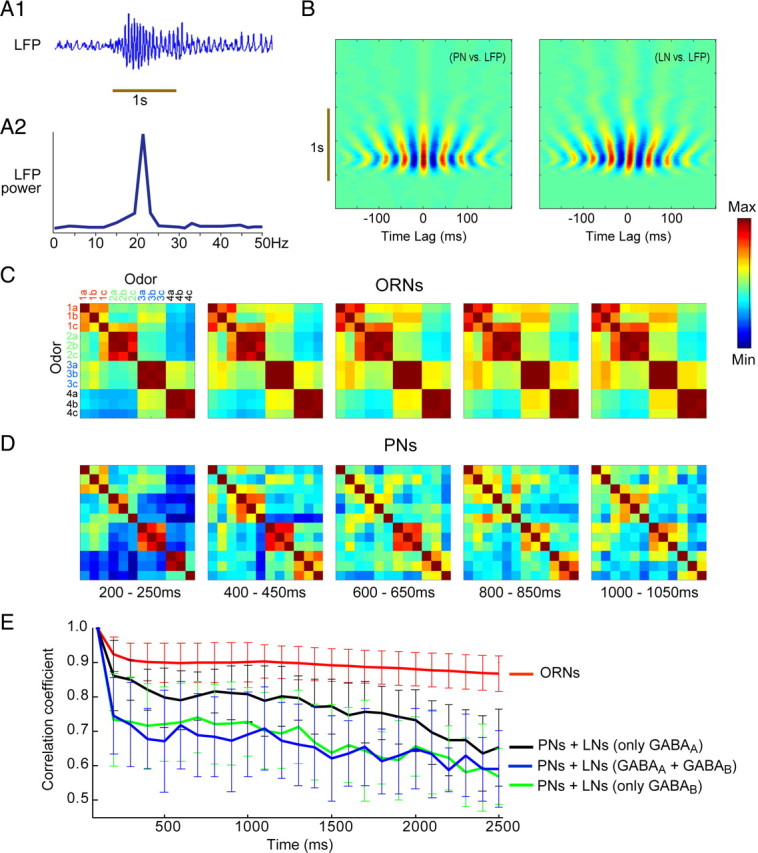
The AL contributes in several ways to odor processing. A1, Our ORN–AL model generated odor-evoked oscillatory synchronization. The LFP oscillations (sum of PN spiking) were similar to those observed in vivo. A2, LFP power spectrum showed ∼20 Hz oscillations, as in vivo. B, Cross-correlograms of subthreshold activity shows PNs and LNs transiently phase locked to the LFP; red and blue banding patterns indicate, respectively, the peaks and troughs of the cross-correlation. C, The AL network (but not ORNs) decorrelated responses to different odorants over time. Pairwise similarity of ORN activity patterns to 12 different odorants belonging to four chemical classes (color coded in the first panel) over time (each matrix shows a 50ms time bin) is shown. Each pixel in the 12 × 12 matrix shows the correlation coefficient between ORN response patterns evoked by two odors. The responses evoked within a chemical class remain correlated over the course of the response, evident as persistent dark red blocks along the diagonal. D, Similar analysis for PN activity patterns; responses of PNs decorrelated over time, evident as the blocks along the diagonal dissolve over the response. E, Decorrelation is evident in PNs but not ORNs, because of interactions of PNs with LNs. Plots show, over time, for ORNs and PNs, the overall correlation of activity with initial representations (200–250 ms). Five conditions were tested: ORNs; PNs with intact input from LNs (GABAA and GABAB); PNs with only GABAA or only GABAB; and PNs with no input from LNs (data not shown). GABAergic input was required for responses in PNs to decorrelate. Error bars indicate variability over simulation runs (n = 10 different AL models).
We next used our model to explore changes in odor-evoked response patterns over time in the populations of ORNs and PNs (Friedrich and Laurent, 2001). Figure 7, C and D, shows pairwise correlations of ORN and PN activity patterns evoked by 12 odors from four odor classes (see Materials and Methods) at five points in time after odor delivery. Each pixel in the 12 × 12 matrix indicates the correlation between two odor-evoked responses in the model's ORN population or PN population; diagonals represent self-correlations. Matrices calculated from the responses of ORNs (Fig. 7 C) show that responses evoked by odors of the same type remained highly correlated with each other (large red blocks distributed around the diagonal) throughout the odor response. In contrast, matrices calculated from the responses of PNs (Fig. 7 D) show these odor-type blocks dissolved over the course of the response.
These results indicate that, in the population of ORNs (Fig. 7 C), responses to odorants with similar structures remained correlated with each other throughout the duration of the stimulus. Across the PN ensemble (Fig. 7 D), however, responses began like those of ORNs but became progressively more different (decorrelated) from one another (Friedrich and Laurent, 2001). Figure 7 E quantifies the change in odor relationships over time in both ORNs and PNs: decorrelation over time occurred only within the AL (two-way ANOVA: F (1,550) = 984.56; p < 0.001). Removing GABAA-type inhibitory current alone did not significantly disrupt the decorrelation process (two-way ANOVA: F (1,550) = 2.4; p = 0.1217). In contrast, removing GABAB-type conductances alone produced results that were significantly different from models with and without both inhibitory currents (two-way ANOVA: for comparison with AL model having no inhibitory conductances, F (1,550) = 61.22, p < 0.001; for comparison with AL model having both GABAA and GABAB inhibition, F (1,550) = 157.35, p < 0.001). These results suggest that the GABAergic inhibition from LNs within the AL could restructure odor-elicited input from ORNs over time, thus magnifying differences among responses of PNs to different odors (Friedrich and Laurent, 2001).
This decorrelation of odor representation appeared to enable the AL to redistribute odor representations. Such a mechanism could allow the AL to make better use of its coding space. We tested this possibility in our model using a large set of 50 odorants. Applying standard techniques (see Materials and Methods) (Stopfer et al., 2003; Brown et al., 2005), we calculated trajectories (50 ms time bins) elicited by these odorants from the firing patterns of our model population of ORNs and PNs over the course of 4 s beginning with the onset of a 1s odor pulse. Figure 8 A shows the first two principal components of ensemble patterns in ORNs (left) and PNs (right) elicited by the odor set (each odor response shown as a different color). The PN patterns (Fig. 8 A, right) were more evenly distributed in coding space than those of ORNs (Fig. 8 A, left); two dimensions were adequate to differentiate the responses of the ORN ensemble to different odors, but additional dimensions would be needed to fully differentiate the responses of the PN ensemble. We also compared the intrinsic dimensionality of odor representations with and without the contributions of LNs by examining the distribution of variance among eigenvectors characterizing the odor representations (Fig. 8 B) (see Materials and Methods); the contributions of LNs shifted the elbow of this “scree plot” (Joliffe, 1986) toward the right, indicating that lateral interactions provided by LNs transformed the input received from ORNs into a higher-dimensional representation within the PN population. These results suggest the AL reformatted the information contained in the temporal dynamics of the ORN population into more distributed patterns within the PN population through GABAergic inhibition from LNs.
Figure 8.

Odor representations in our model were more uniformly distributed in PNs than in ORNs. A, ORN (left) and PN (right) response trajectories [first 2 principal components (PC)] elicited by 50 different odors (5 odor classes) over time (see Materials and Methods). Each color-coded circle represents an ORN (left) or PN (right) response pattern evoked by an odor in a 50 ms time bin; circles are joined in sequence by solid lines. Odor representations are more uniformly distributed in the PN coding space, and more than two dimensions are needed to separate responses in PNs. B, GABAergic inhibition within the AL helps transform its input from ORNs to a higher-dimensional space. The amount of variance captured by different eigenvectors (sorted by their eigenvalues) is shown for a model AL network without (red) and with (blue) GABAergic inhibition from LNs. Local interactions within the AL distributed the information evenly across more eigen directions. C, AL processing provides for rapid odor discrimination. Pairwise distance between representation of 50 different odors (1225 randomly selected pairs) rises faster in PNs (purple) than in ORNs (green). Thick lines, Median; thin lines, first and third quartiles. The brown bar indicates odor presentation.
With our combined ORN and AL model, we also compared the separability of responses to 50 different odors (1225 randomly chosen pairs) over time (Fig. 8 C). We used the same odor set shown in Figure 8, A and B, for this analysis. Consistent with reports from Drosophila (Bhandawat et al., 2007), we noted a trend for peak odor separation to occur faster in the PN ensemble than in the ORNs. This result suggests a role for the AL circuits in encoding odors rapidly.
In summary, our combined ORN–PN model demonstrated that many properties of odor codes originate within ORNs but that the AL then reformats these codes in a number of specific ways.
Discussion
Olfactory systems use both space and time to encode stimuli (Laurent, 1999): pulses of odor evoke complex, reliable, temporally structured response patterns distributed across ensembles of PNs in the AL (Wehr and Laurent, 1999; Laurent, 2002) [and of mitral cells in the OB (Friedrich and Laurent, 2001)]. In the insect, the spatiotemporal activity patterns of the PN ensemble constitute the only olfactory representations transmitted to deeper neural structures including the mushroom body and the lateral horn (Laurent, 2002). Where and how are these temporally structured neural representations for odors generated?
Origins of slow temporal patterning in the AL
The EAG, which provides an assay of the summed output of ORNs, resembles a simple square pulse of activity when driven by a square pulse of odor (supplemental Fig. S2A, available at www.jneurosci.org as supplemental material). Until recently, the EAG was often regarded as a representative reflection of the temporal response characteristics of individual ORNs. Thus, the complex, spatiotemporal odor representations observed in the PN ensemble were proposed to arise entirely within the circuitry of the AL when activated by simply structured input from the ORNs (Wehr and Laurent, 1999). Consistent with previous work (Wehr and Laurent, 1999), we found we were able to elicit relatively simple activity patterns in the AL by stimulating the antenna nerve with square pulses of electrical current. However, these response patterns were neither as complex nor as enduring as those elicited by odor presentations (supplemental Fig. S1b–e, available at www.jneurosci.org as supplemental material). Previous computational models of the AL that were driven by input resembling the EAG also generated odor responses that were brief and simple versions of those routinely observed in vivo (Bazhenov et al., 2001a,b). A previous phenomenological investigation (Geffen et al., 2009) had shown that the temporally structured response patterns of ORNs and PNs, grouped together as a single dynamical system, could be approximated by a set of filters. We considered the roles of the ORNs and PNs separately, testing the idea that interactions within the AL may not, on its own, generate the spatiotemporally structured response patterns elicited by odors. We wondered whether these patterns might originate, in part, earlier in the olfactory pathway, within the ORNs.
Our recordings from locust antennae revealed that ORNs are themselves capable of generating odor-elicited firing patterns with temporal properties that vary with, and thus contain information about, the identity, concentration, and duration of the odor (Figs. 1 C, 2 A–C; supplemental Fig. S2b, available at www.jneurosci.org as supplemental material). Variable temporal response properties included latency to spike, onset and offset dynamics, response duration, peak firing rates, and simple combinations of excitation and inhibition. These results are generally consistent with observations from both mammalian (Spors et al., 2006) and invertebrate olfactory systems (Michel and Ache, 1994; Hallem and Carlson, 2006).
Extending these efforts, we also characterized the response properties of the ORNs to lengthy odor stimuli. We found that ORNs could exhibit simple excitatory and inhibitory responses, as well as persistent tonic responses, and phasic responses that terminated quickly after a strong initial response (Fig. 1). Overall, we found that the ORNs of locusts respond to odors in very diverse ways.
Furthermore, we found that the responses to odors we recorded in groups of ORNs, although less elaborately structured, shared many fundamental properties earlier characterized in groups of PNs (Fig. 2 D). A trajectory analysis of ORN response patterns (Fig. 2 B,C), for example, revealed ORN population response dynamics could be characterized as odor concentration trajectories upon odor identity manifolds. Furthermore, the odor onset, fixed point, and offset dynamics matched those characterized in groups of PNs. Thus, decoupling of odor identity from intensity and the transient and fixed-point dynamical properties of the PN ensemble appear to arise entirely within the ORNs.
Given the well structured output of the ORNs, what additional specific odor-encoding roles are performed by the AL? To answer this question, we developed a combined computational model (Fig. 4 A) to link the newly revealed response properties of ORNs to a realistic simulation of the AL. We simulated a large set of ORNs with realistic firing patterns (Fig. 3 A–C) that were well constrained by individual and population odor response properties we had characterized in vivo (Figs. 1, 2). Odor-elicited dynamical properties of the model's ORN population closely matched those observed in vivo (Fig. 3 D,E). Given the output of our model ORNs, the model PN ensemble displayed many of the response characteristics observed in vivo, including complex dynamical properties (Fig. 4 B) and the ability to separate responses to different odors and concentrations of odors (Fig. 4c). Consistent with this, a previous computational model of the vertebrate olfactory system found that varying the latencies and amplitudes of inputs could modulate the system's behavior and also discrimination time for odors (Kunsting and Spors, 2009).
Diversity of ORN response time constants underlies AL spatiotemporal patterns
Given the full diversity of ORN activity we had observed in vivo (Fig. 5 A1), individual model PNs generated responses that resembled those recorded in vivo (Fig. 5 B1). In our model AL network, brief, homogeneous inputs failed to elicit enduring, complex activity patterns (Fig. 5 B2). We found that heterogeneity in the ORNs' response time constants (Fig. 5 B3), rather than heterogeneity in firing rate (Fig. 5 B2), was essential for generating complex patterns in the AL. Relative differences in firing rates over time in different, simultaneously active ORNs, even when held to a constant amplitude (Fig. 5 A3), enabled diverse and shifting competitive interactions (mediated by the GABAergic LNs) in the AL, thereby creating complex response patterns for encoding odors in PNs. These results did not depend on the scale of the model (see Materials and Methods). Thus, our model predicted that the AL could not generate realistic output in the absence of temporally heterogeneous input from ORNs.
We tested this prediction in vivo by varying the duration of odor pulses to elicit responses from ORNs that were temporally heterogeneous or temporally homogenous. When driven by temporally heterogeneous responses from ORNs (Fig. 6 A), PNs responded with rapidly shifting, complex temporal patterns (Fig. 6 C). However, when driven by temporally homogenous responses from ORNs (Fig. 6 B, yellow portion), PNs settled into stable firing states indistinguishable from baseline (Fig. 6 D, yellow portion). Together, these results show that temporally heterogeneous input from ORNs is required to drive complex patterning in the AL.
GABAergic local neurons in the AL restructure input received from ORNs
Our combined model showed that information contained within the temporal dynamics of the responses of ORNs could be transformed into patterns of increasing temporal and spatial complexity within the AL through GABAergic inhibition from LNs. Specifically, fast GABAergic inhibition caused oscillatory synchronization of PNs within the AL (Fig. 7 A,B). Responses to different odorants measured across the PN ensemble decorrelated over time, but no such decorrelation occurred within the ORN population (Fig. 7 C,D) or in PNs when LNs had been removed from our model (Fig. 7 E). Thus, response decorrelation was achieved by the AL.
Our model showed that the AL expanded the coding space available for odor representations (Fig. 8 A,B). Notably, our model showed that, during an odor response's onset transient, the peak of odor discriminability in the PN ensemble occurred before the peak of odor discriminability in the ORNs (Fig. 8 C), consistent with results obtained in Drosophila (Bhandawat et al., 2007). Our model shows this occurred because the AL's inhibitory network quickly limited PN firing rates in a way ORNs were not limited, and in the absence of nonlinear amplification between ORNs and PNs (Bhandawat et al., 2007), a feature not built into our model.
Our work provides the first systematic analysis of the responses of ORNs to odors in the locust. Our electrophysiological recordings showed that odor responses in ORNs consist of diverse and sometimes enduring spatiotemporal patterns of activity. Our computational model showed that temporal diversity in the responses of ORNs is critical for generating the odor-specific patterning observed in vivo in ensembles of PNs, establishing that a combination of spatiotemporally structured inputs from ORNs and well understood simple circuit mechanisms within the AL can explain the origins of temporal codes for odors. We also showed that the population response dynamics (onset, fixed point, offset) observed in the PN ensemble directly follow from the time-varying responses of the ORN ensemble. Given temporally heterogeneous structured input from ORNs, the AL performs a number of additional spatiotemporal transformations to process olfactory information. Thus, the role of the AL in olfactory coding is to begin to extract information from the ORN responses and to reformat this information into a synchronized and decorrelated structure appropriate for further processing downstream. Because of the remarkable structural and functional parallels between insect and vertebrate olfactory systems (Kay and Stopfer, 2006), it seems likely similar mechanisms will be found to operate across diverse species. It will now be of great interest to determine how ORNs generate diverse temporal responses to odors (Grosmaitre et al., 2006).
Footnotes
This work was supported by a Joint National Institutes of Health (NIH), National Institute of Biomedical Imaging and Bioengineering–National Institute of Standards and Technology postdoctoral Fellowship Award from the National Research Council (B.R.) and by an intramural grant from NIH–National Institute of Child Health and Human Development (M.S.). We thank members of the Stopfer laboratory for helpful discussions and Maxim Bazhenov for providing an implementation of a map-based model for neurons. We also thank Kui Sun for excellent animal care.
References
- Bathellier B, Buhl DL, Accolla R, Carleton A. Dynamic ensemble coding in the mammalian olfactory bulb: sensory information at different timescales. Neuron. 2008;57:586–598. doi: 10.1016/j.neuron.2008.02.011. [DOI] [PubMed] [Google Scholar]
- Bazhenov M, Stopfer M, Rabinovich M, Abarbanel HDI, Sejnowski TJ, Laurent G. Model of cellular and network mechanisms for odor-evoked temporal patterning in the locust antennal lobe. Neuron. 2001a;30:569–581. doi: 10.1016/s0896-6273(01)00286-0. [DOI] [PMC free article] [PubMed] [Google Scholar]
- Bazhenov M, Stopfer M, Rabinovich M, Huerta R, Abarbanel HDI, Sejnowski TJ, Laurent G. Model of transient oscillatory synchronization in the locust antennal lobe. Neuron. 2001b;30:553–567. doi: 10.1016/s0896-6273(01)00284-7. [DOI] [PMC free article] [PubMed] [Google Scholar]
- Bhandawat V, Olsen SR, Gouwens NW, Schlief ML, Wilson RI. Sensory processing in the Drosophila antennal lobe increases reliability and separability of ensemble odor representations. Nat Neurosci. 2007;10:1474–1482. doi: 10.1038/nn1976. [DOI] [PMC free article] [PubMed] [Google Scholar]
- Brown SL, Joseph J, Stopfer M. Encoding a temporally structured stimulus with a temporally structured neural representation. Nat Neurosci. 2005;8:1568–1576. doi: 10.1038/nn1559. [DOI] [PubMed] [Google Scholar]
- Dorries KM, Kauer JS. Relationships between odor-elicited oscillations in the salamander olfactory epithelium and olfactory bulb. J Neurophysiol. 2000;83:754–765. doi: 10.1152/jn.2000.83.2.754. [DOI] [PubMed] [Google Scholar]
- Duchamp-Viret P, Chaput MA, Duchamp A. Odor response properties of rat olfactory receptor neurons. Science. 1999;284:2171–2174. doi: 10.1126/science.284.5423.2171. [DOI] [PubMed] [Google Scholar]
- Duda RO, Hart PE, Stork DG. Pattern classification. New York: Wiley; 2000. [Google Scholar]
- Farivar SS. Cytoarchitecture of the locust olfactory system. California Institute of Technology; 2005. PhD thesis. [Google Scholar]
- Friedrich R, Laurent G. Dynamic optimization of odor representations by slow temporal patterning of mitral cell activity. Science. 2001;291:889–894. doi: 10.1126/science.291.5505.889. [DOI] [PubMed] [Google Scholar]
- Geffen MN, Broome BM, Laurent G, Meister M. Neural encoding of rapidly fluctuating odors. Neuron. 2009;61:570–586. doi: 10.1016/j.neuron.2009.01.021. [DOI] [PubMed] [Google Scholar]
- Giraudet P, Berthommier F, Chaput M. Mitral cell temporal response patterns evoked by odor mixtures in the rat olfactory bulb. J Neurophysiol. 2002;88:829–838. doi: 10.1152/jn.2002.88.2.829. [DOI] [PubMed] [Google Scholar]
- Grosmaitre X, Vassalli A, Mombaerts P, Shepherd GM, Ma M. Odorant responses of olfactory sensory neurons expressin the odorant receptor MOR23: a patch clamp analysis in gene-targeted mice. Proc Natl Acad Sci U S A. 2006;103:1970–1975. doi: 10.1073/pnas.0508491103. [DOI] [PMC free article] [PubMed] [Google Scholar]
- Hallem EA, Carlson JR. Coding of odors by a receptor repertoire. Cell. 2006;125:143–160. doi: 10.1016/j.cell.2006.01.050. [DOI] [PubMed] [Google Scholar]
- Ito I, Watanabe S, Kirino Y. Air movement evokes electro-olfactogram oscillations in the olfactory epithelium and modulates olfactory processing in a slug. J Neurophysiol. 2006;96:1939–1948. doi: 10.1152/jn.00323.2006. [DOI] [PubMed] [Google Scholar]
- Ito I, Bazhenov M, Ong RC, Baranidharan R, Stopfer M. Frequency transitions in odor-evoked neuron oscillations. Neuron. 2009;64:692–706. doi: 10.1016/j.neuron.2009.10.004. [DOI] [PMC free article] [PubMed] [Google Scholar]
- Izhikevich EM. Simple model of spiking neurons. IEEE Trans Neural Netw. 2003;14:1569–1572. doi: 10.1109/TNN.2003.820440. [DOI] [PubMed] [Google Scholar]
- Joliffe IT. Principal component analysis. New York: Springer; 1986. [Google Scholar]
- Kay LM, Stopfer M. Information processing in the olfactory systems of insects and vertebrates. Semin Cell Dev Biol. 2006;17:433–442. doi: 10.1016/j.semcdb.2006.04.012. [DOI] [PubMed] [Google Scholar]
- Kunsting T, Spors H. Dynamics of input patterns modulate the behavior of a model of olfactory bulb function. J Neurophysiol. 2009;102:100–109. doi: 10.1152/jn.90699.2008. [DOI] [PubMed] [Google Scholar]
- Laurent G. Dynamical representation of odors by oscillating and evolving neural assemblies. Trends Neurosci. 1996;19:489–496. doi: 10.1016/S0166-2236(96)10054-0. [DOI] [PubMed] [Google Scholar]
- Laurent G. A systems perspective on early olfactory coding. Science. 1999;286:723–728. doi: 10.1126/science.286.5440.723. [DOI] [PubMed] [Google Scholar]
- Laurent G. Olfactory network dynamics and the coding of multidimensional signals. Nat Rev Neurosci. 2002;3:884–895. doi: 10.1038/nrn964. [DOI] [PubMed] [Google Scholar]
- Laurent G, Davidowitz H. Encoding of olfactory information with oscillating neural assemblies. Science. 1994;265:1872–1875. doi: 10.1126/science.265.5180.1872. [DOI] [PubMed] [Google Scholar]
- Laurent G, Wehr M, Davidowitz H. Temporal representations of odors in an olfactory network. J Neurosci. 1996;16:3837–3847. doi: 10.1523/JNEUROSCI.16-12-03837.1996. [DOI] [PMC free article] [PubMed] [Google Scholar]
- Leitch B, Laurent G. GABAergic synapses in the antennal lobe and mushroom body of the locust olfactory system. J Comp Neurol. 1996;372:487–514. doi: 10.1002/(SICI)1096-9861(19960902)372:4<487::AID-CNE1>3.0.CO;2-0. [DOI] [PubMed] [Google Scholar]
- MacLeod K, Laurent G. Distinct mechanism for synchronization and temporal patterning of odor-encoding neural assemblies. Science. 1996;274:976–979. doi: 10.1126/science.274.5289.976. [DOI] [PubMed] [Google Scholar]
- Malnic B, Hirono J, Sato T, Buck LB. Combinatorial receptor codes for odors. Cell. 1999;96:713–723. doi: 10.1016/s0092-8674(00)80581-4. [DOI] [PubMed] [Google Scholar]
- Mazor O, Laurent G. Transient dynamics versus fixed points in odor representations by locust antennal lobe projection neurons. Neuron. 2005;48:661–673. doi: 10.1016/j.neuron.2005.09.032. [DOI] [PubMed] [Google Scholar]
- Meredith M. Patterned response to odor in mammalian olfactory bulb: the influence of intensity. J Neurophysiol. 1986;56:572–597. doi: 10.1152/jn.1986.56.3.572. [DOI] [PubMed] [Google Scholar]
- Michel WC, Ache BW. Odor-evoked inhibition in primary olfactory receptor neurons. Chem Senses. 1994;19:11–24. doi: 10.1093/chemse/19.1.11. [DOI] [PubMed] [Google Scholar]
- Ochieng SA, Hallberg E, Hansson BS. Fine structure and distribution of antennal sensilla of the desert locust, Schistocerca gregaria (Orthoptera: Acrididae) Cell Tissue Res. 1998;291:525–536. doi: 10.1007/s004410051022. [DOI] [PubMed] [Google Scholar]
- Perez-Orive J, Mazor O, Turner GC, Cassenaer S, Wilson RI, Laurent G. Oscillations and sparsening of odor representations in the mushroom body. Science. 2002;297:359–365. doi: 10.1126/science.1070502. [DOI] [PubMed] [Google Scholar]
- Pouzat C, Mazor O, Laurent G. Using noise signature to optimize spike-sorting and to assess neuronal classification quality. J Neurosci Methods. 2002;122:43–57. doi: 10.1016/s0165-0270(02)00276-5. [DOI] [PubMed] [Google Scholar]
- Raman B, Sun PA, Gutierrez-Galvez A, Gutierrez-Osuna R. Processing of chemical sensor arrays with a biologically inspired model of olfactory coding. IEEE Trans Neural Netw. 2006;17:1015–1024. doi: 10.1109/TNN.2006.875975. [DOI] [PubMed] [Google Scholar]
- Rulkov NF, Timofeev I, Bazhenov M. Oscillations in large-scale cortical networks: map-based model. J Comp Neurosci. 2004;17:203–223. doi: 10.1023/B:JCNS.0000037683.55688.7e. [DOI] [PubMed] [Google Scholar]
- Sicard G, Holley A. Receptor cell responses to odorants: similarities and differences among odorants. Brain Res. 1984;292:283–296. doi: 10.1016/0006-8993(84)90764-9. [DOI] [PubMed] [Google Scholar]
- Spors H, Grisvald A. Spatio-temporal dynamics of odor representations in the mammalian olfactory bulb. Neuron. 2002;34:301–315. doi: 10.1016/s0896-6273(02)00644-x. [DOI] [PubMed] [Google Scholar]
- Spors H, Wachowiak M, Cohen LB, Friedrich RW. Temporal dynamics and latency patterns of receptor neuron input to the olfactory bulb. J Neurosci. 2006;26:1247–1259. doi: 10.1523/JNEUROSCI.3100-05.2006. [DOI] [PMC free article] [PubMed] [Google Scholar]
- Stopfer M, Laurent G. Short-term memory in olfactory network dynamics. Nature. 1999;402:664–668. doi: 10.1038/45244. [DOI] [PubMed] [Google Scholar]
- Stopfer M, Jayaraman V, Laurent G. Intensity versus identity coding in an olfactory system. Neuron. 2003;39:991–1004. doi: 10.1016/j.neuron.2003.08.011. [DOI] [PubMed] [Google Scholar]
- Tanaka N, Ito K, Stopfer M. Odor-evoked neural oscillations in Drosophila are mediated by widely branching interneurons. J Neurosci. 2009;29:8595–8603. doi: 10.1523/JNEUROSCI.1455-09.2009. [DOI] [PMC free article] [PubMed] [Google Scholar]
- Wehr M, Laurent G. Relationship between afferent and central temporal patterns in the locust olfactory system. J Neurosci. 1999;19:381–390. doi: 10.1523/JNEUROSCI.19-01-00381.1999. [DOI] [PMC free article] [PubMed] [Google Scholar]