Summary
A decade ago, Dr. L.E. Kay and co-workers described an ingenious HNCO-based triple resonance experiment from which several protein backbone RDCs can be measured simultaneously [1]. They implemented a J-scaling technique in the 15N dimension of the 3D experiment to obtain the NH RDCs. We have used this idea to carry out J-scaling in a 2D 15N-1H TROSY experiment and have found it to be an excellent method to obtain NH RDCs for larger proteins upto 70 kDa, far superior to commonly used HSQC in-phase/anti-phase and HSQC/TROSY comparisons. Here, this method, dubbed “RDC-TROSY” is discussed in detail and the limits of its utility are assessed by simulations. Prominent in the latter analysis is the evaluation of the effect of amide proton flips on the “RDC-TROSY” linewidths. The details of the technical and computational implementations of these methods for the determination of domain-orientations in 45–60 KDa Hsp70 chaperone protein constructs are described.
The use of residual dipolar couplings (RDC) in biomolecular NMR can enhance the precision of local structure determination[2], and perhaps more importantly, allows unique access to meso-scale structural features of biomolecules in solution, such as relative domain orientations[3; 4] and dynamics[5] [6]. In principle, RDC’s exist for every pair of nuclear dipoles in the macromolecule, and several methods to measure these have appeared in the literature. In proteins, NH residual dipolar couplings are the most easily accessible. For very small proteins, they can be directly measured using a 15N-1H HSQC spectrum without 1H decoupling in the 15N dimension[7]. The difference frequency between these NHα and NHβ components is equal to 1JNH + RDCNH.
Resolution can be improved by separating the two doublet components by the in-phase/anti-phase (IP/AP) technique[8]. These methods start to fail for proteins of increasing size which are investigated using large static magnetic fields (B0). Because of 15N CSA / 15N-1H dipole-dipole cross correlated relaxation, the NHβ doublet line becomes much broader than the NHα line (see Figure 1). Indeed, the effect is exploited in TROSY spectroscopy, which selects for the narrow component[9]. Simultaneously, this also means that it becomes very difficult to obtain the frequency of the “anti-TROSY” component for larger systems, needed for the RDC determination, whether one selects for this peak directly, or by an IP/AP difference method. Figure 2 illustrates this difficulty for a 45 kDa protein (τc = 22 ns). A more recent approach uses the TROSY ST2-PT elements to achieve the selection of NHα and NHβ lines [10]. The draw backs are identical to that in IP/AP, and the method is not suitable for larger proteins either.
Figure 1.
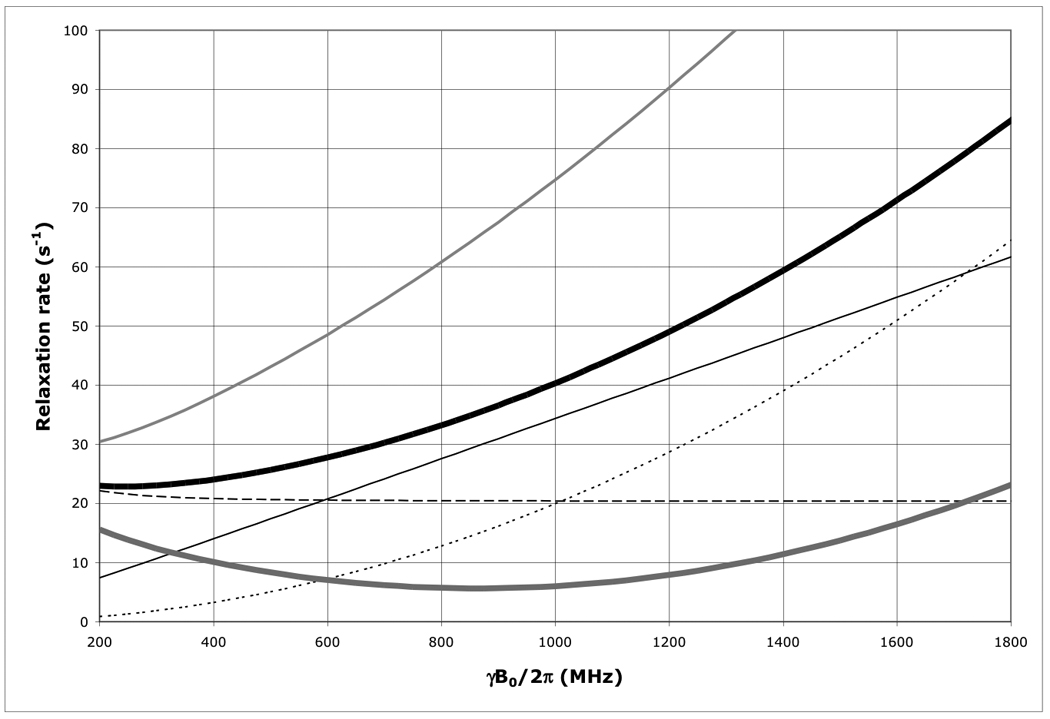
The field dependence of the protein 15N TROSY effect for τc=22 ns calculated using an rhombic 15N CSA tensor with σ11=230, σ22=87 and σ33=60 ppm, with σ1117 deg off the NH-bond of 1.04 Å using Eqs. (1–4).
Thick solid line: total 15N R2 as encountered in a HSQC or HMQC; Thick dashed line: 15N R2 due to 15N-1H dipolar relaxation; Thin dashed line: 15N R2 due to 15N CSA relaxation; Thin grey line: the 15N R2 15N-1H dipolar / 15N CSA cross correlated relaxation rate; Thick grey line: 15N R2 as encountered in a TROSY (i.e. total 15N R2 minus 15N R2 15N-1H dipolar / 15N CSA cross correlation). Thin grey line: 15N R2 of the anti-TROSY line (i.e. total 15N R2 plus 15N R2 15N-1H dipolar / 15N CSA cross correlated relaxation rate).
Figure 2.
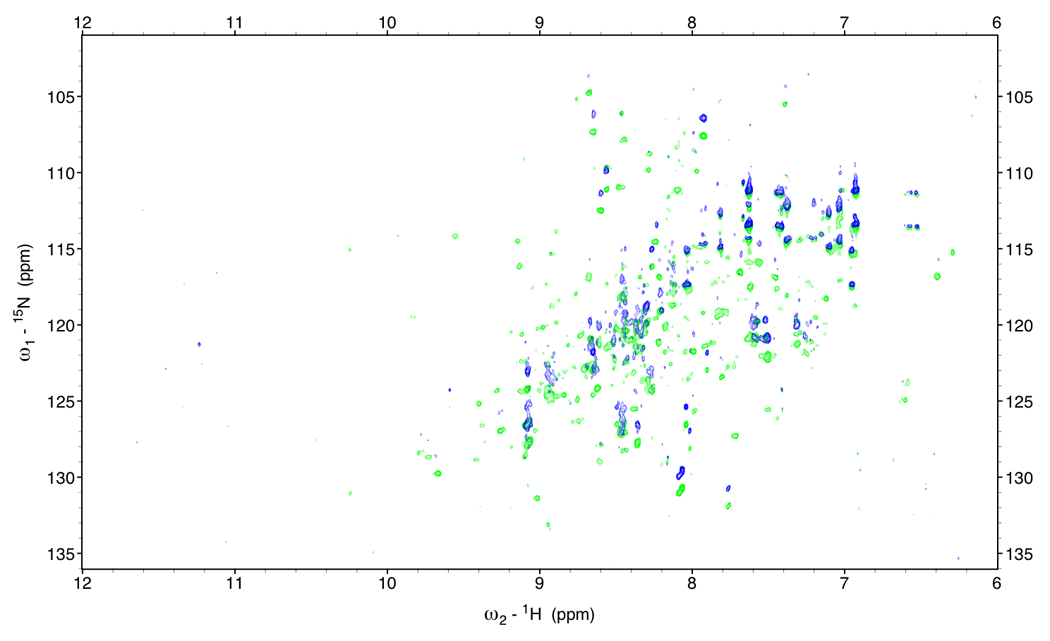
In-phase anti-phase difference spectra of DnaKTth-NBD at 15 °C (τc=22ns)
Green: NH α peaks; Blue: NH β peaks.
One approach is to obtain the NHα - NHβ difference frequency from measuring the 15N frequency difference between a TROSY spectrum and a decoupled HSQC spectrum[11]. The difference is equal to (1JNH + 1RDCNH)/2. The improvement is substantial (see Figure 2c), but still leaves much to be desired.
A decade ago, Kay and co-workers described an ingenious HNCO-based triple resonance experiment from which several protein backbone RDCs can be measured at once [1]. They implemented a J-scaling technique[12] in the 15N dimension of the 3D experiment to obtain the NH RDC. We have used this idea to carry out J-scaling in a 2D TROSY experiment and have found it to be an excellent method to obtain NH RDCs for larger proteins as described in several publications of our group [13; 14; 15; 16] . We call the experiment “RDC-TROSY”. Here, we describe this method in detail and assess the limits of its utility by simulations. Prominent in the latter analysis is the assessment of the effect of amide proton flips[17] on the RDC-TROSY linewidths.
We describe the technical and computational implementation of our methods by determining domain-orientations in an Hsp70 chaperone protein. The 70 kDa Hsp70 chaperone protein family plays fundamental roles in protein refolding and regulation using ATP-driven cycles of protein binding and release[18]. Hsp70 proteins consist of a 45 kDa N terminal Nucleotide Binding (ATPase) Domain (NBD) and a 25kDa C-terminal Substrate Binding Domain (SBD). The NBD is divided into four subdomains: IA, IB, IIA and IIB[19].
We have studied four forms of the TTDnaK Nucleotide Binding Domain denoted as DnaKTth-NBD: 1) The apo form, with no nucleotide bound; 2) The ADP.PO4 bound form and 3) The AMPPNP bound form (AMPPNP being a slowly hydrolyzed ATP analogue, we expect this to be similar to the ATP bound state). An ADP form of a construct that also contained the substrate-binding domain (DnaKTth-NBD-SBD) was also studied.
We observe significant, and different, NBD sub-domain rearrangements in these four states. In particular, subdomain IIB can change its orientation by as much as 20 degrees. Interestingly, such orientational changes were not observed in earlier X-ray structures of these proteins in different nucleotide states[20; 21; 22; 23; 24; 25].
Measurement of the RDCs for these orientational changes for a protein of this size required the use of the RDC-TROSY, which should be a useful general approach for other larger proteins as well.
Theory
Computations of TROSY line widths
The 15N linewidths of the TROSY, anti-TROSY and HSQC linewidths were computed for a protein with 22 ns correlation time, using the standard equations for the 15N-1H dipolar relaxation
| (1) |
for 15N CSA relaxation due to a rhombic CSA tensor
| (2) |
and the CSA / dipole-dipole cross correlated relaxation rate for a rhombic CSA tensor
| (3) |
In the above equations the following definitions were used:
| (4) |
and Θ indicates the angle between the 15N CSA principal axes and the NH vector. Other symbols have their usual meanings[26].
As is shown in Figure 1, the 15N TROSY R2 rate for a protein with τc=22 ns (the N+Hα transition) at 800 MHz is 5.7 s−1 (Δν1/2=1.8 Hz), for the anti-TROSY line (the N+Hβ transition) the R2 is 60.8 s−1 (19.4 Hz). The HSQC line has an R2 of 33.25 s−1 (Δν1/2=10.6 Hz). Similar equations were used for the calculation of the TROSY effect on the amide proton shown in Figure 7. The 1H-TROSY R2 rate for the same protein (the H+Nβ transition) at 800 MHz is 9 s−1, the anti-TROSY R2 rate is 47 s−1 (the H+Nα transition) and the HSQC R2 rate is 28 s−1.
Figure 7.
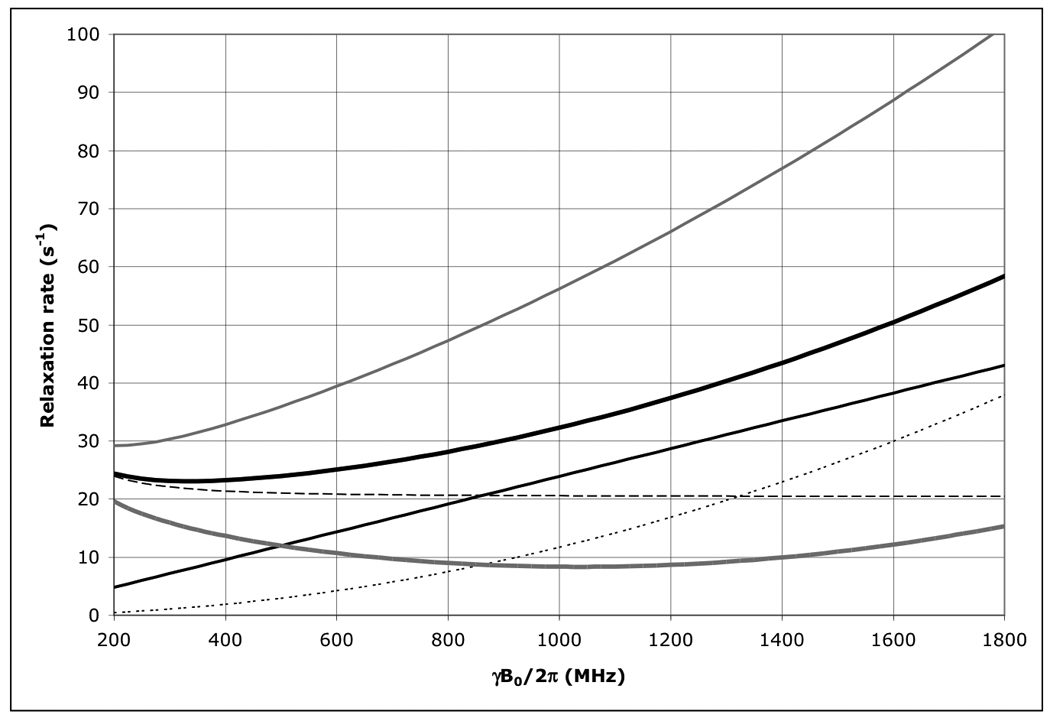
The field dependence of the protein 1H TROSY effect for τc=22 ns calculated using an rhombic 1H CSA tensor with σ11=3, σ22=8 and σ33=17 ppm, with σ11 aligned with the NH-bond of 1.04 Å, using Eqs. (1–4).
Thick solid line: total 1H R2 as encountered in a HSQC or HMQC; Thick dashed line: 1H R2 due to 15N-1H dipolar relaxation; Thin dashed line: 1H R2 due to 1H CSA relaxation; Thin grey line: the 1H R2 15N-1H dipolar / 1H CSA cross correlated relaxation rate; Thick grey line: 1H R2 as encountered in a TROSY (i.e. total 1H R2 minus 1H R2 15N-1H dipolar / 1H CSA cross correlation). Thin grey line: 1H R2 of the anti-TROSY line (i.e. total 1H R2 plus 1H R2 15N-1H dipolar / 1H CSA cross correlation).
Pulse sequence description
Residual dipolar couplings (RDCs) were extracted from a 2 dimensional experiment which is a 15N-1H TROSY with a [κt1/2–180(N,H)-κt1/2] sequence at the beginning of the 15N chemical shift labeling period (Fig.4). This sequence (hereafter referred to as ‘RDC-TROSY’) mixes the TROSY and anti TROSY components.
Figure 4.
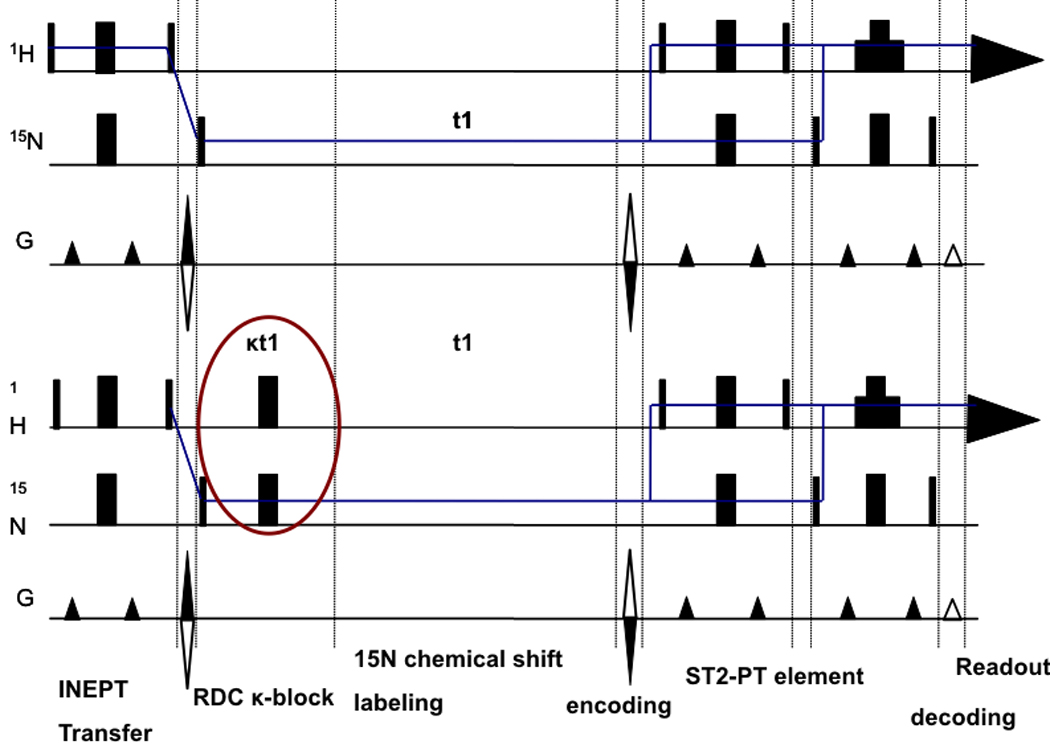
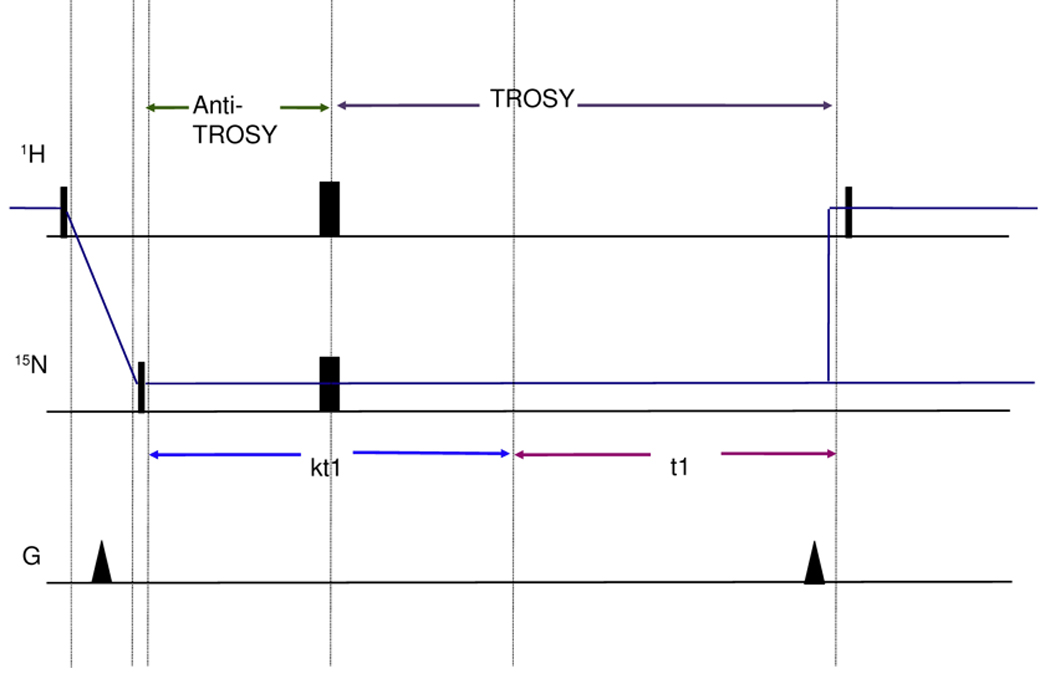
Figure 4a
Top: TROSY pulse sequence implementation following [43].
Bottom: RDC-TROSY pulse sequence to extract residual dipolar couplings
Figure 4b:
Detailed view of the κ-block
With reference to the HN spin system energy level diagram shown in Fig. 6, TROSY involves selecting the slowly relaxing transition and transferring it to the slowly relaxing transition (Fig.6).
Figure 6.
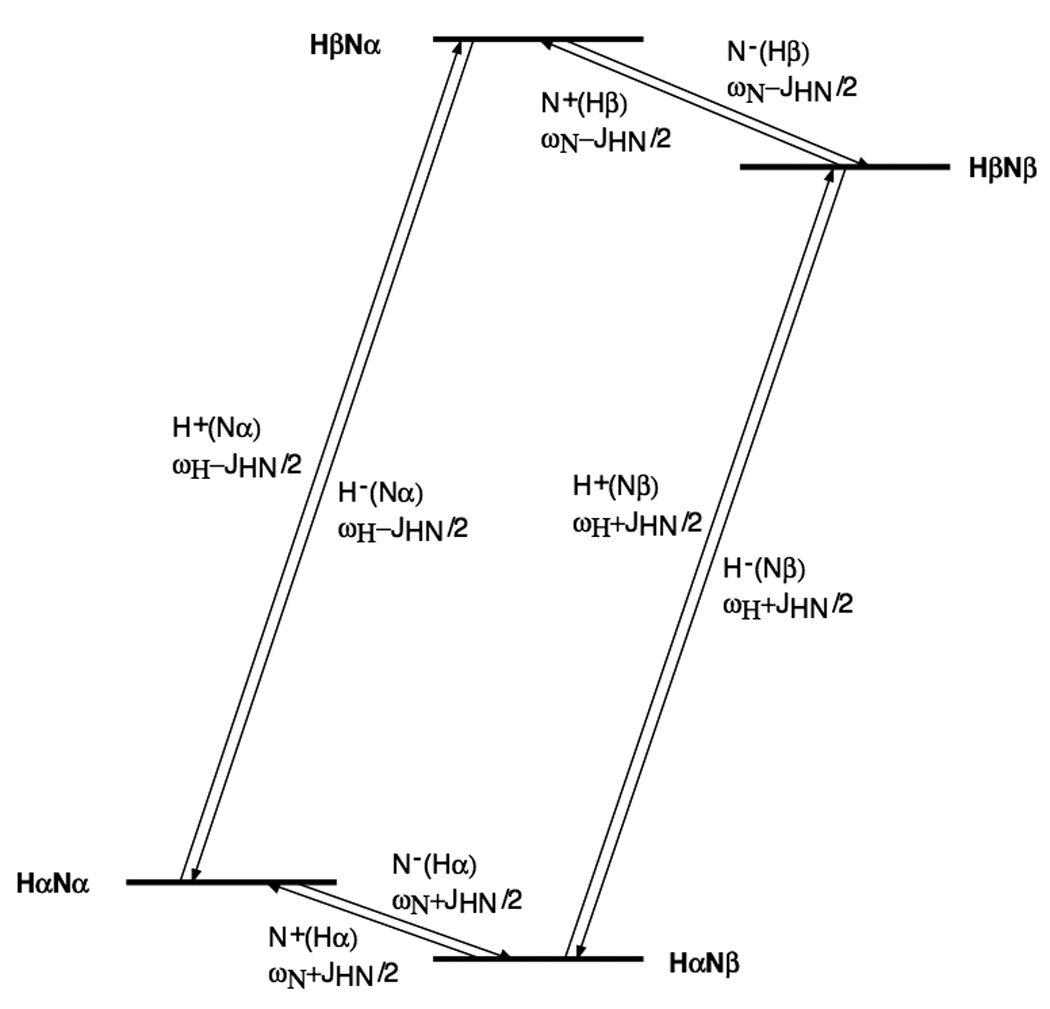
1H-15N spin system energy levels and definition of transitions.
The κ-block incorporates a κt1/2-πHN-κt1/2 period before the actual t1 period. Using the common the Cartesian operators for the initial INEPT block, one obtains:
| (5) |
Switching to transition operators (also known as ladder or shift operators), we use the relation to write the output of the INEPT block as
| (6) |
Now, recognizing that the longitudinal magnetization term HZ can be written as: HZ = Hα − Hβ, the Cartesian term −2HZNY can now be expanded to
| (7) |
which can be rewritten in terms of 15N coherences as
| (8) |
Therefore, realizing that the ‘i’ multiplier is merely a globally adjustable phase factor, the terms contributing to the density operator (σ) after the initial INEPT block, terminated by π/2 pulses on H and N are:
| (9) |
Note that time (t) has been set to zero at the end of the INEPT. This is for mathematical convenience, as well as the fact that the INEPT applies the same relaxation decay to all coherence terms.
To describe the effect of the κ-block, we will use the single-transition-operator formalism, for which the following transformation rules hold:
| (10) |
After evolution for a period κt1/2, the different 15N coherences contributing to the density operator are:
| (11) |
Here, and are the relaxation rates of coherences and ; JNH is the scalar coupling and DNH is the residual dipolar coupling between spins N and H. ΩN is the chemical shift of 15N.
Application of the πH pulse results in
| (12) |
Application of the πN pulse along the x-axis results in
| (13) |
These coherences now evolve for a time κt1/2+t1, leading to:
| (14) |
Combining terms, one obtains
| (15) |
The TROSY element now extracts the coherences and transfers those to coherences in the detection period. The time-domain signal in t1 is:
| (16) |
For κ=0, a standard TROSY spectrum is recovered:
| (17) |
For κ=2 one obtain
| (18) |
A frequency shift of 2π(J+D)NH is observed between the κ =0 and the κ=2 spectra. Varying κ allows this shift to be chosen at will. Thus, by collecting spectra for different values of κ and eliminating the scalar coupling contribution to the shift, the residual dipolar coupling (DNH) can be recovered. It is also obvious that undesirable relaxation terms are incorporated as κ increases. Thus a tradeoff between measurable RDCs and resolvable peaks exists. This will be discussed in detail in the Results and Discussion section.
Effect of amide proton spin flips
A key tenet of the description of the κ-block in the RDC-TROSY experiment above is the assumption that the NHα and NHβ coherences do not mix, except by the effects of 1H r.f. pulses. However, amide protons also flip spontaneously between states by relaxation mechanisms, dominated by zero-quantum flip-flops (NOEs) due to dipolar interactions with other protons in the vicinity. These rates can become quite fast [17] (upto 30 s−1 for larger and protonated proteins) and cause life-time broadening on the TROSY and anti-TROSY lines. The mechanism is referred to as “scalar relaxation of the second kind” [27], and is identical to chemical exchange broadening in slow-exchange regime [28]. The 15N evolution of the two doublet components in presence of proton spin flips of rate kαβ (= kβα) is described by the following Bloch-McConnell equations (here expressed in Cartesian single spin operators for computer coding ease, and omitting chemical shifts)
| (19) |
where represent the TROSY components and the anti-TROSY components, with the associated auto relaxation rates and .
We calculate the evaluation of these coherence components from these equations using numerical integration, for all 15N dwell times in the RDC-TROSY experiments for several κ values.
The effect of the 15N, 180 degree (x-phase) pulse between the two κ t1/2 periods is computed as
| (20) |
while the effect of the 1H 180 degree pulse is obtained by setting
The time domain signals and were transformed to the frequency domain using a complex Fourier transform.
Simulation of the precision of peak picking in noisy kappa-shifted spectra
Two-dimensional time-domain data for 11 NH cross peaks shifted by 0 Hz, JNH / 10 Hz, JNH / 5 … JNH/1 Hz, with linewidths and corresponding intensities as shown in Table 1, column 800 MHz, τc=20 ns, were simulated with the routine simTimeND[29]. The simulated time domain data corresponded closely to typical acquisition parameters (256 complex 15N points over a 3000 Hz spectral width). In total 18 copies were made of this simulated time-domain data. Using the routine addNoise [29], random noise at six different RMS levels, all with different noise seed numbers, was added to the 18 time-domain data sets, providing three copies per noise level each. The data was zero filled to 2048 points in the 15N dimension (1.5 Hz/point) and transformed using NmrPipe [29]. A typical “spectrum” is shown in Figure 9. Peak picks in these spectra were carried out with Sparky [30].
Table 1. 15N Hα effective R2 rates.
Relaxation rates calculated for the “15N TROSY” multiplet components in the RDC-TROSY experiment using Equations 1–4.
| Kappa | τc=5 ns 600 MHz |
τc=5 ns 800 MHz |
τc=10 ns 800 MHz |
τc =20 ns 800 MHz |
τc =30 ns 800 MHz |
|---|---|---|---|---|---|
| 0.00 | 1.88 | 1.44 | 2.66 | 5.20 | 7.77 |
| 0.20 | 3.34 | 3.09 | 5.75 | 11.25 | 16.82 |
| 0.40 | 4.80 | 4.75 | 8.83 | 17.30 | 25.86 |
| 0.60 | 6.25 | 6.40 | 11.92 | 23.35 | 34.91 |
| 0.80 | 7.71 | 8.06 | 15.00 | 29.40 | 43.96 |
| 1.00 | 9.17 | 9.71 | 18.09 | 35.45 | 53.01 |
| 1.20 | 10.63 | 11.36 | 21.18 | 41.50 | 62.05 |
| 1.40 | 12.09 | 13.02 | 24.26 | 47.55 | 71.10 |
| 1.60 | 13.54 | 14.67 | 27.35 | 53.60 | 80.15 |
| 1.80 | 15.00 | 16.33 | 30.43 | 59.65 | 89.19 |
| 2.00 | 16.46 | 17.98 | 33.52 | 65.70 | 98.24 |
| Anti-Trosy | 12.70 | 15.10 | 28.20 | 55.30 | 82.70 |
| HSQC | 7.29 | 8.27 | 15.43 | 30.25 | 45.24 |
Figure 9.

Example of simulated Kappa-shifted TROSY data to assess the effect of noise on the precision of RDC shift determination. This spectrum is one of the three spectra that was used to compute the second block of entries in Table 3 (i.e. the non-shifted peak, at the bottom left, has a S/N ratio of 91). The kappa value increases in steps of 0.2 from left to right.
Materials and methods
DnaKTth-NBD. The plasmid for wild type DnaKTth-NBD (residues 1- 382) was expressed in E.coli BL21 cells at 37 °C in M9 media with 99%2H20, 98% 15NH4Cl, and 99% 13C,1H glucose. All isotopes were purchased from Cambridge Isotope Laboratory (Andover, MA). The His-tagged protein was purified as described previously[31; 32]. Guanidine-HCl and heating was required to denature DnaKTth-NBD to allow re-protonation of all amide groups in the perdeuterated protein and complete removal of the bound nucleotide. Samples for NMR experiments were made at a protein concentration of 0.34 mM in a buffer containing 50mM HEPES, 10mM KCl, 5mM MgCl2, and 5mM sodium phosphate. Nucleotide concentration (ADP or AMPPNP) was 10 mM. DnaKTth-NBD behaves well in a solution of 10 mg/ml Pf1 phage at 50° C, allowing the measurement of 15N-1H RDC’s using RDC-TROSY. The RDC-TROSY experiments were recorded at 50° C on an 800 MHz Varian Inova spectrometer, using a triple resonance cold-probe, for κ=0, κ = ¾ and κ =3/2. 10, 20 and 40 hours of data acquisition was used for the κ =0, 0.75 and 1.5 experiments, respectively.
DnaKTth-NBD-SBD . The truncated 1–501 form of DnaKTth was constructed by PCR from a plasmid containing the full length DnaKTth gene supplied by Dr. A. Joachimiak at Argonne National Laboratory. The resulting plasmid, pMR23, had the 1–500 sequence of wild type DnaKTth with the L501E mutation and a 6-residue histidine tail. Introduction of the ΔT422, A423E mutations was accomplished using mutagenic primers and the Quickchange mutagenesis Kit (Stratagene). E. coli strain BL21 (DE3) cells containing the pMR23 plasmid were grown at 37 °C in M9 media with 15NH4Cl or with 99%2H20, 98% 15NH4Cl, and 99% 13C, 1H glucose. All isotopes were purchased from Cambridge Isotope Laboratory (Andover, MA). The His-tagged protein was purified as described previously. Guanidine-HCl and heating was required to denature DnaKTth-NBD-SBD to allow re-protonation of all amide groups in the perdeuterated protein and complete removal of the bound nucleotide. TROSY spectra of the protein confirmed that it was properly re-folded from these conditions. NMR spectra were collected at 55 °C using an 800 MHz Varian Inova spectrometer, using a triple-resonance Z-gradient probe. Samples were approximately 400 mM DnaKTth-NBD-SBD in 50 mM HEPES pH 7.4, 10 mM KCl, 5 mM MgCl2, 5 mM ADP and 5mM Na2PO4. At these conditions, the protein was monomeric as derived from the rotational correlation time of approximately 15 ns determined from 1D 15N NMR R1 and R2 relaxation data.
DnaKTth-NBD-SBD ADP.Pi /apo behaves well in a solution of 20 mg/ml Pf1 phage at 50° C, allowing the measurement of 15N-1H RDC’s using RDC-TROSY. RDC-TROSY experiments were recorded at 50° Celsius on an 800 MHz Varian Inova spectrometer, using a conventional triple resonance probe, for κ =0, κ = 1 and κ =2.
Backbone resonance assignments
A peak list (Revington and Zuiderweg, unpublished) prepared for DnaKTth-NBD in the ADP-AlFx state, based on earlier assignment work [32] was used as a template for assignment of the peptide backbone of DnaKTth-NBD in the different nucleotide states. The raw data was processed and transformed using NmrPipe[29]. The assignment ‘walk’ through the peptide backbone was done using Sparky[30]. A total of 223 assignments for the APO form, 281 for the ADP form and 310 for the AMPPNP form of the protein were obtained. The backbone resonance assignments of the 501-residue DnaKTth-NBD-SBD in the presence of ADP.Pi and in the absence of peptide substrate at pH 7.4 and 55 °C were extended from earlier work on the 381-residue DnaKTth NBD. A total of 415 of the 475 non-proline residues in the native sequence (87%) could be unambiguously assigned.
Results and Discussion
Experimental results
Initially, our lab started the collection of RDC data for proteins in the MW class 45 – 70 kDa using the 3D HNCO-based kappa-shifted sequences as described by Yang et al [1]. However, we found that approach to be of too low sensitivity to be of practical use for these large proteins. This was the impetus to move “back” to 2D versions of this experiment, and the detailed evaluation of that method described herein.
We report that the RDC TROSY experiments yielded 277 out of a possible 386 RDC’s for the Nucleotide Binding Domain (NBD) of Hsc70 in the ADP state (72%), 259 out of a possible 384 RDC’s for the NBD of DnaK-TTh in the AMPPNP state (67%), 190 out of a possible 501 RDC’s for a two-domain construct of DnaK-TTh in the ADP state (38%) and 262 RDCs of the possible 603 RDCs for DnaK-E.coli in the ADP/peptide state (43%). On average, 55%. It should be pointed out that the collection of a series of kappa data allows one to follow the “trajectories” of the individual NH cross peaks, and, hence, enables one to identify shifts of peaks even in crowded areas.
Simulations
As is shown in Figure 5, the RDC-TROSY experiments yield good sensitivity for the extraction of RDCs. Residual CSAs [33] are identical for all values of κ, since the 15N 180 degree pulse in the κ-block refocuses them. Hence residual CSAs do not appear in the differences between the κ experiments. As shown in the calculations above, the effective 15N relaxation rate of the detected TROSY line is given as
| (21) |
where is the 15N TROSY (NHα) linewidth, and is the 15N Anti-TROSY (NHβ) linewidth. varies between and in the range 0 ≤ κ ≤ 2.
Figure 5.
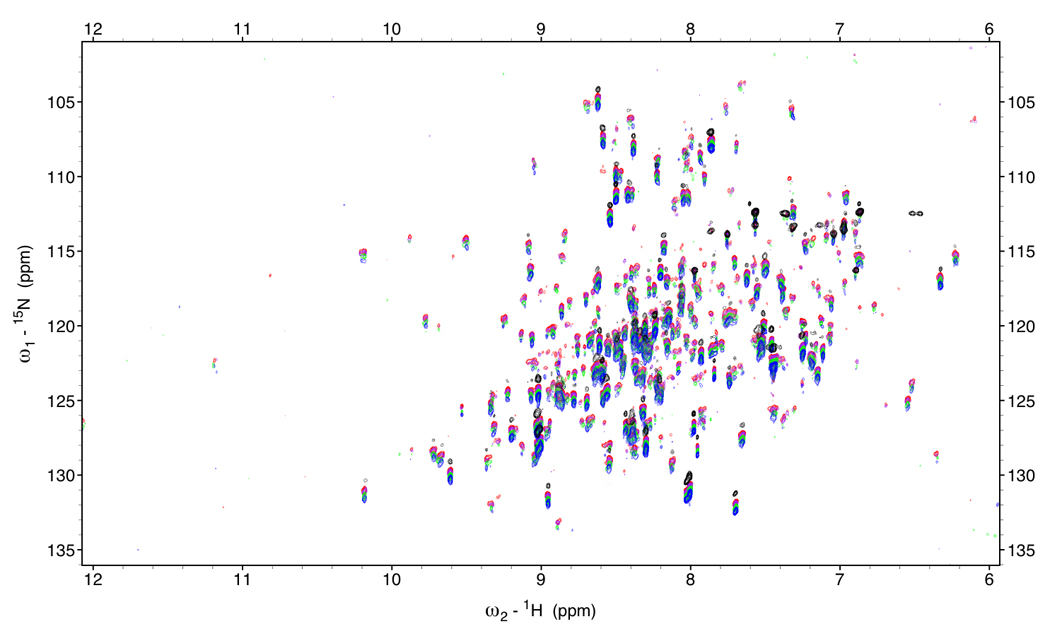
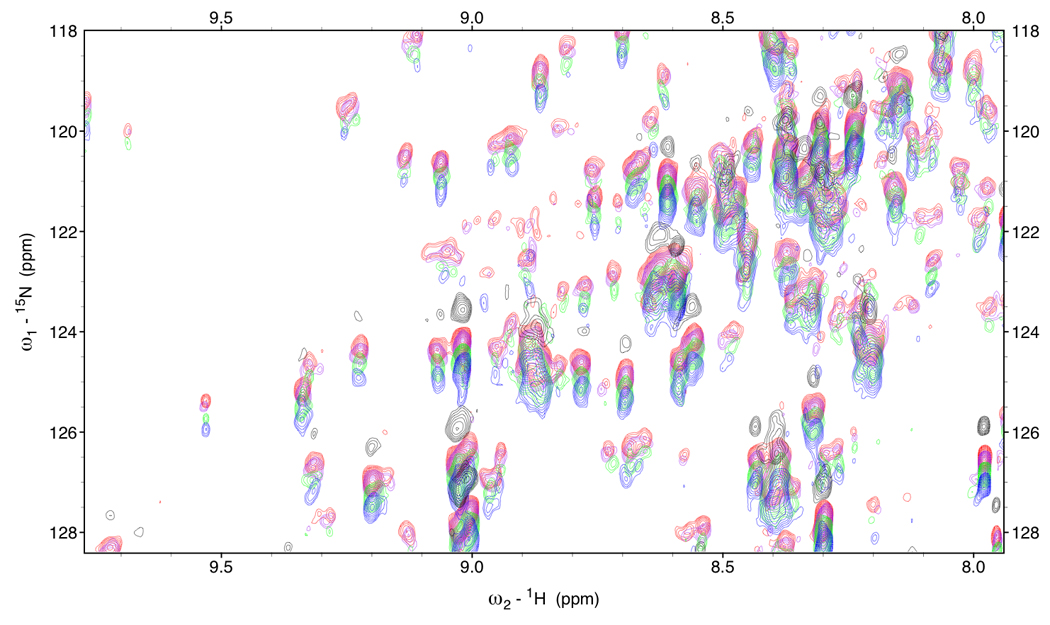
Figure 5a.
RDC-TROSY’s of DnaKTth-NBD at 15 °C (τc=22ns)
Red: κ=0, Purple: κ=0.2, green: κ=0.6 Blue: κ=1.
In black is the HSQC spectrum.
Figure 5b.
Detail of RDC-TROSY’s of DnaKTth-NBD
Red: κ=0, Purple: κ=0.2, green: κ=0.6 Blue: κ=1.
In black is the HSQC spectrum.
Table 1 gives the computed R2eff values (based on Eqs (1–4)) for different κ values and for HSQC, for different rotational correlation times, at 600 and 800 MHz 1H. It shows that the 15N linewidth for the κ=0.8 experiment is smaller than that for the HSQC experiment for all correlation times at all fields.
Table 2 shows that the relative 15N intensity for the κ=1.2 experiment is larger than that for the HSQC experiment for all correlation times using an 800 MHz system.
Table 2. 15N Hα line relative peak height.
Relative peak heights, setting the κ=0 line to 100 a.u. for each correlation time. The Peak intensity of the Anti-TROSY line is reduced by the ratio 1H ANTI-TROSY / 1H TROSY intensity; The peak intensity of the HSQC line is reduced by the ratio 2* 1H HSQC / 1H TROSY intensity (see Figure 7).
| Kappa | τc=5 ns 600 MHz |
τc=5 ns 800 MHz |
τc=10 ns 800 MHz |
τc=20 ns 800 MHz |
τc=30 ns 800 MHz |
|---|---|---|---|---|---|
| 0.00 | 100.00 | 100.00 | 100.00 | 100.00 | 100.00 |
| 0.20 | 56.32 | 46.54 | 46.29 | 46.22 | 46.20 |
| 0.40 | 39.20 | 30.33 | 30.12 | 30.06 | 30.04 |
| 0.60 | 30.06 | 22.49 | 22.32 | 22.27 | 22.2 |
| 0.80 | 24.38 | 17.87 | 17.73 | 17.69 | 17.68 |
| 1.00 | 20.50 | 14.83 | 14.70 | 14.67 | 14.66 |
| 1.20 | 17.69 | 12.67 | 12.56 | 12.53 | 12.52 |
| 1.40 | 15.56 | 11.06 | 10.96 | 10.94 | 10.93 |
| 1.60 | 13.88 | 9.81 | 9.73 | 9.70 | 9.69 |
| 1.80 | 12.53 | 8.82 | 8.74 | 8.72 | 8.71 |
| 2.00 | 11.42 | 8.01 | 7.94 | 7.91 | 7.91 |
| Anti-Trosy | 5.49 | 2.42 | 1.95 | 1.80 | 1.78 |
| HSQC | 27.92 | 14.08 | 11.80 | 11.07 | 10.96 |
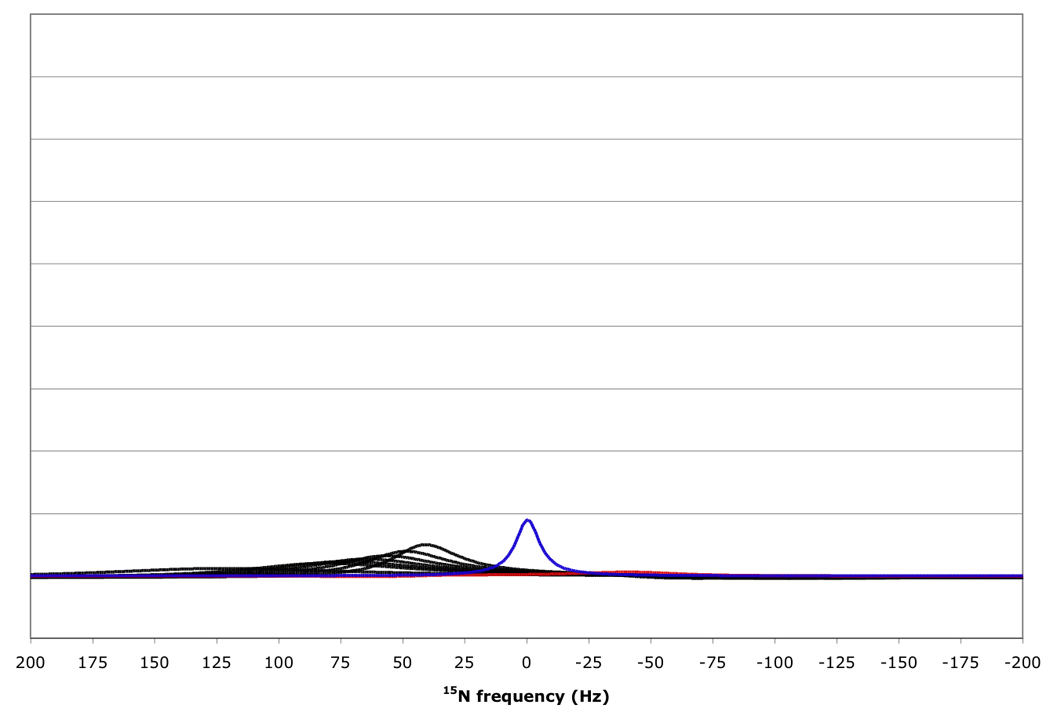
Explicit simulation of the RDC-TROSY experiments yields spectra as shown in Figure 8. They convey the same message as shown in Table 1 and Table 2: RDC-TROSY experimentation is superior to the TROSY- HSQC comparison up to κ values of 1.0.
Figure 8.
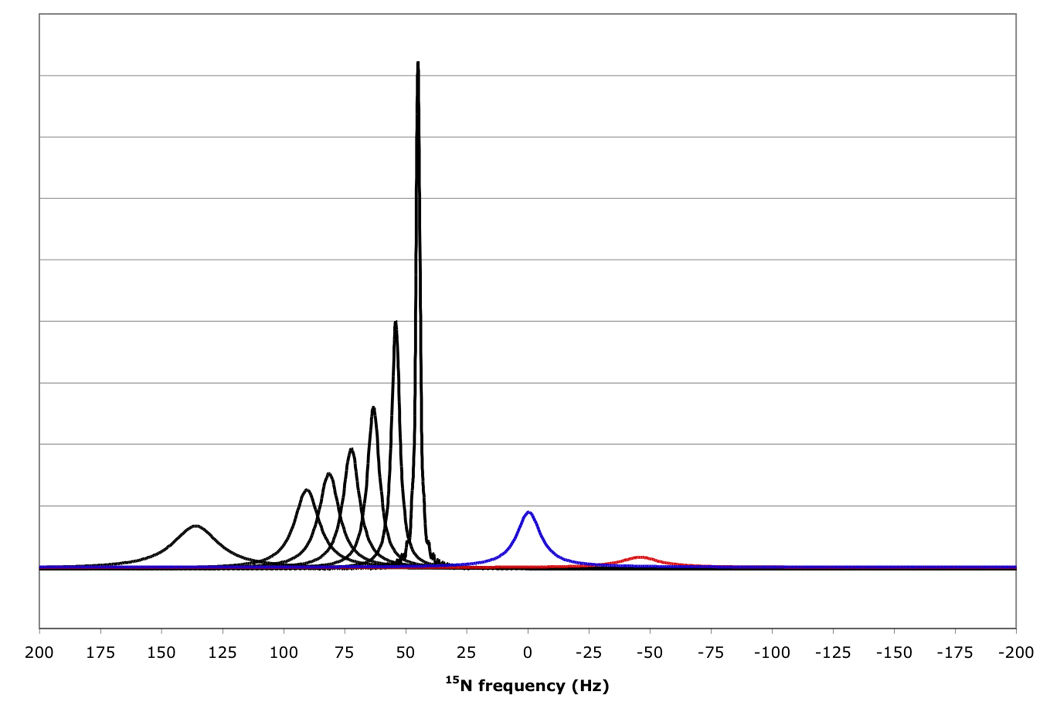
15N resonance positions, intensities and linewidths for the NH doublet components in various experiments, calculated for protein with τc=22 ns, at 800 MHz 1H, no amide proton flips.
In black, RDC-Trosy peaks, with κ values of 0, 0.2, 0.4, 0.6, 0.8, 1.0 and 2.0 from right to left.
In red, the anti-TROSY peak, scaled down by a factor of 5 due to additional broadening in the 1H dimension (see Fig 7); in blue, the HSQC peak with intrinsic double intensity, but scaled down by a factor of 3 due to additional broadening in the 1H dimension (see Fig 7).
The question arises which of the “settings” of kappa in this range is best for the determination of the RDCs. Small kappa values yield peaks with high S/N, but any error in the peak position determination will be multiplied when the true RDC value is calculated. On the other hand, peak position errors will not be multiplied much for larger kappa values, but the peak position determination itself is more prone to error. Is there a optimum compromise? In order to answer this question we simulated kappa-shifted data for a τc=20 ns protein at 800 MHz, with various levels of noise (see Theory section). A typical simulated spectrum is shown in Figure 9. The results of the peak picks and RDC computations from such spectra are listed in Table 3. The table shows that it is best to collect the data with smallest kappa value, virtually independent of the signal to noise ratio. Apparently, the improved precision of a peak pick on a signal with small kappa values and high S/N compensates for the higher precision needed. It also clear that peak picking on any peak with a S/N less than 20 is prone to larger errors. The predicted precision of around 4Hz corresponds closely to our experience with the experimental precision of RDC determinations for proteins in this size class.
Table 3. Precision of the determination of JNH from spectra with different kappa shifts.
Precision of the determination of JNH from spectra with different kappa shifts as a function of signal to noise ratio. Peak intensities and linewidths were taken from Table 1, 800 MHz, τc 20 ns. The data was simulated using the routines simTimeND, addNoise and NmrPipe. The peak picks and S/N calculations were carried out with Sparky.
| Kappa | S/Na | Normalized Shiftb |
Max-Minc | S/N | Normalized Shiftb |
Max-Min | S/N | Normalized Shiftb |
Max-Min |
|---|---|---|---|---|---|---|---|---|---|
| 0.00 | 154.00 | 91.00 | 65.00 | ||||||
| 0.20 | 71.33 | 90.07 | 1.32 | 43.33 | 89.93 | 1.73 | 31.33 | 92.07 | 5.08 |
| 0.40 | 51.00 | 89.61 | 1.53 | 30.67 | 90.22 | 2.19 | 21.67 | 86.56 | 3.41 |
| 0.60 | 37.67 | 90.14 | 5.97 | 23.33 | 87.68 | 7.42 | 15.00 | 89.25 | 1.66 |
| 0.80 | 32.67 | 91.24 | 0.74 | 17.33 | 87.10 | 5.03 | 13.67 | 93.51 | 2.77 |
| 1.00 | 27.00 | 91.36 | 2.32 | 16.67 | 89.51 | 8.97 | 14.00 | 93.28 | 4.07 |
| 1.20 | 20.67 | 90.85 | 4.69 | 14.33 | 92.07 | 2.31 | 10.67 | 89.45 | 7.02 |
| 1.40 | 20.67 | 89.65 | 1.03 | 13.67 | 88.42 | 2.60 | 9.67 | 85.87 | 5.96 |
| 1.60 | 19.33 | 91.07 | 1.78 | 11.33 | 88.42 | 8.08 | 10.00 | 90.96 | 7.16 |
| 1.80 | 18.00 | 92.29 | 0.23 | ||||||
| 2.00 | 16.67 | 88.68 | 7.04 | ||||||
| Kappa | S/N | Normalized Shiftb |
Max-Min | S/N | Normalized Shiftb |
Max-Min | S/N | Normalized Shiftb |
Max-Min |
| 0.00 | 45.67 | 37.00 | 28.00 | ||||||
| 0.20 | 21.33 | 87.15 | 5.69 | 13.67 | 90.68 | 3.97 | 13.33 | 84.61 | 5.39 |
| 0.40 | 16.33 | 91.05 | 7.12 | 14.00 | 88.02 | 8.44 | 10.67 | 91.75 | 6.71 |
| 0.60 | 13.00 | 89.91 | 4.64 | 11.67 | 94.20 | 9.73 | 9.00 | 85.44 | 13.90 |
| 0.80 | 10.00 | 90.11 | 2.14 | ||||||
| 1.00 | 10.00 | 90.66 | 14.12 |
The average Signal-to-noise ratio of the kappa-shifted peaks in three simulated spectra.
the normalized shift was calculated as (peak(kappa) – peak(0))*2/kappa*90., where peak(kappa) is the average peak-pick position in three simulated data sets with approximately the same noise level. The position peak(0) was taken from noise free data for all calculations.
The differences between the maximum and minimum values for the shift, as computed for the three spectra. This is a crude measure of the statistical error in the peak pick.
However, the 15N linewidth and peak intensity of in the RDC-TROSY experimentation is affected by amide proton flip-flop rates, which occur predominantly because of zero-quantum flip-flops (large-molecule regime NOEs) with other protons in the vicinity[17]. These rates can become quite fast (upto 30 s−1 for larger and especially protonated proteins, see Table 4) and cause life-time broadening on the TROSY and anti-TROSY lines (see Theory section). The effect can easily double the TROSY line width, and hence, reduce the peak detection sensitivity by equal amounts. Perdeuteration of the protein does reduce the effect substantially, but the lifetime broadening can never be completely overcome for amide protons that are close to each other such as in alpha helices.
Table 4. Computed ZQ flip rates.
ZQ flip rates for different NH – H distances, computed from standard dipolar relaxation equations. The typical rates for an NH in a helix of protein was computed from the coordinates of the protons surrounding NH of residue 280 in the PDB file 3HSC.
| Distance | τc | ZQ Flip rate | |
|---|---|---|---|
| Å | ns | s−1 | |
| NH-NH pair | 2.8 | 20 | 2.23 |
| NH-NH pair | 2.8 | 40 | 4.46 |
| NH in helix of Perdeuterated protein |
All NH within 5 Å | 20 | 8.47 |
| NH in helix of proteated protein |
All protons within 5 Å |
20 | 24.2 |
Figure 10 shows that for amide proton flip-flop rates less than 10 s−1 the RDC-TROSY experiment remains superior to the TROSY-HSQC comparison. For rates between 30 and 100 s−1, the TROSY-HSQC comparison becomes equal or superior. For amide proton flip-flop rates faster than 100 s−1, the NHα-NHβ doublet “auto-decouples” and collapses to the HSQC position. In this case 1H-15N RDCs cannot be measured anymore from the 15N dimension. In the kinetic regime just before the collapse occurs, intermediate exchange causes small shifts of the lines from their true positions[28]. Our simulations bear this out: whereas the slope of the line of the 15N resonance position vs. κ is the expected 45.5 Hz / unit of κ for kαβ=0, 3 and 10 s−1, small changes (45.08 Hz / unit of κ for kαβ=30 s−1) and substantial changes (40.5 Hz / unit of κ for kαβ=100 s−1) occur (see Fig 11). But, the shifts are not dramatic enough to be a true cause for concern in any practical case for which RDC’s can actually be measured.
Figure 10.
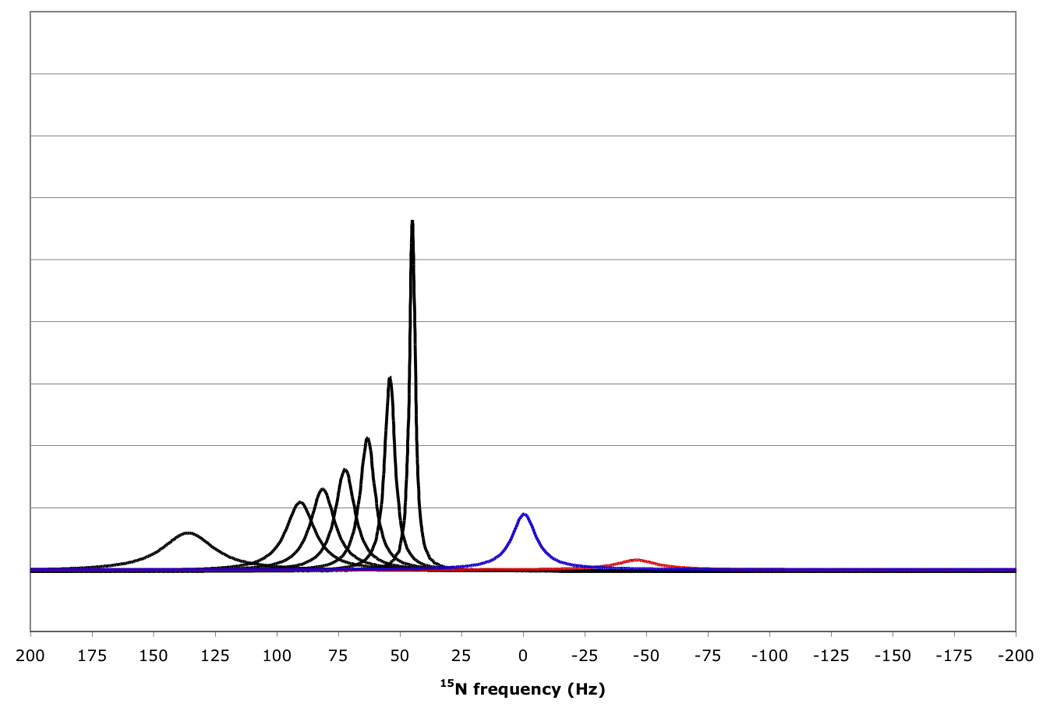
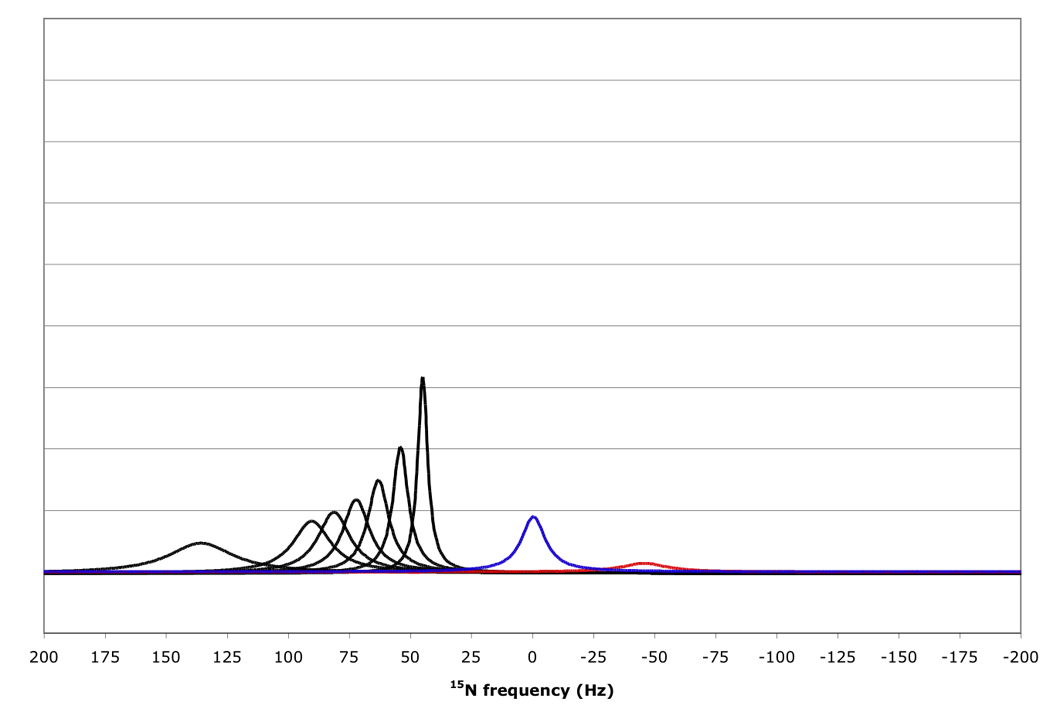
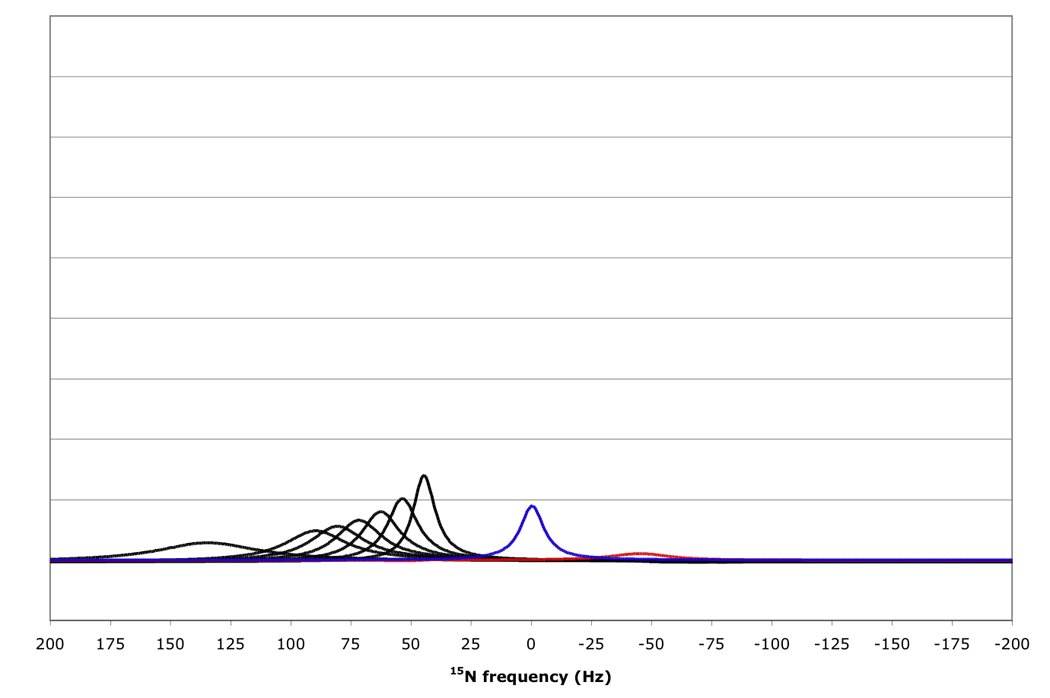
15N resonance positions, intensities and linewidths for the NH doublet components in various RDC-TROSY experiments, calculated for protein with τc=22 ns, at 800 MHz 1H. Color coding and scaling is the same as in Fig 8.
From top to bottom: kαβ=kβα=3 s−1; 10 s−1; 30 s−1; 100 s−1.
Figure 11.
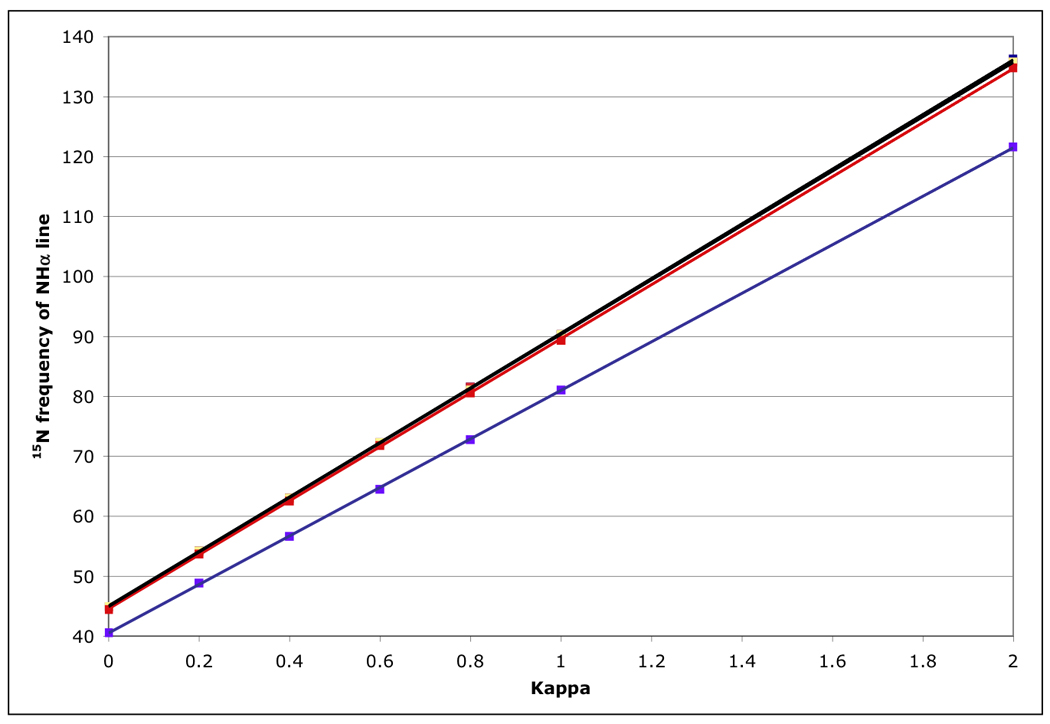
15N peak frequency for the NHα (TROSY) line, calculated for a protein with τc=22 ns, at 800 MHz 1H for the RDC-TROSY experiments. The lines in the figure are least squares fits, with slopes of 45.63, 45.39, 45.37, (all black) 45.08 (red) and 40.5 (blue) Hz / unit of κ for kαβ=0, 3, 10, 30 and 100 s−1, respectively.
Summarizing, the simulations bear out that the RDC--TROSY experimentation for the extraction of RDCs is to be preferred over TROSY – HSQC comparisons for proteins with τc > 10 ns, provided that the amide proton flip-flop rates are not faster than 30 s−1. Our simulations also point to the importance of protein perdeuteration in all TROSY experimentation: not only does it improve the amide 1H line width, but it also improves the 15N line width by suppressing much of the proton flip-flop processes.
Application of RDC-TROSY to subdomain orientation of the NBD of DnaK Thermus Thermophilus
Extracting RDC’s for DnaKTth-NBD and DnaKTth-NBD-SBD
Comparison of 3 datasets collected for three κ values showed excellent stability and reproducibility of spectra. Peak positions were reproducible within 4 Hz. Files corresponding to each κ value were co-added for higher S/Ns. Sequence-specific variations in 1JNH are expected to be less than 1 Hz as was determined for smaller proteins. Since this variation is smaller than the accuracy of the peak position determinations in the spectra for DnaKTth-NBD, the RDC-TROSY spectra were superposed after shifting them by κ/2 * 1JNH, where we assumed a uniform 1JNH of 90.5 Hz. What remains is the RDC. Sparky functions[30] were used to volume integrate and peak center each peak. Peak-lists were generated with the chemical shift in Hz and compiled in a spreadsheet. Differences in 15N shift between each κ-value and κ=0 yield the RDC multiplied by a suitable scaling factor (0.375 or 0.75).
Procedure used to determine a subset of experimental RDCs of maximal mutual consistency
Based on the way that the constants are defined in the RDC equation, the difference of 15N shift between the κ=0.75 and the κ=0 block yields 0.375*RDC. The difference between the κ=1.5 block and the κ=0 block yields 0.75*RDC.
The quantity yields the properly scaled ‘modulo differential error’ in RDC. The square of this quantity is defined as the ‘square differential error’.
The square differential error was plotted for each residue. Residues for which the square differential error deviates more than 2*RMSD from the mean value were rejected.
This filter was applied twice, to yield a dataset designated ‘statistically sound’.
Shown in Fig.13 are three plots of 0.375*RDC vs. 0.75*RDC, determined as discussed above. These plots correspond to the dataset before filtering, and after the first and second filtering process. The improvement in the R2 value from 0.712 to 0.9393 indicates mutually consistent RDCs.
We used a homology model of DnaKTth-NBD for our computations. To avoid RDC violations due to uncertainties in the model, we only used RDCs for those residues that correspond to maximally conserved residues across different members of the Hsp70 family were retained from the statistically sound dataset. The resulting dataset was designated ‘experimentally sound’.
Figure 13.
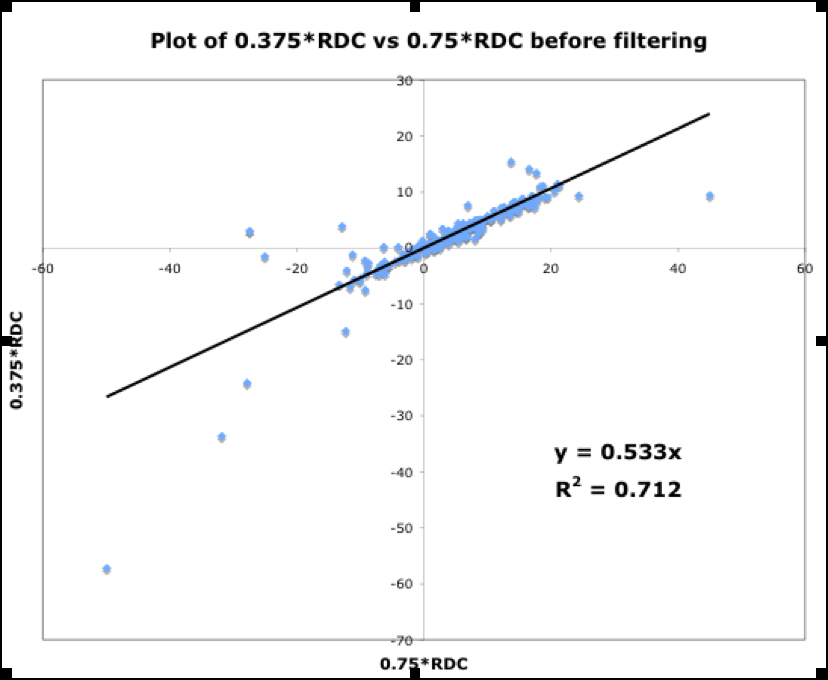
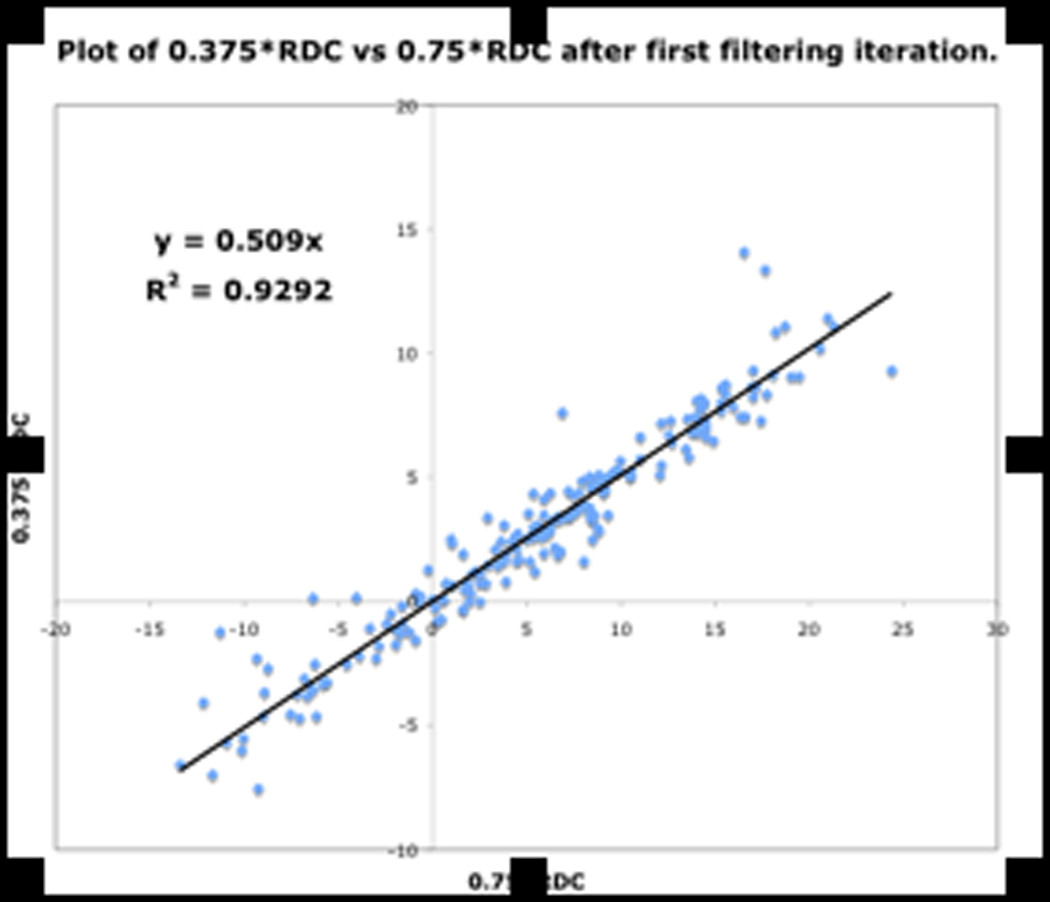
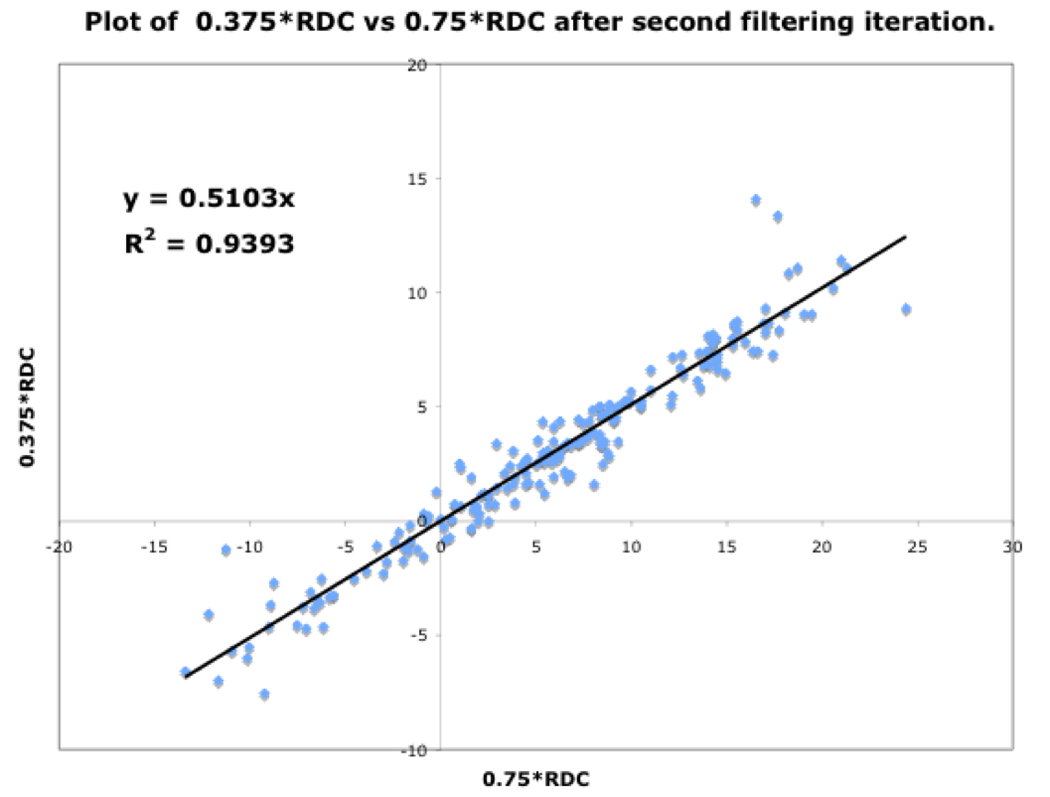
Figure. 13a: RDC consistency before filtering
Figure. 13b: After first filter
Figure. 13c: After second filter
This led to a subset of RDCs, enumerated in Table 3 per sub-domain, for each form of the protein.
Statistics of the computation
We used in-house written Fortran 90 programs and REDCAT[34] (A Residual Dipolar Coupling Analysis Tool) to transform the RDCs to orientational data for the NBD subdomains. RDC data can be transformed to a set of simultaneous linear equations using spherical harmonics. These simultaneous linear equations are then numerically solved. REDCAT’s solution algorithm relies on singular value decomposition and Monte Carlo error estimation to generate an ensemble of 1000 structures compatible with the input structures and the set of RDCs provided[35], in our case based on an experimental error range of 4 Hz. Along with the 1000 nontrivial solutions, 10 ‘null’ set solutions are also generated. The in-house written Fortran program is based on a grid and minimization search of all possible Euler rotations, overall alignment and rhombicity, to find the best fit to the experimental data. The results are identical to the REDCAT solutions for high quality data. However, for noisy data, the Fortran program proved to be the more robust approach to find solutions. The structural data shown in this report were all derived from the results of Fortran program, since it gave easier access to the distribution of Euler angles. The Fortran program is available upon request. The Sanson-Flamsteed plots were derived from REDCAT.
For our purposes, each sub-domain of the DnaKTth-NBD is viewed as an internally ‘rigid’ fragment. The rationale is that rigid-body reorientations of the individual sub-domains have been observed in crystal structures of complexes of chaperones and co-chaperones such as BAG-1[36], GrpE[37] and HspBP[38]. Furthermore, we observed significant exchange broadening on the interfaces between the sub-domains, indicating true boundaries in solution as well. Hence it was possible to use the residual dipolar couplings to provide orientation information by identifying each sub-domain of DnaKTth-NBD as a rigid fragment.
Identifying each sub-domain of DnaKTth-NBD as a rigid fragment, residual dipolar couplings provide orientation information. This information once extracted was applied to the homology model of DnaKTth-NBD to detect conformational changes. The homology model was constructed in two steps. First, we threaded the sequence of DnaKTth-NBD on the coordinates of a crystal structure of the NBD of DnaK-E.Coli, the protein most homologous to DnaK T. thermophilus for which coordinates are available[37] (1DKG.pdb, with a resolution of 2.8 Å). However, this structure was obtained in the presence of a nucleotide exchange factor, which likely rearranged the subdomain orientations. Several crystal structures[20] without co-chaperones are available for the bovine Hsc70 NBD, in which the subdomain orientations, especially for IIB, are different from that seen in 1DKG.pdb. In order to obtain the required reference model for DnaKTth-NBD, we adjusted the orientations of the subdomains in the model to correspond with those in 3HSC.pdb, a structure of Hsc70-NBD nominally in the ADP state at a resolution of 1.90 Å. The adjustment was based on a superposition of the Ca atoms of the secondary structure elements in the subdomains.
Subdomain orientations
Table 5 shows the statistics of the sub-domain orientation determination using the grid-search Fortran-90 programs with a Jack knife cut off of 60% of the experimental data.
Table 5. Statistics of RDC calculations of DnaK-TTh-NDB.
Calculations for the subdomains of DnaK-TTh-NDB in various states, using a grid-search algorithm.
| Na | αb | βb | γb | RMSD | Qc | Szz | Syy | Sxx | ||
|---|---|---|---|---|---|---|---|---|---|---|
| Deg. | Deg. | Deg. | Å | |||||||
| DnaKTTh-NBD AMPPNP IA | Alld | 45 | 161.83 | 87.59 | 63.07 | 8.11 | 0.65 | −8.61 E−04 | 8.83E−04 | −2.14E−05 |
| <SV>e | 34 | 160.23 | 87.41 | 61.89 | 9.10 | 0.68 | −9.21 E−04 | 8.64E−04 | 5.68E−05 | |
| σf | 4 | 6.18 | 4.48 | 5.20 | 1.63 | 0.10 | 6.31 E−05 | 1.02E−04 | 7.41 E−05 | |
| DnaKTTh-NBD AMPPNP IB | All | 26 | 136.39 | 76.41 | 69.98 | 10.52 | 0.67 | −1.07E−03 | 7.54E−04 | 3.13E−04 |
| <SV> | 23 | 145.34 | 81.41 | 66.17 | 11.06 | 0.74 | −8.97E−04 | 7.38E−04 | 1.59E−04 | |
| σ | 3 | 26.26 | 5.27 | 4.51 | 0.91 | 0.06 | 6.43E−05 | 9.32E−05 | 8.65E−05 | |
| DnaKTTh-NBD AMPPNP IIA | All | 34 | 163.02 | 90.63 | 61.09 | 90.63 | 118.91 | 7.30E+01 | 1.51E+02 | 1.63E+02 |
| <SV> | 27 | 144.59 | 88.00 | 58.68 | 6.97 | 0.53 | −9.27E−04 | 7.37E−04 | 1.90E−04 | |
| σ | 4 | 6.89 | 5.91 | 4.57 | 0.62 | 0.06 | 5.13E−05 | 6.43E−05 | 8.87E−05 | |
| DnaKTTh-NBD AMPPNP IIB | All | 34 | 159.84 | 90.29 | 56.92 | 90.29 | 123.08 | 6.98E+01 | 1.47E+02 | 1.60E+02 |
| <SV> | 28 | 166.71 | 92.91 | 69.78 | 9.05 | 0.71 | −8.08E−04 | 8.07E−04 | 1.04E−06 | |
| σ | 4 | 6.99 | 3.68 | 9.96 | 1.20 | 0.10 | 6.12E−05 | 6.56E−05 | 3.15E−05 | |
| DnaKTTh-NBD ADP IA | All | 45 | 157.95 | 84.39 | 67.53 | 7.94 | 0.60 | −1.02E−03 | 7.65E−04 | 2.58E−04 |
| <SV> | 40 | 163.96 | 85.36 | 67.06 | 7.92 | 0.64 | −8.42E−04 | 6.50E−04 | 1.92E−04 | |
| σ | 5 | 13.94 | 6.62 | 5.75 | 0.87 | 0.06 | 6.12E−05 | 7.26E−05 | 7.98E−05 | |
| DnaKTTh-NBD ADP IB | All | 26 | 117.43 | 81.50 | 68.30 | 8.46 | 0.57 | −1.03E−03 | 7.68E−04 | 2.65E−04 |
| <SV> | 22 | 154.49 | 87.39 | 69.54 | 9.34 | 0.65 | −9.72E−04 | 6.76E−04 | 2.97E−04 | |
| σ | 3 | 60.48 | 5.19 | 4.05 | 1.10 | 0.09 | 6.48E−05 | 7.00E−05 | 5.49E−05 | |
| DnaKTTh-NBD ADP IIA | All | 24 | 183.93 | 75.88 | 62.49 | 5.77 | 0.43 | −9.78E−04 | 6.48E−04 | 3.30E−04 |
| <SV> | 27 | 180.00 | 81.18 | 68.08 | 6.97 | 0.48 | −9.94E−04 | 7.64E−04 | 2.30E−04 | |
| σ | 4 | 11.63 | 3.39 | 5.92 | 0.78 | 0.06 | 4.18E−05 | 7.17E−05 | 6.13E−05 | |
| DnaKTTh-NBD ADP IIB | All | 34 | 165.13 | 89.56 | 49.80 | 8.04 | 0.53 | −1.06E−03 | 9.86E−04 | 7.54E−05 |
| <SV> | 30 | 156.91 | 83.62 | 48.41 | 8.11 | 0.61 | −8.48E−04 | 7.54E−04 | 9.37E−05 | |
| σ | 4 | 10.35 | 3.54 | 4.09 | 1.13 | 0.07 | 5.72E−05 | 7.79E−05 | 4.49E−05 | |
| DnaKTTh-NBD APO IA | All | 66 | 160.58 | 81.15 | 65.76 | 4.53 | 0.46 | −7.96E−04 | 6.45E−04 | 1.51 E−04 |
| <SV> | 41 | 160.52 | 81.02 | 66.12 | 4.31 | 0.44 | −8.06E−04 | 6.44E−04 | 1.62E−04 | |
| σ | 5 | 5.09 | 1.85 | 3.15 | 0.36 | 0.05 | 5.22E−05 | 7.22E−05 | 4.42E−05 | |
| DnaKTTh-NBD APO IB | All | 32 | 189.53 | 76.49 | 66.36 | 8.46 | 0.66 | −1.10E−03 | 6.17E−04 | 4.81E−04 |
| <SV> | 19 | 90.00 | 76.14 | 66.61 | 7.90 | 0.61 | −1.12E−03 | 6.85E−04 | 4.39E−04 | |
| σ | 3 | 69.98 | 4.31 | 3.00 | 1.04 | 0.08 | 9.78E−05 | 7.13E−05 | 1.01E−04 | |
| DnaKTTh-NBD APO IIA | All | 25 | 136.16 | 83.95 | 67.26 | 5.38 | 0.79 | −5.17E−04 | 3.60E−04 | 1.57E−04 |
| <SV> | 15 | 129.44 | 84.03 | 69.49 | 4.99 | 0.72 | −5.49E−04 | 4.03E−04 | 1.46E−04 | |
| σ | 3 | 36.32 | 22.91 | 20.36 | 0.61 | 0.08 | 9.11E−05 | 7.78E−05 | 4.76E−05 | |
| DnaKTTh-NBD APO IIB | All | 30 | 144.58 | 89.91 | 51.28 | 5.42 | 0.51 | −8.83E−04 | 6.93E−04 | 1.90E−04 |
| <SV> | 19 | 143.31 | 89.38 | 51.58 | 4.91 | 0.47 | −8.89E−04 | 7.34E−04 | 1.56E−04 | |
| σ | 3 | 8.92 | 3.18 | 4.37 | 0.60 | 0.07 | 7.23E−05 | 9.21 E−05 | 7.24E−05 | |
| DnaKTTh NBD_SBD ADP IA | All | 25 | 97.01 | 60.93 | 75.94 | 7.42 | 0.46 | −1.54E−03 | 9.82E−04 | 5.54E−04 |
| <SV> | 16 | 96.21 | 60.03 | 75.90 | 6.80 | 0.44 | −1.56E−03 | 1.03E−03 | 5.25E−04 | |
| σ | 2 | 15.98 | 4.21 | 5.44 | 1.00 | 0.08 | 1.20E−04 | 1.45E−04 | 8.41E−05 | |
| DnaKTTh NBD SBD ADP IB | All | 24 | 135.87 | 68.47 | 74.47 | 7.54 | 0.48 | −1.89E−03 | 1.25E−03 | 6.37E−04 |
| <SV> | 15 | 124.35 | 68.97 | 72.87 | 7.00 | 0.46 | −1.82E−03 | 1.21E−03 | 6.16E−04 | |
| σ | 2 | 43.09 | 2.72 | 5.04 | 1.04 | 0.09 | 1.32E−04 | 1.90E−04 | 1.28E−04 | |
| DnaKTTh NBD SBD ADP IIA | All | 31 | 97.27 | 74.12 | 75.60 | 7.08 | 0.38 | −1.54E−03 | 1.04E−03 | 5.04E−04 |
| <SV> | 20 | 96.51 | 75.09 | 73.69 | 6.54 | 0.37 | −1.52E−03 | 1.04E−03 | 4.79E−04 | |
| σ | 3 | 15.78 | 2.54 | 2.97 | 1.31 | 0.08 | 1.02E−04 | 1.16E−04 | 1.04E−04 | |
| DnaKTTh NBD SBD ADP IIB | All | 27 | 94.99 | 78.53 | 66.32 | 7.15 | 0.38 | −1.83E−03 | 1.37E−03 | 4.59E−04 |
| <SV> | 16 | 92.49 | 79.57 | 65.57 | 6.67 | 0.35 | −1.87E−03 | 1.38E−03 | 4.91E−04 | |
| σ | 2 | 9.36 | 3.74 | 2.25 | 0.96 | 0.05 | 8.54E−05 | 9.74E−05 | 1.21E−04 |
Number of RDCs used
Euler angles in the z-y-z convention
All RDCs used, best fit result
Average of self validation at the 60% level
Standard deviation of the self validation
If all subdomains were oriented identically as in the homology structure, which was based on the crystal structure of Hsc70-NBD, one would expect that the Euler angles needed to rotate these subdomains into their PAS would be same for all (within experimental accuracy). Table 3 shows that this is only (approximately) the case for DnaKTth-NBD in the AMPPNP state. Figure 14a displays this same information in a Samson Flamsteed projection, which gives the orientations of the Szz and Sxx orientational principal axes of the subdomains with respect to the model structure Cartesian frame (which is the frame of the PDB file of Hsc70). Here, the Szz axis for all subdomains of DnaKTth-NBD in the AMPPNP state all pierce the unit sphere around (15° N, 110 ° E) and (15 ° S, 70 ° W). The Sxx axes of the subdomains are relatively well-defined and pierce the unit sphere around (30 ° S, 20 ° E) and (30 ° N, 160 ° W). But they are not at identical positions. Fig.14b shows that the Szz axis of sub-domain IIB of DnaKTth-NBD in the ADP state is shifted by nearly 20 degrees from the axes of the other subdomains. The dark blue smears indicate that the Sxx orientation for domain IB cannot be obtained with any certainty. For the APO state, the Szz axis of domain IIB is also seen to deviate from that of the other three subdomains, but in a different sense than in the ADP state. Here the Sxx-axes cannot be determined with any certainty for subdomains IB and IIA. of For DnaKTth-NBD-SBD, the data is better, and Szz and Sxx axes can be defined for all sub domains. They all deviate significantly from the orientations in the model structure.
Figure 14.
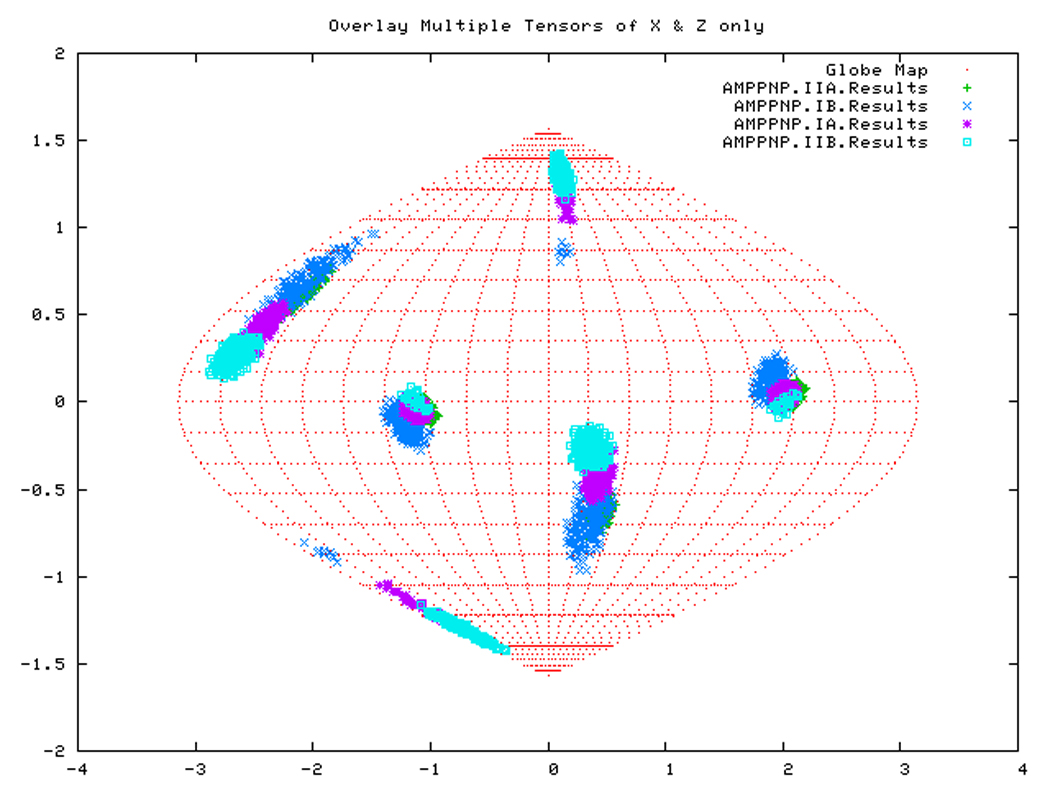
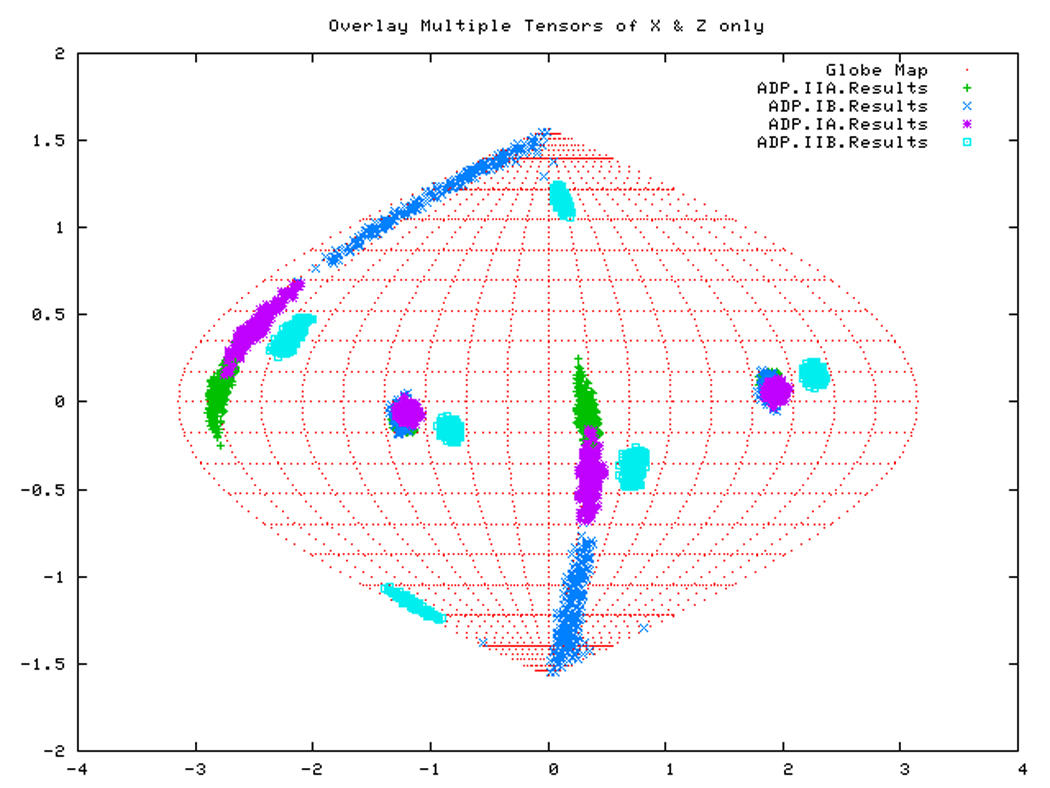
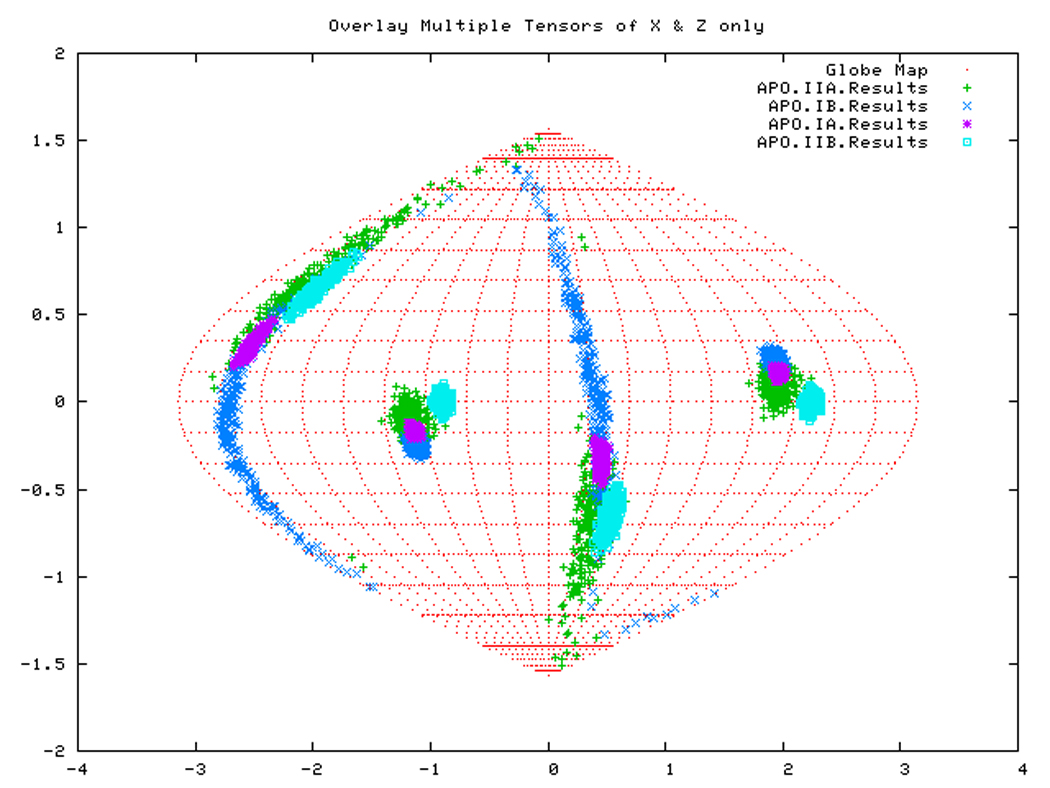
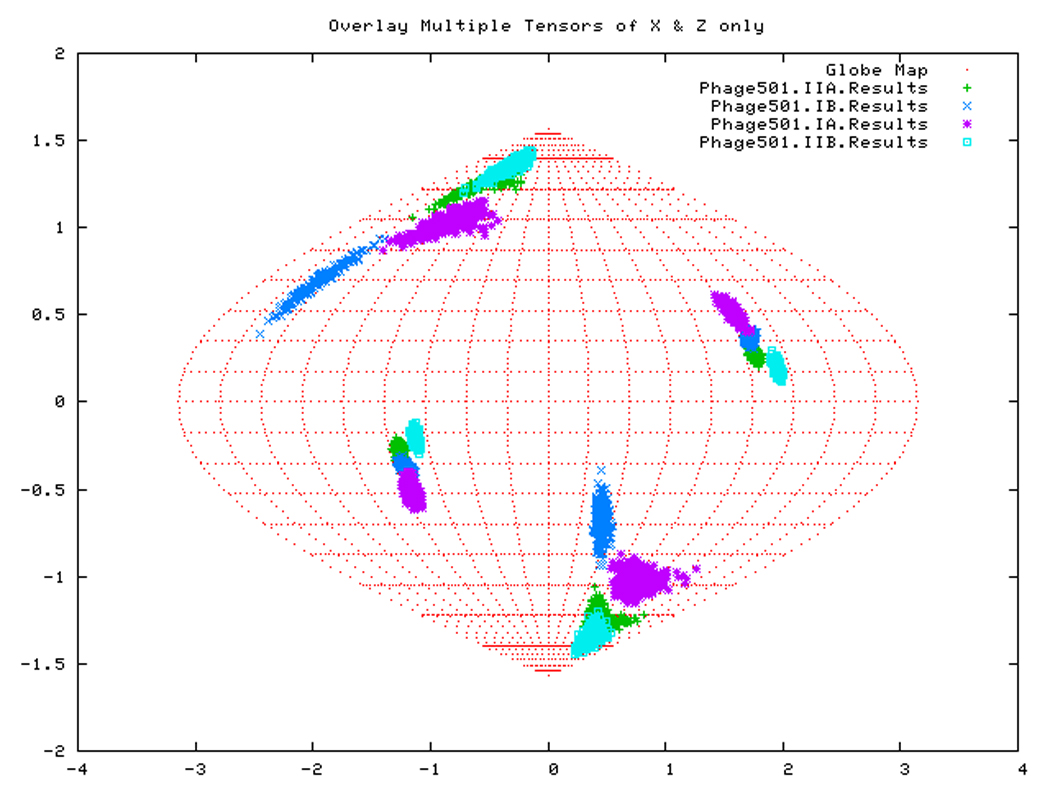
Figure. 14a: Sanson-Flamsteed projection for the AMPPNP form of DnaKTth-NBD
Figure. 14b: Sanson-Flamsteed projection for the ADP form of DnaKTth-NBD
Figure. 14c: Sanson-Flamsteed projection for the APO form of DnaKTth-NBD
Figure. 14d: Sanson-Flamsteed projection for the ADP form of DnaKTth-NBD-SBD
Statistical validation
In order to evaluate the statistical significance of the domain reorientations, we performed a ‘self validation analysis’ on our data. This consists of rejecting 40% of available RDCs at random generating truncated datasets. From an n element dataset an un-ordered combination of k elements can be created by C(k,n) ways. For example, for sub-domain IIB in the ADP state, we can create 1.26 × 10¹⁴ datasets by rejecting half of the data at random. In practice, 100 datasets are generated for each self-validation run. The best fit solutions for each of these 100 datasets is plotted as a point on the Sanson Flamsteed projection. The choice of a 40% rejection rate for this self-validation (also called Jack-knife) was discussed at length elsewhere [16].
From the self-validation study, our result appears to be quite robust (Fig.14): the clustering of all sub-domain alignments in the AMPPNP of DnaKTth-NBD and in DnaKTth-NBD-SBD is still visible at 60% data cutoff. The deviation of subdomain IIB in the ADP and APO states from the other subdomains also holds up to the Jack-knife test. However, no well-defined orientations were found for the Szz axes of subdomain IB in the ADP or APO form. The definition of the Sxx axes is problematic for all subdomains in all states, except for subdomain IIB.
From this data, we observe that only the AMPPNP bound state of the DnaKTth-NBD closely compares to the reference structure. This is surprising, since the reference structure is a homology model, which is based on the crystal structure of Hsc70 in the ADP state. In contrast, the orientations of domain IIb of DnaKTth-NBD in the ADP-bound state in solution deviates significantly from the crystal structure. These baffling results have been discussed extensively in our earlier work[16], which concluded that the Hsc70. ADP crystal structure is a closed-cleft structure, while in solution only the ATP-like state is in this closed form, with more degrees of freedom for the subdomain orientations in the ADP state. These findings have also been discussed in the context of the allosteric mechanism of the Hsp70 chaperones [16].
Here, we find that subdomain IIB is also oriented “away” in the APO state of the protein, but not quite the same as in the ADP state. This suggests an “ADP” like behavior for this state, which corresponds to the findings in biochemical studies [39]. However, the APO state has no functional significance, since the nucleotide binding cleft will almost always be occupied by ATP in vivo due to the high cellular concentration of that nucleotide.
The orientation of subdomain IIB in the DnaKTth-NBD-SBD construct in the ADP state, with no substrate bound, is only slightly offset from the other subdomains, and is intermediate between the open and closed form. This corresponds quite well with what one would expect[15; 40; 41] for this “mixed state”. Peptide binding is known to drive the NBD of the Hsp70’s to the ADP state, but lack of peptide stabilizes the ATP state. Hence, and ADP bound state without peptide is expected to be “intermediate”.
3D structural information
The primary RDC data only yields orientational information. The magnitudes of the alignment tensor also give information about the overall shape of the system under study. This can be exploited [42] when the data is of very high precision and / or when the system deviates very much from spherical shape. Neither is the case for the current data and molecules. Hence, in the current case we have only orientational information.
In an attempt to give a 3D impression of the conformational changes between the different states, we use the following procedure. Given the reorientation information (i.e., averaged Euler angles corresponding to Principal Axes frames) for each sub-domain, we rotate each sub-domain, for each nucleotide state, into its principal axis frame, which we call an ‘RDC Eigen structure’. A model for relative translational positions of these sub-domain Eigen structures for each nucleotide state in a full molecule was obtained as follows. First, the entire reference structure was rotated into PAS of the RDCs of subdomain IA for a particular nucleotide state. Subsequently, the ‘RDC Eigen structure’ of each sub-domain was superposed on the corresponding subdomains of the (rotated) reference structure using translational shifts only, using the Ca atom coordinates of the secondary structure elements in those subdomains.
Thus, in such a model structure, the RDC-determined orientations of the subdomains are retained, and their translational positions are roughly equal to the reference structure, which was based on experimental X-ray diffraction data. We have chosen to not further refine these models even though significant amount of atom clashes occur at the interfaces of the sub domains. Potentially one can do so, by running a Molecular Dynamics relaxation computation, in which the relative subdomain orientations are retained (e.g. by restraining an orientational parameter based on the Cα positions of the secondary structure elements).
The overall model structures for the different nucleotide states were oriented in the PAS of the RDCs of their subdomains IA. These orientations should be roughly the same, since the same alignment medium (10 mg/ mL phage) was used, but are not necessarily exactly the same, if conformational changes occur which affect the overall shape of the protein. However, for the AMPPNP, ADP and APO states of DnaKTth-NBD, the overall alignment is very similar, as a comparison of Fig 14a, b and c shows. This indicates that no large conformational changes, beyond the subdomain orientation changes, take place. This justifies our modeling protocol described above. It is to be expected that the overall orientation of the NBD in the DnaKTth-NBD-SBD construct is different (see Fig 14d): the overall hydrodynamical shape of the molecule is quite different from that of the isolated NBD because of the presence of the 10 kDa SBD.
In order to compare the different molecular molecules, we have to remove the overall orientational differences. This can be accomplished by a simple superposition of the entire molecules. In order to emphasize the differences in cleft openings, we have chosen to overlay the model structures on the Cα positions of subdomain IA only. The results of these exercises are shown in Fig 16 and 17. In Figure 16, left, one easily identifies that the orientation of domain IIB, at the right top, is very similar in the reference structure (green) and the AMPPNP state (blue) of DnaKTth-NBD. In the ADP (yellow) and APO (red) structure we find that IIB is rotated “outward” in a rather similar fashion, representing an open ATP binding cleft. The orientation of subdomain IIA (bottom right) of the AMPPNP state is most similar to the reference structure, while the ADP and APO forms deviate considerably, and differently from each other (also see Figure 16, at right).
Figure 16.
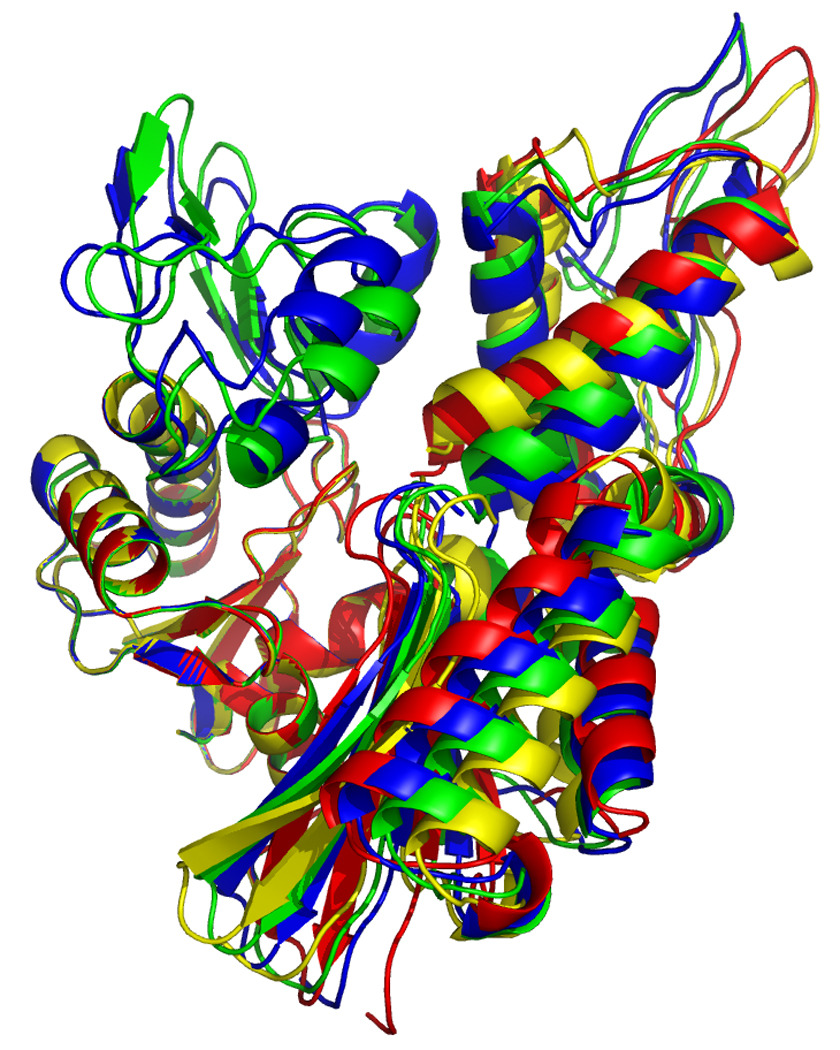
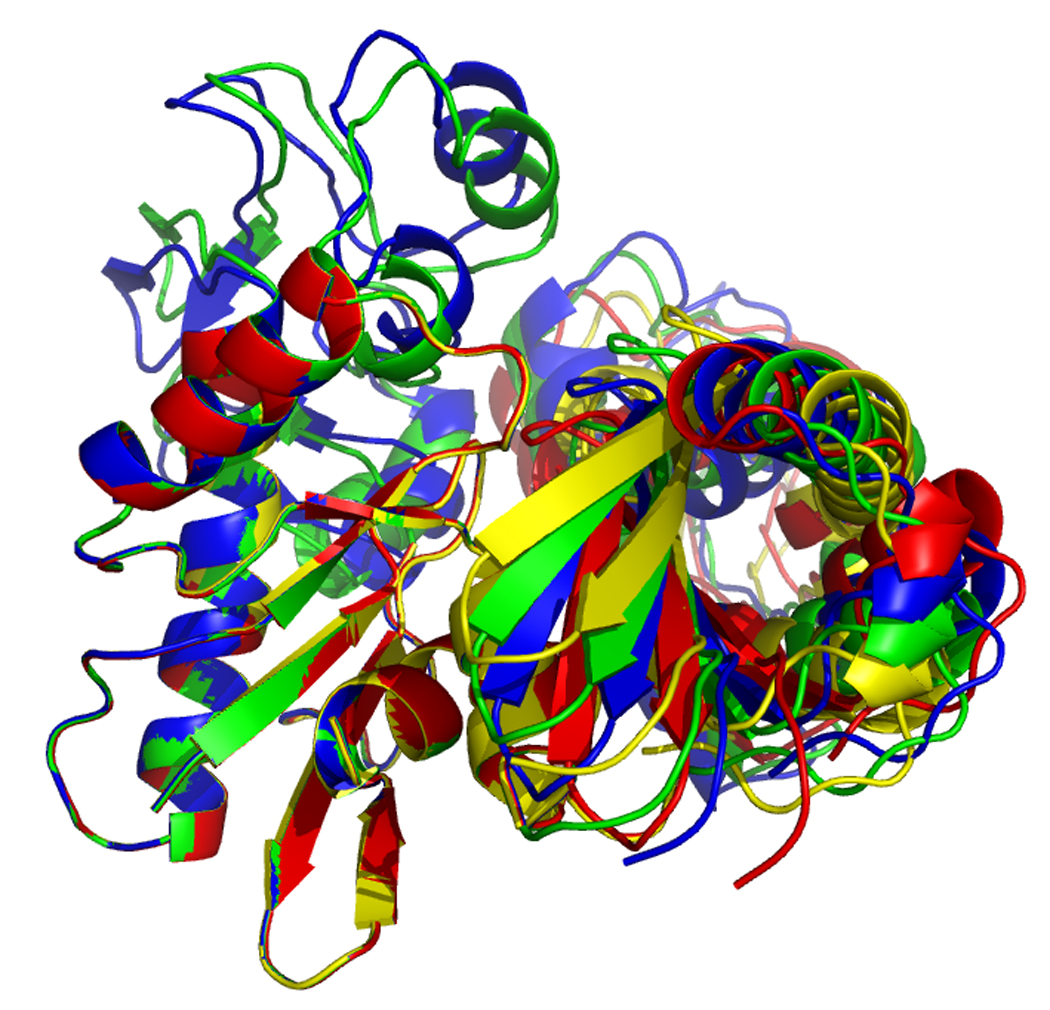
Overlays of RDC eigen structures using secondary structure of sub-domain IA as a reference.
DnaKTth-NBD AMPPMP - blue
DnaKTth-NBD ADP - yellow
DnaKTth-NBD APO – red
The reference structure based on the Hsc70 NBD crystal structure is in green.
The IB domains for the ADP and APO state are not shown.
Left, “standard” view, with IA at bottom left, IB at top left, IIA at bottom right and IIB at top right.
Right, “bottom” view, with IA at the left and IIA at the right.
Figure 17.
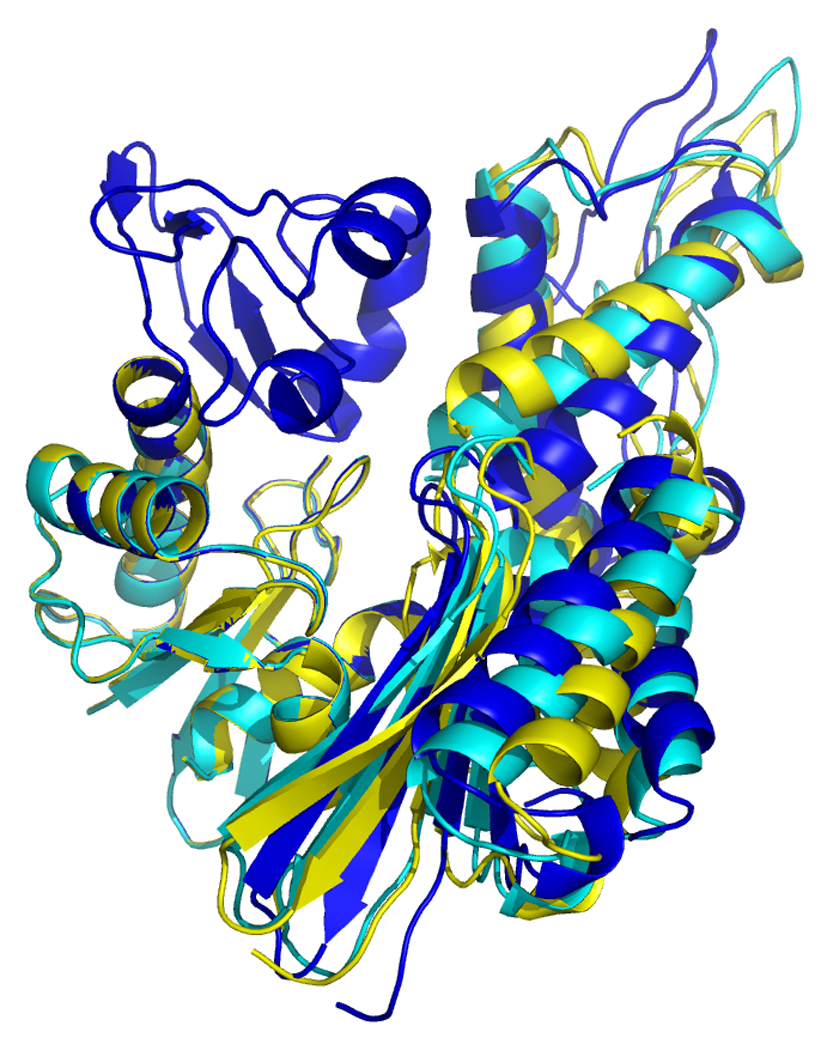
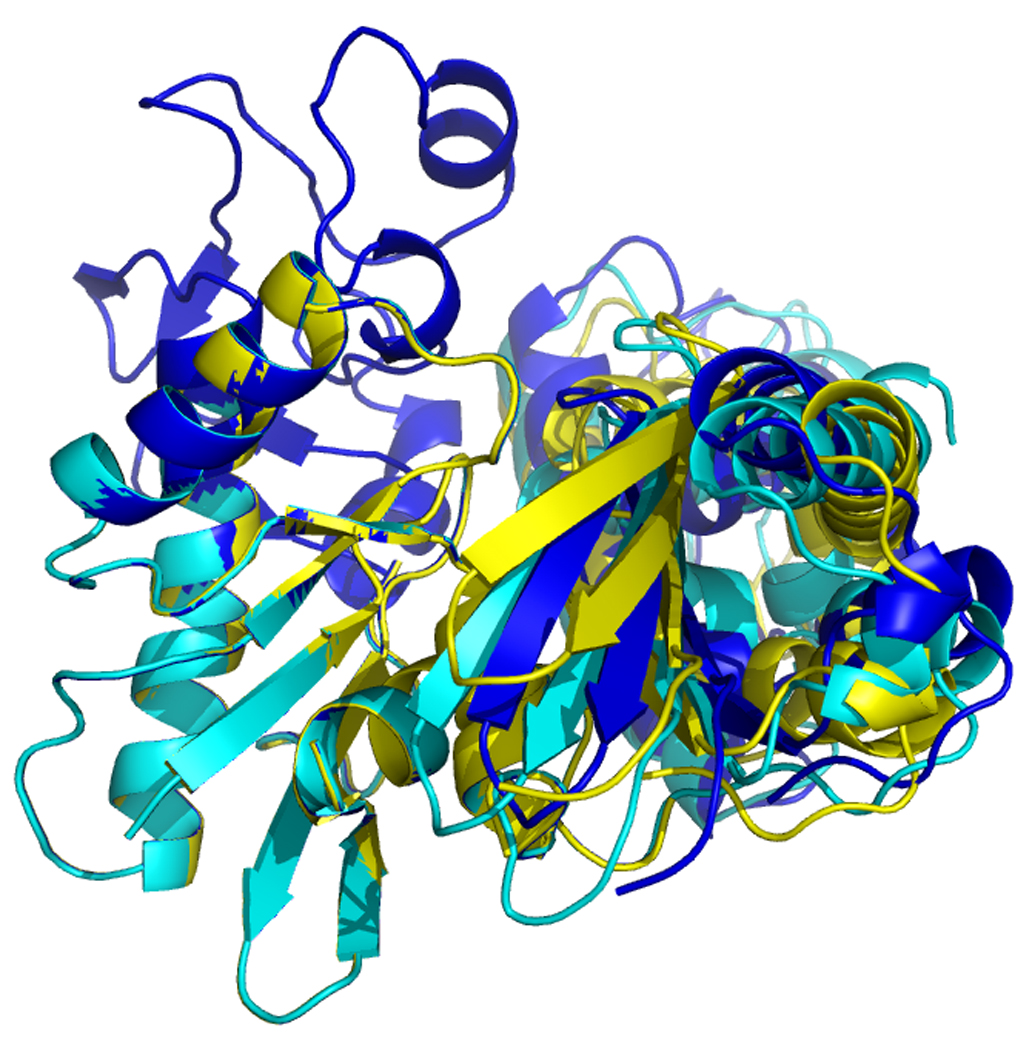
Overlays of RDC eigen structures using secondary structure of sub-domain IA as a reference.
DnaKTth-NBD AMPPMP - blue
DnaKTth-NBD ADP - yellow
DnaKTth-NBD-SBD ADP - cyan
The IB domains for the ADP and APO state and DnaKTth-NBD-SBD are not shown.
Left, “standard” view, with IA at bottom left, IB at top left, IIA at bottom right and IIB at top right.
Right, “bottom” view, with IA at the let and IIA at the right.
Figure 17, left, shows that the orientation of subdomain IIB of DnaK DnaKTth-NBD-SBD in the ADP – peptide-free state (cyan) is very similar to that of the ADP state (yellow). However, the orientation of subdomain IIA of DnaK DnaKTth-NBD-SBD is more similar to that of the AMPPNP state. This confirms the “mixed conformation” as expected for this state (see also above).
Conclusions
15N-1H RDC data can be obtained for relatively large proteins using the RDC-TROSY methodology. The simulations show that κ values should not be extended above 1.0. Simulations also show that this RDC measurement paradigm is superior to other methods (IP-AP and TROSY – HSQC comparisons) for almost all practical molecular weight classes on any practical NMR spectrometer. Our simulations show that amide proton flip-flops, caused by NOEs with nearby protons, quickly deteriorate the quality of the RDC-TROSY, and of TROSY in general. Hence perdeuteration of the protein, which suppresses such NOEs, will improve the quality of the RDC-TROSY, and TROSY in general, not only by improving the direct linewidths, but also by removal of “exchange broadening“ of the TROSY lines in the 15N dimension.
Despite the improvements afforded by the RDC-TROSY experimentation and perdeuteration, RDC data for large proteins are still noisy. Hence interpretation of this data requires very conservative jack-knife evaluations at the 40% rejection rate to establish statistical significance. We find, for noisy RDC data, that a computer algorithm based on a simple grid-search is more robust than an SVD-based analytical fit. Finally, we show that the combined approaches described herein can yield functionally important conformational information on larger proteins in the size range of 45 – 60 kDa (with rotational correlation times around 20 ns), using samples with ~ 300 uM protein concentration, and experimental times of less than a week, using a 800 MHz NMR instrument equipped with a cold (cryo) probe. In addition to studies described herein, we have also obtained usable RDC data with this method for ~200 uM wt-DnaK E. coli, a 70 kDa protein, measured at 27 °C[15].
Figure 3.
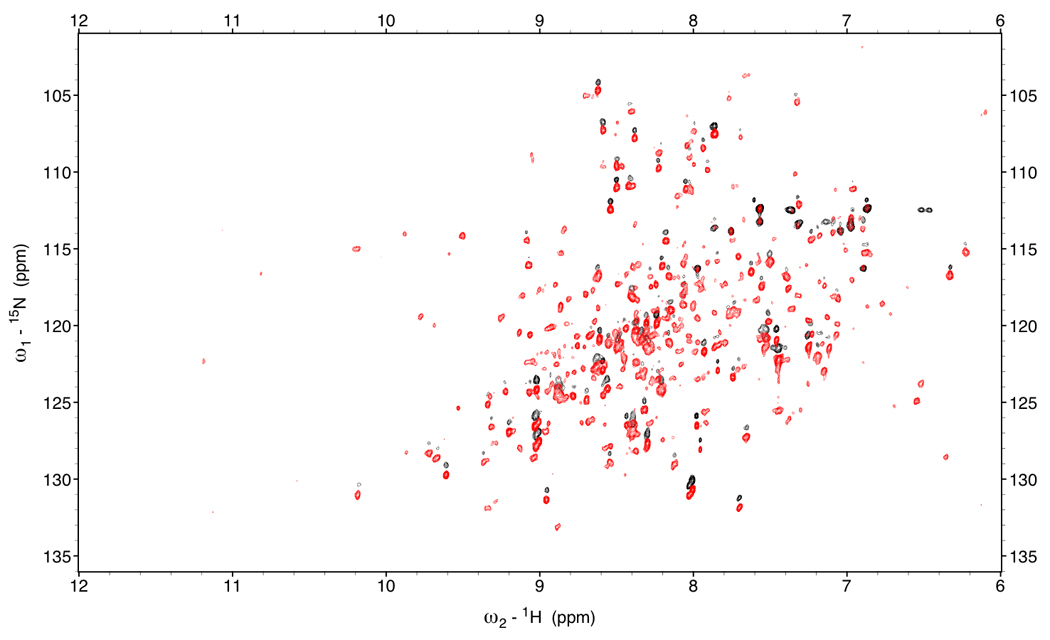
Red: TROSY spectrum of DnaKTth-NBD at 15 °C (τc=22ns).
Black: HSQC spectrum of DnaK-TTh NBD (shifted 45 Hz in the 1H dimension)
Figure 12.
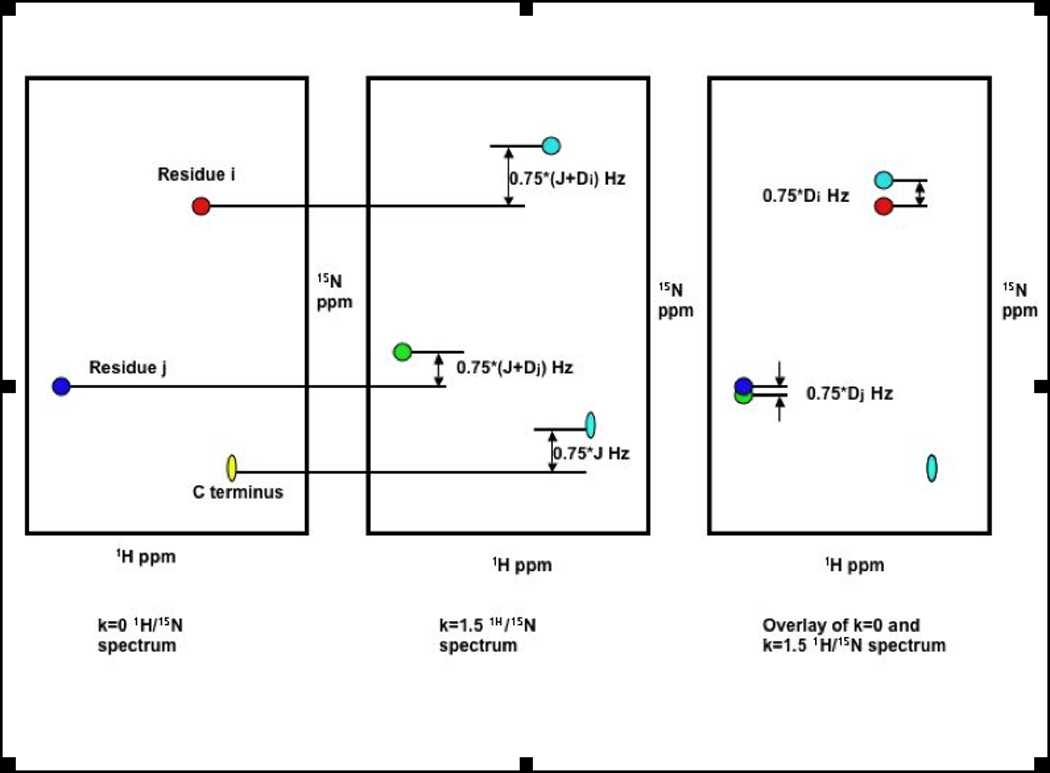
Shifting the spectra by κ/2* JNH Hz from different RDC-TROSY spectra to eliminate the scalar-coupling component (JNH) of the 15N shift. What remains is the RDC (DNH), scaled by a factor.
Figure 15.
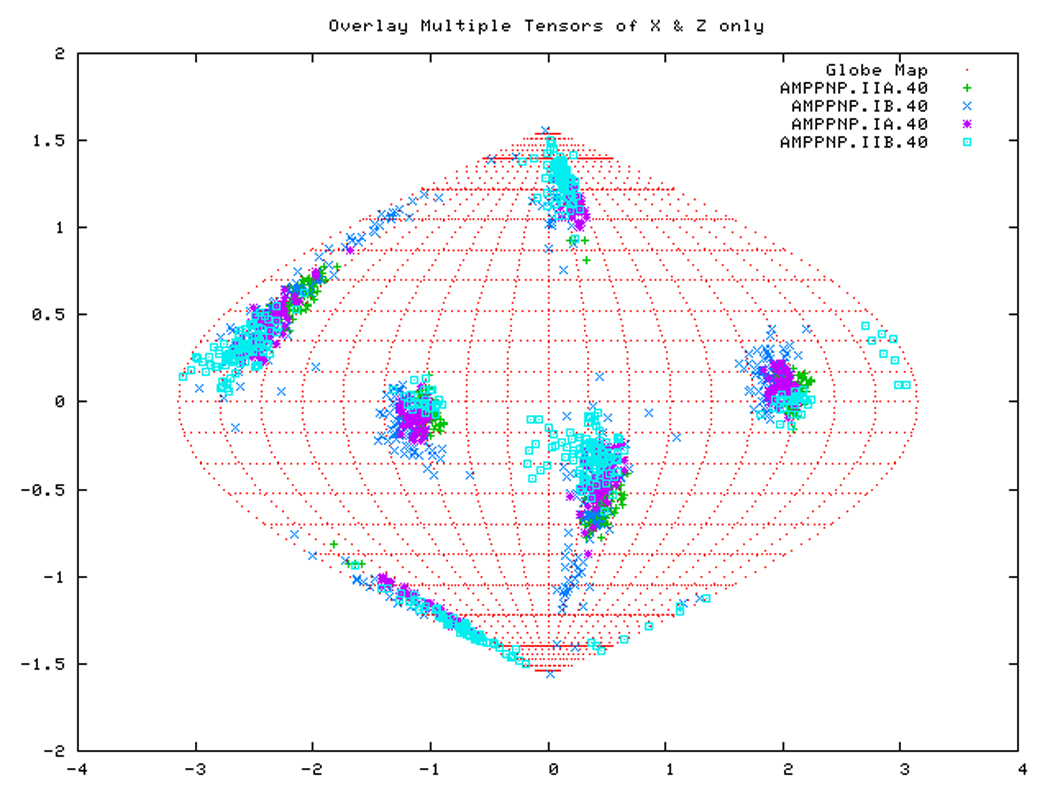
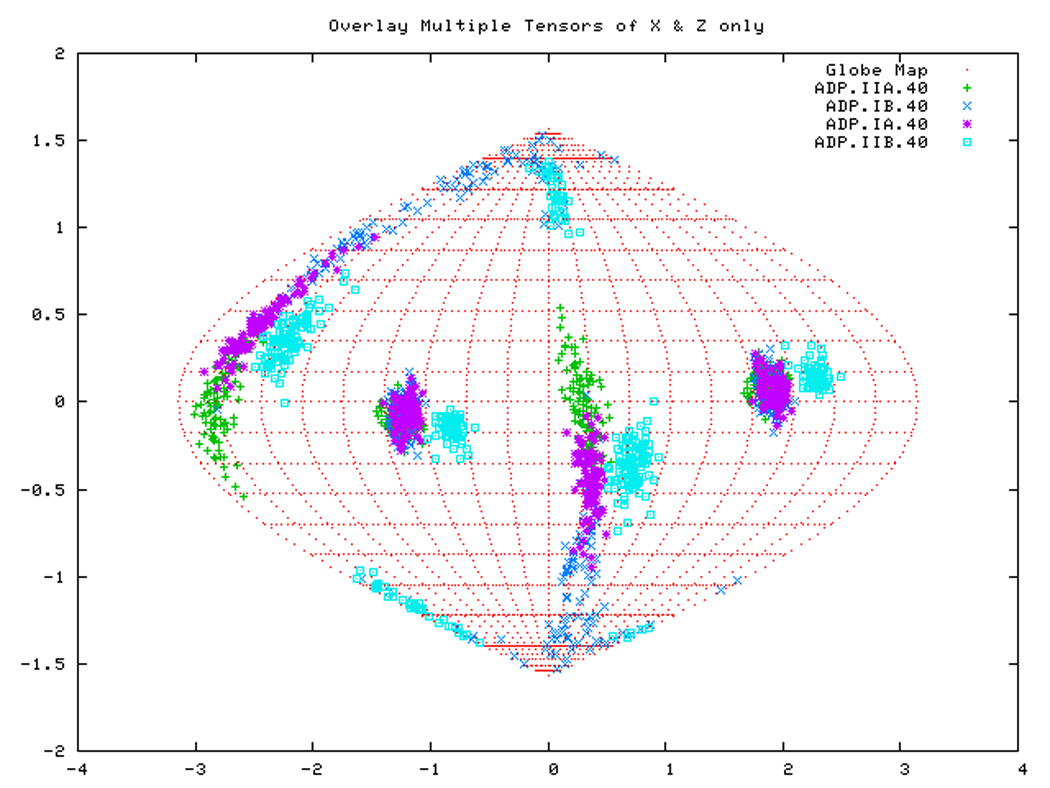
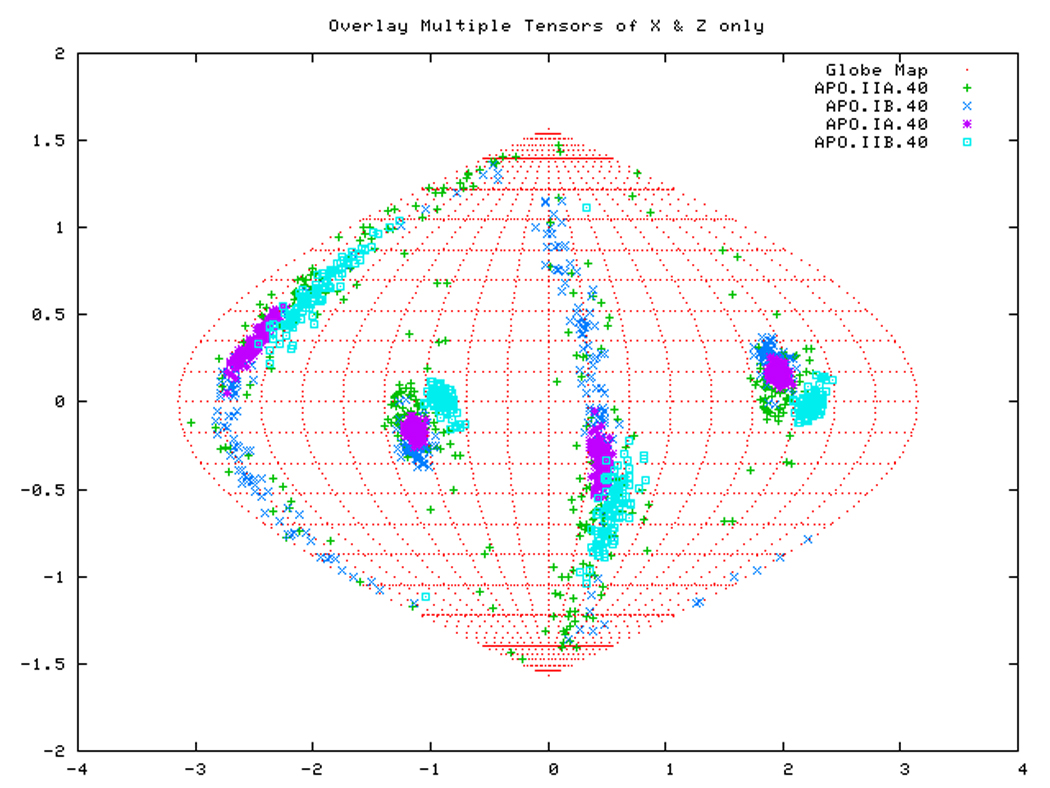
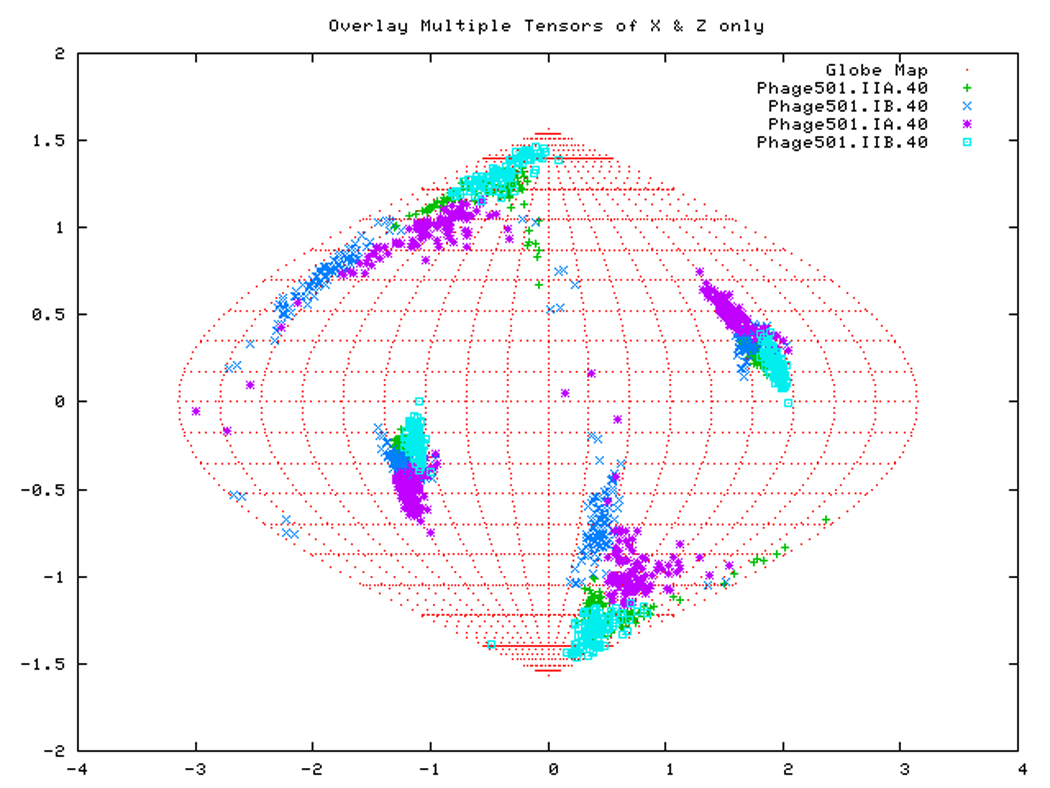
Figure. 15a: Sanson-Flamsteed self validation analysis results for the AMPPNP form of TTDnaK NBD with 40% RDCs rejected.
Figure. 15b: Sanson-Flamsteed self validation analysis results for the ADP form of TTDnaK NBD with 40% RDCs rejected.
Figure. 15c: Sanson-Flamsteed self validation analysis results for the APO form of TTDnaK NBD with 40% RDCs rejected.
Figure. 15d: Sanson-Flamsteed self validation analysis results for the Phage501 form of TTDnaK NBD with 40% RDCs rejected.
Acknowledgements
We thank Dr. Alexander V. Kurochkin, Dr. Daniel S. Weaver and former group members Dr. Yongbo Zhang, Dr. Grover N.B. Yip and Dr. Eric B. Bertelsen for discussions and earlier work in this area. This research was supported by NIH grants GM063027 and 3R01GM063027 08S1.
Footnotes
Publisher's Disclaimer: This is a PDF file of an unedited manuscript that has been accepted for publication. As a service to our customers we are providing this early version of the manuscript. The manuscript will undergo copyediting, typesetting, and review of the resulting proof before it is published in its final citable form. Please note that during the production process errors may be discovered which could affect the content, and all legal disclaimers that apply to the journal pertain.
REFERENCES
- 1.Yang D, Venters RA, Mueller GA, Choy WY, Kay LE. TROSY-based HNCO pulse sequences for the measurement of 1HN-15N, 15N-13CO, 1HN-13CO, 13CO-13C[agr] and 1HN-13C[agr] dipolar couplings in 15N, 13C, 2H-labeled proteins. J. Biomol. NMR. 1999;14:333–343. [Google Scholar]
- 2.Tjandra N, Bax A. Direct measurement of distances and angles in biomolecules by NMR in a dilute liquid crystalline medium. Science. 1997;278:1111–1114. doi: 10.1126/science.278.5340.1111. [DOI] [PubMed] [Google Scholar]
- 3.Tolman JR, Flanagan JM, Kennedy MA, Prestegard JH. Nuclear magnetic dipole interactions in field-oriented proteins: information for structure determination in solution. Proc. Natl. Acad. Sci. USA. 1995;92:9279–9283. doi: 10.1073/pnas.92.20.9279. [DOI] [PMC free article] [PubMed] [Google Scholar]
- 4.Fischer MW, Losonczi JA, Weaver JL, Prestegard JH. Domain orientation and dynamics in multidomain proteins from residual dipolar couplings. Biochemistry. 1999;38:9013–9022. doi: 10.1021/bi9905213. [DOI] [PubMed] [Google Scholar]
- 5.Tolman JR, Flanagan JM, Kennedy MA, Prestegard JH. NMR evidence for slow collective motions in cyanometmyoglobin. Nat. Struct. Biol. 1997;4:292–297. doi: 10.1038/nsb0497-292. [DOI] [PubMed] [Google Scholar]
- 6.Al-Hashimi HM, Gosser Y, Gorin A, Hu W, Majumdar A, Patel DJ. Concerted motions in HIV-1 TAR RNA may allow access to bound state conformations: RNA dynamics from NMR residual dipolar couplings. J Mol Biol. 2002;315:95–102. doi: 10.1006/jmbi.2001.5235. [DOI] [PubMed] [Google Scholar]
- 7.Tjandra N. Establishing a degree of order: obtaining high-resolution NMR structures from molecular alignment. Structure. 1999;7:R205–R211. doi: 10.1016/s0969-2126(99)80167-1. [DOI] [PubMed] [Google Scholar]
- 8.Ottiger M, Delaglio F, Bax A. Measurement of J and dipolar couplings from simplified two-dimensional NMR spectra. J. Magn. Reson. 1998;131:373–378. doi: 10.1006/jmre.1998.1361. [DOI] [PubMed] [Google Scholar]
- 9.Pervushin K, Riek R, Wider G, Wuthrich K. Attenuated T2 relaxation by mutual cancellation of dipole-dipole coupling and chemical shift anisotropy indicates an avenue to NMR structures of very large biological macromolecules in solution. Proc Natl Acad Sci U S A. 1997;94:12366–12371. doi: 10.1073/pnas.94.23.12366. [DOI] [PMC free article] [PubMed] [Google Scholar]
- 10.Lerche MH, Meissner A, Poulsen FM, Sorensen OW. Pulse sequences for measurement of one-bond (15)N-(1)H coupling constants in the protein backbone. J Magn Reson. 1999;140:259–263. doi: 10.1006/jmre.1999.1820. [DOI] [PubMed] [Google Scholar]
- 11.Lukin JA, Kontaxis G, Simplaceanu V, Yuan Y, Bax A, Ho C. Quaternary structure of hemoglobin in solution. Proc Natl Acad Sci U S A. 2003;100:517–520. doi: 10.1073/pnas.232715799. [DOI] [PMC free article] [PubMed] [Google Scholar]
- 12.Sheth A, Ravikumar M, Hosur R. Application of J scaling in two-dimensional spin-echo-correlated spectroscopy to observation of small coupling correlations. Journal or Magnetic Resonance. 1969;74:352–355. [Google Scholar]
- 13.Zhang Y, Zuiderweg ER. The 70-kDa heat shock protein chaperone nucleotide-binding domain in solution unveiled as a molecular machine that can reorient its functional subdomains. Proc Natl Acad Sci U S A. 2004;101:10272–10277. doi: 10.1073/pnas.0401313101. [DOI] [PMC free article] [PubMed] [Google Scholar]
- 14.Revington M, Zhang Y, Yip GN, Kurochkin AV, Zuiderweg ER. NMR investigations of allosteric processes in a two-domain Thermus thermophilus Hsp70 molecular chaperone. J Mol Biol. 2005;349:163–183. doi: 10.1016/j.jmb.2005.03.033. [DOI] [PubMed] [Google Scholar]
- 15.Bertelsen EB, Chang L, Gestwicki JE, Zuiderweg ER. Solution conformation of wild-type E. coli Hsp70 (DnaK) chaperone complexed with ADP and substrate. Proc Natl Acad Sci U S A. 2009;106:8471–8476. doi: 10.1073/pnas.0903503106. [DOI] [PMC free article] [PubMed] [Google Scholar]
- 16.Bhattacharya A, Kurochkin AV, Yip GN, Zhang Y, Bertelsen EB, Zuiderweg ER. Allostery in Hsp70 chaperones is transduced by subdomain rotations. J Mol Biol. 2009;388:475–490. doi: 10.1016/j.jmb.2009.01.062. [DOI] [PMC free article] [PubMed] [Google Scholar]
- 17.Weaver DS, Zuiderweg ER. Protein proton-proton dynamics from amide proton spin flip rates. J Biomol NMR. 2009;45:99–119. doi: 10.1007/s10858-009-9351-x. [DOI] [PubMed] [Google Scholar]
- 18.Mayer MP, Bukau B. Hsp70 chaperones: cellular functions and molecular mechanism. Cell Mol Life Sci. 2005;62:670–684. doi: 10.1007/s00018-004-4464-6. [DOI] [PMC free article] [PubMed] [Google Scholar]
- 19.Flaherty KM, Delucaflaherty C, McKay DB. 3-DIMENSIONAL STRUCTURE OF THE ATPASE FRAGMENT OF A 70K HEAT-SHOCK COGNATE PROTEIN. Nature. 1990;346:623–628. doi: 10.1038/346623a0. [DOI] [PubMed] [Google Scholar]
- 20.Flaherty KM, Deluca-Flaherty C, McKay DB. 3-Dimensional Structure of the ATPase Fragment of a 70k Heat-Shock Cognate Protein. Nature. 1990;346:623–628. doi: 10.1038/346623a0. [DOI] [PubMed] [Google Scholar]
- 21.O'Brien MC, Flaherty KM, McKay DB. Lysine 71 of the chaperone protein Hsc70 Is essential for ATP hydrolysis. J. Biol. Chem. 1996;271:15874–15878. doi: 10.1074/jbc.271.27.15874. [DOI] [PubMed] [Google Scholar]
- 22.O'Brien MC, McKay DB. Threonine 204 of the chaperone protein Hsc70 influences the structure of the active site, but is not essential for ATP hydrolysis. J. Biol. Chem. 1993;268:24323–24329. [PubMed] [Google Scholar]
- 23.O'Brien MC, McKay DB. How potassium affects the activity of the molecular chaperone Hsc70. I. Potassium is required for optimal ATPase activity. J. Biol. Chem. 1995;270:2247–2250. doi: 10.1074/jbc.270.5.2247. [DOI] [PubMed] [Google Scholar]
- 24.Sousa MC, McKay DB. The hydroxyl of threonine 13 of the bovine 70-kDa heat shock cognate protein is essential for transducing the ATP-induced conformational change. Biochemistry. 1998;37:15392–15399. doi: 10.1021/bi981510x. [DOI] [PubMed] [Google Scholar]
- 25.Wilbanks SM, McKay DB. How potassium affects the activity of the molecular chaperone Hsc70. II. Potassium binds specifically in the ATPase active site. J Biol Chem. 1995;270:2251–2257. doi: 10.1074/jbc.270.5.2251. [DOI] [PubMed] [Google Scholar]
- 26.Fischer MWF, Majumdar A, Zuiderweg ERP. Protein NMR relaxation: theory, applications and outlook. Prog. NMR Spectrosc. 1998;33:207–272. [Google Scholar]
- 27.Abragam A. The Principles of Nuclear Magnetism. Oxford: Clarenden Press; 1961. [Google Scholar]
- 28.Carrington A, MacLachlan A. Introduction to Magnetic Resonance with Applications to Chemistry and Chemical Physics. New York: Harper & Row; 1967. [Google Scholar]
- 29.Delaglio F, Grzesiek S, Vuister GW, Zhu G, Pfeifer J, Bax A. NMRPipe: a multidimensional spectral processing system based on UNIX pipes. J. Biomol. NMR. 1995;6:277–293. doi: 10.1007/BF00197809. [DOI] [PubMed] [Google Scholar]
- 30.Goddard TD, Kneller DG. SPARKY 3. San Francisco: University of California; 2000. [Google Scholar]
- 31.Revington M, Holder TM, Zuiderweg ER. NMR study of nucleotide-induced changes in the nucleotide binding domain of Thermus thermophilus Hsp70 chaperone DnaK: implications for the allosteric mechanism. J Biol Chem. 2004;279:33958–33967. doi: 10.1074/jbc.M313967200. [DOI] [PubMed] [Google Scholar]
- 32.Revington M, Zuiderweg ER. TROSY-driven NMR backbone assignments of the 381-residue nucleotide-binding domain of the Thermus Thermophilus DnaK molecular chaperone. J Biomol NMR. 2004;30:113–114. doi: 10.1023/B:JNMR.0000042961.48233.f9. [DOI] [PubMed] [Google Scholar]
- 33.Hansen AL, Al-Hashimi HM. Insight into the CSA tensors of nucleobase carbons in RNA polynucleotides from solution measurements of residual CSA: towards new long-range orientational constraints. J Magn Reson. 2006;179:299–307. doi: 10.1016/j.jmr.2005.12.012. [DOI] [PubMed] [Google Scholar]
- 34.Valafar H, Prestegard JH. REDCAT: a residual dipolar coupling analysis tool. J Magn Reson. 2004;167:228–241. doi: 10.1016/j.jmr.2003.12.012. [DOI] [PubMed] [Google Scholar]
- 35.Losonczi JA, Andrec M, Fischer MW, Prestegard JH. Order matrix analysis of residual dipolar couplings using singular value decomposition. J. Magn. Reson. 1999;138:334–342. doi: 10.1006/jmre.1999.1754. [DOI] [PubMed] [Google Scholar]
- 36.Sondermann H, Scheufler C, Schneider C, Hohfeld J, Hartl FU, Moarefi I. Structure of a Bag/Hsc70 complex: convergent functional evolution of Hsp70 nucleotide exchange factors. Science. 2001;291:1553–1557. doi: 10.1126/science.1057268. [DOI] [PubMed] [Google Scholar]
- 37.Harrison CJ, Hayer-Hartl M, Di Liberto M, Hartl F, Kuriyan J. Crystal structure of the nucleotide exchange factor GrpE bound to the ATPase domain of the molecular chaperone DnaK. Science. 1997;276:431–435. doi: 10.1126/science.276.5311.431. [DOI] [PubMed] [Google Scholar]
- 38.McLellan CA, Raynes DA, Guerriero V. HspBP1, an Hsp70 cochaperone, has two structural domains and is capable of altering the conformation of the Hsp70 ATPase domain. J Biol Chem. 2003;278:19017–19022. doi: 10.1074/jbc.M301109200. [DOI] [PubMed] [Google Scholar]
- 39.McCarty JS, Buchberger A, Reinstein J, Bukau B. The role of ATP in the functional cycle of the DnaK chaperone system. J. Mol. Biol. 1995;249:126–137. doi: 10.1006/jmbi.1995.0284. [DOI] [PubMed] [Google Scholar]
- 40.Rist W, Graf C, Bukau B, Mayer MP. Amide hydrogen exchange reveals conformational changes in hsp70 chaperones important for allosteric regulation. J Biol Chem. 2006;281:16493–16501. doi: 10.1074/jbc.M600847200. [DOI] [PubMed] [Google Scholar]
- 41.Swain JF, Dinler G, Sivendran R, Montgomery DL, Stotz M, Gierasch LM. Hsp70 chaperone ligands control domain association via an allosteric mechanism mediated by the interdomain linker. Mol Cell. 2007;26:27–39. doi: 10.1016/j.molcel.2007.02.020. [DOI] [PMC free article] [PubMed] [Google Scholar]
- 42.Zweckstetter M, Hummer G, Bax A. Prediction of charge-induced molecular alignment of biomolecules dissolved in dilute liquid-crystalline phases. Biophys J. 2004;86:3444–3460. doi: 10.1529/biophysj.103.035790. [DOI] [PMC free article] [PubMed] [Google Scholar]
- 43.Schulte-Herbruggen T, Sorensen OW. Clean TROSY: compensation for relaxation-induced artifacts. J Magn Reson. 2000;144:123–128. doi: 10.1006/jmre.2000.2020. [DOI] [PubMed] [Google Scholar]


