Abstract
PURPOSE
To better understand the effects of retinitis pigmentosa (RP) on post-receptor anatomy, the thicknesses of the receptor, inner nuclear, retinal ganglion cell (RGC), and retinal nerve fiber layers (RNFL) were measured with frequency-domain optical coherence tomography (fdOCT).
METHODS
FdOCT scans were obtained from the horizontal midline in 30 patients with RP and 23 control subjects of comparable age. Raw images were exported and the thicknesses of photoreceptor/RPE, inner nuclear, RGC plus inner plexiform, and nerve fiber layers were measured with a manual segmentation procedure aided by a computer program. The RNFL thickness was also measured in 20 controls and 25 patients using circular peripapillary fdOCT scans.
RESULTS
Results from controls were consistent with known anatomy. In patients with RP, the pattern of photoreceptor loss with eccentricity was consistent with the field constriction characteristic of RP. INL and RGC layer measures were comparable to normal subjects, although some patients showed slightly thicker RGC layers. However, RNFL layer thickness was significantly greater than normal; a majority of patients showed a thicker RFNL on both horizontal midline scans and peripapillary scans.
CONCLUSIONS
To make optimal use of OCT RNFL thickness as a measure of the integrity of RGCs in patients with RP, a better understanding of the causes of the thickening seen in the majority of the patients is needed. As the RGC layer thickness can be measured with fdOCT, RGC layer thickness may turn out to be a more direct and valid indicator of the presence of RGCs in patients with RP.
Retinitis pigmentosa (RP) primarily affects the photoreceptor/pigment epithelial complex. One approach to prosthetically-aided vision for patients with RP involves electrical stimulation of the retinal ganglion cells (RGCs).1,2 Another approach to improve vision seeks to restore the function of the photoreceptors.3,4 For both approaches, the integrity of post-receptor cells, that is, the cells of the inner nuclear and RGC layers, is critical. Thus, it is important to determine the conditions under which post-receptor cells are present in individual patients with RP.
Morphometric analysis of postmortem eyes from patients with RP show that while the cells of the inner nuclear and RGC layers are decreased in number, a large number of cells remain. 5–7 However, as therapeutic interventions become viable, it will be important to assess the integrity of the post-receptor layers in vivo. With a relatively new noninvasive technique, time-domain optical coherence tomography (tdOCT), in vivo measurement of the retinal nerve fiber layer (RNFL) thickness can now be made.8,9
Using tdOCT technology, Walia et al.10 measured peripapillary RNFL thickness in patients with RP. Consistent with the histologic evidence, they reported that 40% of the RP patients studied showed peripapillary RNLF thickness measurements that were thinner than that of normal controls. However, in a subsequent study employing a newer technology, frequency domain (fd)OCT, Walia and Fishman11 concluded that RNLF thickness in RP could be either increased or decreased relative to normal controls. In addition, while one recent tdOCT study reported a significant thickening in a group of 11 patients with RP (Bass et al. IOVS 2008;49:ARVO E-Abstract 906), another reported12 an average thickness that was similar to control values. In addition to resolving these differences in RNFL findings, it is important to measure the post-receptor cellular layers of the retina in patients with RP.
It is now possible to measure individual retinal cellular layers with the newer fdOCT technology, which has greater spatial resolution than tdOCT. For example, recently Lim et al.13 measured the thickness of the inner retinal (i.e., RGC, RNFL, and inner plexiform) and outer retinal (i.e., inner nuclear, outer plexiform, and receptor) layers in patients with retinal dystrophy, and reported that patients with retinal dystrophy had small decreases in the inner layers, as opposed to large decreases in the outer retinal layers.
To better understand the effects of RP on post-receptor anatomy, we used fdOCT to measure the thickness of the receptor, inner nuclear, and RGC layers, as well as RNFL, along the horizontal meridian in patients with RP and in normal controls. In addition, to compare our results to previous work, the peripapillary RNFL thickness was also measured.
METHODS
Subjects
The OCT scans from one eye of 23 controls with normal healthy vision and 30 patients with RP were analyzed. All subjects were tested at the Retina Foundation of the Southwest. The tenets of the Declaration of Helsinki were followed and all subjects gave written informed consent after a full explanation of the procedures. Consent procedures were approved by the Institutional Review Board of UT Southwestern Medical Center.
The controls, 37.6 ± 15.0 (mean ± SD) years of age (range, 11–65 years), had visual acuities of 20/20 or better and normal eye exams. The patients, 33.1 ± 15.9 years of age (range, 11–65 years), were diagnosed as RP or Usher syndrome by ophthalmologists specializing in retinal disease. Patients were excluded if they had a corrected visual acuity worse than 20/80, a refractive error greater than ± 6.0 diopters spherical or ± 2.0 diopters cylindrical, evidence of macular cysts, or a history of other ocular diseases (e.g., glaucoma). One patient had strabismus. None of the patients showed evidence of optic nerve head drusen. Clinical characteristics, including best-corrected visual acuity, appearance of nerve and full-field ERG amplitudes are shown in Table 1. Based on family history, the 30 patients were classified as autosomal dominant (adRP, n = 1), X-linked (XlRP, n = 14), autosomal recessive (arRP, n = 3), isolate (n = 10) and Usher (n = 2).
TABLE 1.
Patient Data
| Patient ID |
Sex | Age | Eye | Diagnosis | Disc Pallor* | VA† | Rod Amp‡ | Cone Amp§ |
|---|---|---|---|---|---|---|---|---|
| 7752 | F | 37 | OD | Isolate | Typical | 1 | 2.9 | 2.9 |
| 1579 | M | 28 | OD | XIRP | Typical | 0.67 | 21.5 | 12.1 |
| 8542 | M | 22 | OS | X-linked | Typical | 0.33 | 0 | 1.4 |
| 7989 | F | 59 | OS | adRP | Typical | 1.27 | 0 | 0.7 |
| 7658 | M | 20 | OD | XIRP | None | 1.27 | 16.8 | 22.3 |
| 5397 | M | 57 | OS | arRP | Typical | 0.63 | 0 | 0.4 |
| 6200 | F | 54 | OD | Isolate | Typical | 1.27 | 61.4 | 28.4 |
| 8553 | M | 17 | OD | XIRP | Typical | 0.8 | 31.4 | 25.6 |
| 7729 | M | 16 | OD | XIRP | Typical | 0.63 | 3.1 | 5.7 |
| 8280 | M | 25 | OD | XIRP | Typical | 1 | 0 | 4.3 |
| 8054 | F | 18 | OD | Isolate | Typical | 0.63 | 4.2 | 3.5 |
| 8620 | F | 57 | OD | Isolate | None | 0.33 | 1.9 | 8.1 |
| 8532 | M | 24 | OS | XIRP | Typical | 0.5 | 0 | 5.1 |
| 7715 | M | 11 | OD | XIRP | Typical | 0.63 | 0 | 3.8 |
| 5445 | M | 30 | OS | arRP | Typical | 0.66 | 1.32 | 9.2 |
| 7685 | M | 33 | OS | XIRP | Typical | 0.32 | 2.3 | 11.1 |
| 8601 | M | 34 | OS | Isolate | None | 0.5 | 0 | 1.2 |
| 8621 | M | 53 | OS | Isolate | None | 0.63 | 18.7 | 35 |
| 8623 | F | 65 | OS | Isolate | Severe | 0.4 | 0 | 1.2 |
| 7669 | M | 12 | OS | XIRP | Typical | 1.27 | 2.5 | 4.7 |
| 7556 | M | 49 | OS | Isolate | None | 1.27 | 33 | 22.5 |
| 2692 | F | 27 | OD | arRP | None | 0.8 | 45.2 | 11.5 |
| 3564 | F | 33 | OD | Usher I | Typical | 0.5 | 0 | 6.5 |
| 416 | M | 48 | OS | Usher II | Typical | 0.8 | 1.64 | 1.37 |
| 5229 | M | 30 | OD | Isolate | None | 0.66 | 0 | 10.9 |
| 8085 | M | 31 | OD | XIRP | Typical | 0.8 | 0 | 0.4 |
| 8109 | M | 28 | OD | XIRP | Typical | 1 | 2.9 | 12.3 |
| 8704 | M | 47 | OS | Isolate | None | 0.25 | 0 | 0.8 |
| 7768 | M | 12 | OS | XIRP | Typical | 0.63 | 12 | 9.2 |
| 7767 | M | 17 | OD | XIRP | Typical | 0.4 | 0 | 2 |
Disc pallor rated as either none, typical pallor seen in RP patients and severe.
Visual acuity on MAR scale.
Amplitude (mm) of rod ERG to full-field stimulus.
Amplitude (mm) of cone ERG to full-field stimulus.
Frequency-Domain OCT
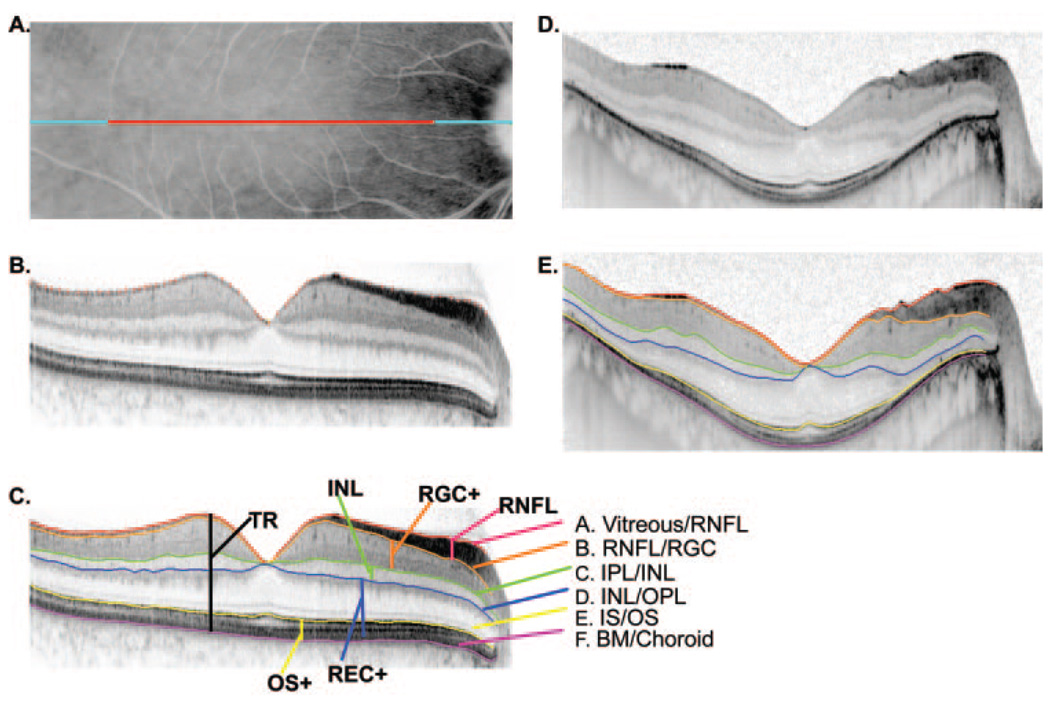
All individuals were scanned with a fdOCT (Spectralis HRA+OCT; Heidelberg Engineering, Vista, CA) using the eye-tracking feature (ART). We segmented a scan along the horizontal meridian chosen from among the scans for each individual. Each individual had one or more horizontal scans through the midline as either a 9-mm line scan (light blue line in Fig. 1A), a 6-mm line scan as part of the radial scan (red line in Fig. 1A), and/or a 6-mm scan as part of a macular volume scan. The line scans were the average of 100 scans, while the volume scan was the average of 12. If more than one scan was available, the scan with the highest quality was chosen. The segmentation data are shown only for 6 mm (±3 mm from foveal center) for all individuals regardless of the scan length (see Fig. 3, Fig. 4, Fig. 5, and Fig. 6). This ensures that the same regions are compared for all individuals and that the region close to the optic disc is not included.
FIGURE 1.
(A) Fundus view showing the extent of the 9 mm (blue) and 6 mm (red) single scan lines. (B) A line scan for a normal control showing the markers placed for the vitreous/RNFL border. (C) The same scan as in (B) with the boundaries drawn by the program based on markings such as in (B). (D) Same as in (B), but for a patient with RP. (E) Same as in (C) but for a patient with RP.
FIGURE 3.
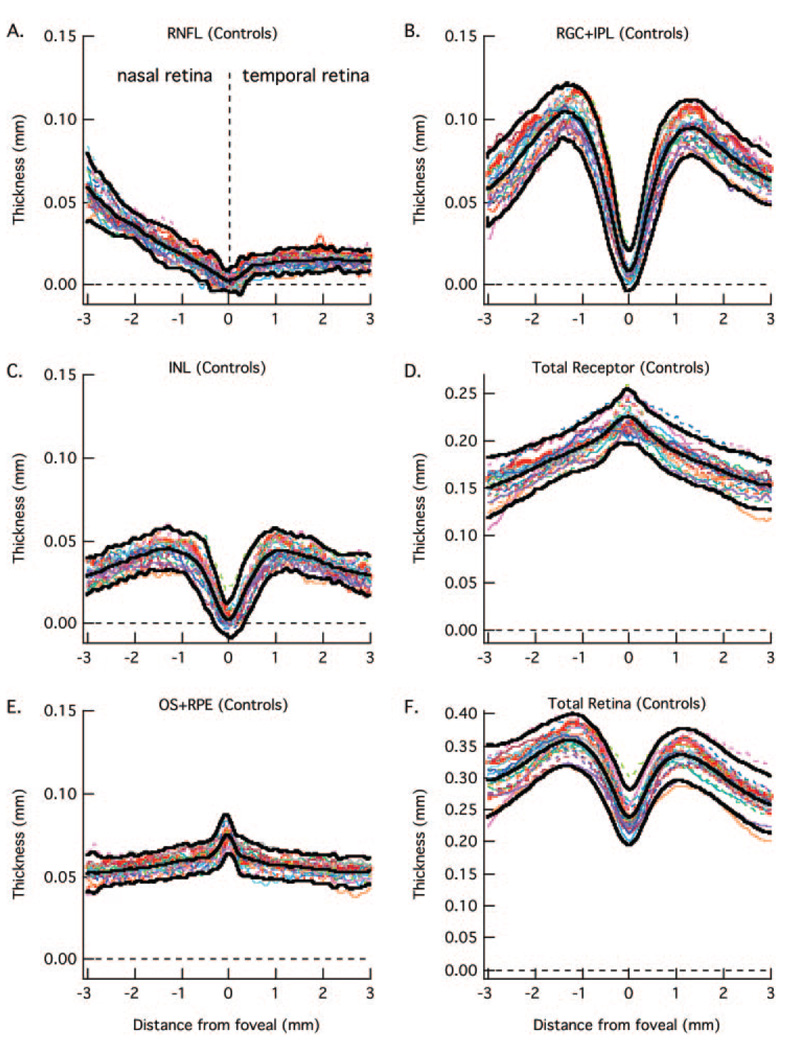
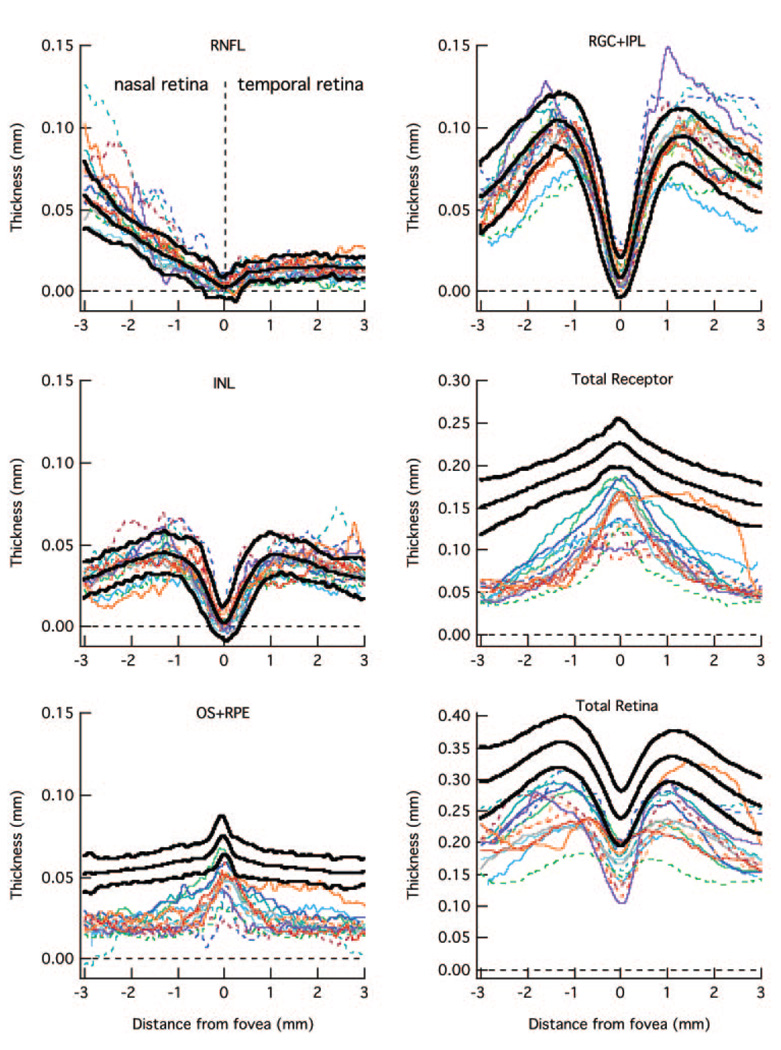
The RNFL (A), RGC+ (B), INL (C), total receptor + (D), OS+ (E), and total retina (F) thickness curves are shown for 23 normal controls (colored lines). The bold lines are the mean ± 2 SD.
FIGURE 4.
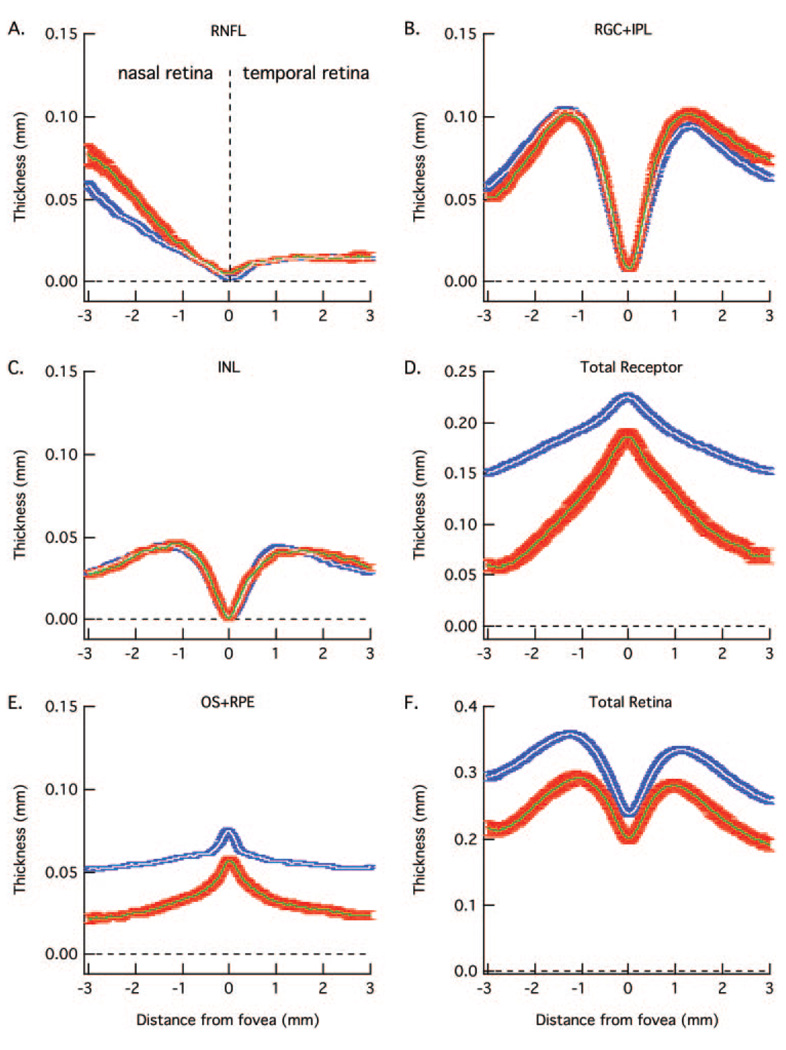
The white and blue curves are the mean ± 1 SE for the 23 normal controls in Figure 3 and the green and red curves are the mean ± 1 SE for the 30 patients in Figure 5 and Figure 6. As in Figure 3, RNFL (A), RGC+ (B), INL (C), total receptor + (D), OS+ (E), and total retina (F) thickness curves are shown in separate panels.
FIGURE 5.
The RNFL (A), RGC+ (B), INL (C), total receptor + (D), OS+ (E), and total retina (F) thickness curves are for 15 patients (colored lines) with the smallest loss in receptor thickness (D) in the center fovea. The bold lines are the mean ± 2 SD for the controls from Figure 3.
FIGURE 6.
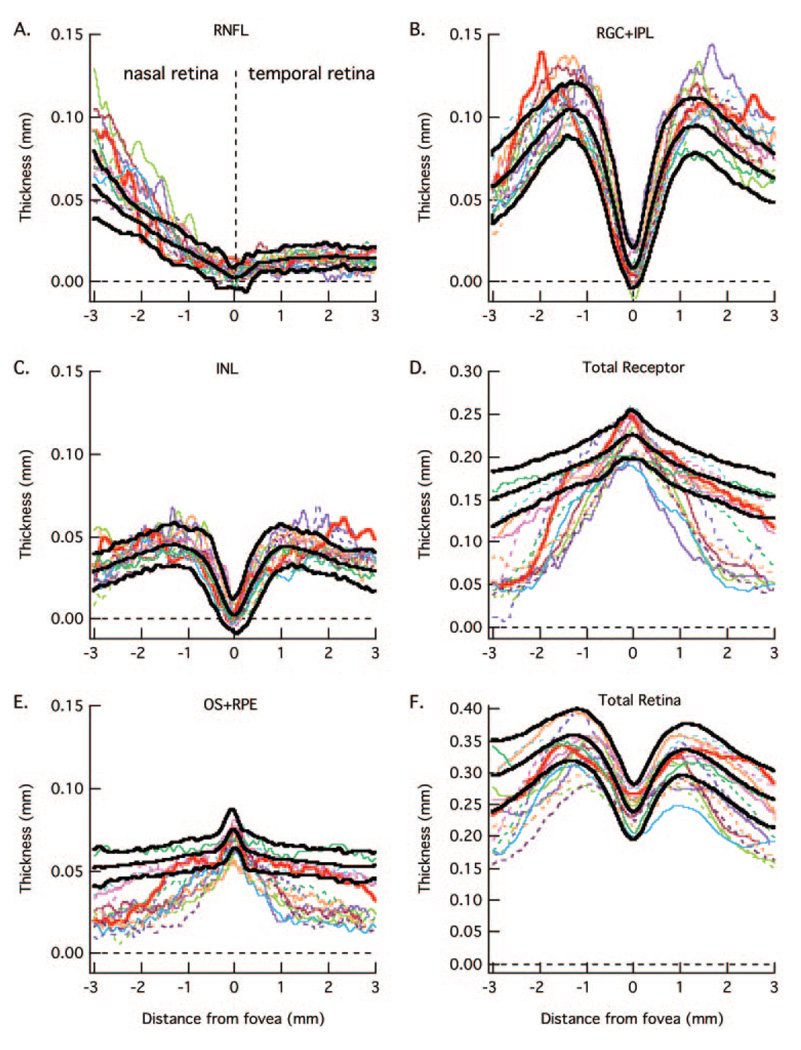
The RNFL (A), RGC+ (B), INL (C), total receptor + (D), OS+ (E), and total retina (F) thickness curves are for 15 patients (colored lines) with the largest loss in receptor thickness (D) in the center fovea. The bold lines are the mean ± 2 SD for the controls from Figure 3.
In addition, 20 of the controls and 25 of the patients had peripapillary circle scans with the standard 3.4 mm diameter.
Segmentation Procedure
The raw scan data were exported from the machine in the .vol format used by Heidelberg, although one can segment the layers nearly as well using .tif or .jpeg formats. Segmentation of retinal layers was done by hand (aided by a program written in MATLAB, v7.4; The Mathworks Inc., Natick, MA). The operator “clicked” on points along the boundary of interest. This is illustrated by the “plus” symbols in Figure 1B for the vitreous/RNFL (inner limiting membrane) border. The program drew a line through these points using a spline algorithm (MATLAB; The Mathworks Inc.). Two experienced individuals segmented each scan. After a training period in which two individuals discussed the boundaries of a sample set of scans with the senior author, they independently marked the boundaries of the layers. There was good agreement between the two measurements. The mean (range) of the concordance correlation coefficients for the 2 layers of interest here were RNFL: 0.95 (0.90 to 0.98) and RGC+: 0.96 (0.92 to 0.99) for the controls, and RNFL: 0.96 (range: 0.84 to 1.00, with all but one ≥0.89) and RGC+: 0.95 (range: 0.76 to 0.99, with all but one ≥0.86) for the patients. The results of the two graders were averaged.
Segmentation of Retinal Layers
Six boundaries, labeled A through F in Figure 1C, were identified and labeled as follows: A. Vitreous/RNFL, the inner limiting membrane (i.e., the boundary between the vitreous and the RNFL). B. RNFL/RGC, the boundary between the RNFL and the retinal ganglion cell (RGC) layer. C. IPL/INL, the boundary between the inner plexiform layer (IPL) and the inner nuclear layer (INL). D. INL/OPL, the border between the INL and the outer plexiform layer (OPL). E. IS/OS, the border between the inner segment (IS) and outer segment (OS) of the receptors. F. BM/choroid, the boundary between Bruch’s membrane (BM) and the choroid.
Using the locations of these 6 boundaries, we defined 6 retinal regions/layers:
TR thickness is the distance between A and F.
RNFL thickness is the distance between A and B.
Retinal ganglion cell plus IPL thickness (RGC+) is the distance between B and C. In some, but not all scans, the GC layer can be distinguished from the IPL. Because these layers could not be distinguished on all scans, we measured the thickness of the combined GC and inner plexiform layers.
INL thickness is the distance between C and D.
Total receptor (REC+) is the distance between D and F. For the proximal (closest to vitreous) border of the receptors, we chose the proximal border of the OPL, rather than the distal border of the OPL, as the proximal border was clearer and less variable across individuals. Second, for the distal edge of the receptor outer segment layer, we chose BM/choroid as it was easy to determine on all individuals, compared with the apical border of the RPE. As these choices will add some thickness to our measurements beyond that expected from anatomic measures of outer segment length, we call this layer “receptor+” or REC+.
Receptor outer segment plus RPE (OS+) is the distance between E and F. The plus indicates that our choice of boundaries will include a contribution from the RPE and BM.
The thicknesses of these six layers were calculated by the computing software (MATLAB program; The Mathworks, Inc.). Because some scans were flatter than others (compare Figs. 1B and 1D, which is an extreme to illustrate an unflattened scan) the boundary lines were flattened using a custom program (written in MATLAB; The Mathworks, Inc.). This accounts for some of the waviness in the curves in the figures (see Fig. 3, Fig. 5, and Fig. 6). The unflattened results were very similar. In fact, support for the major conclusions here was even more robust with the unflattened data.
Segmentation of Peripapillary Circular Scan
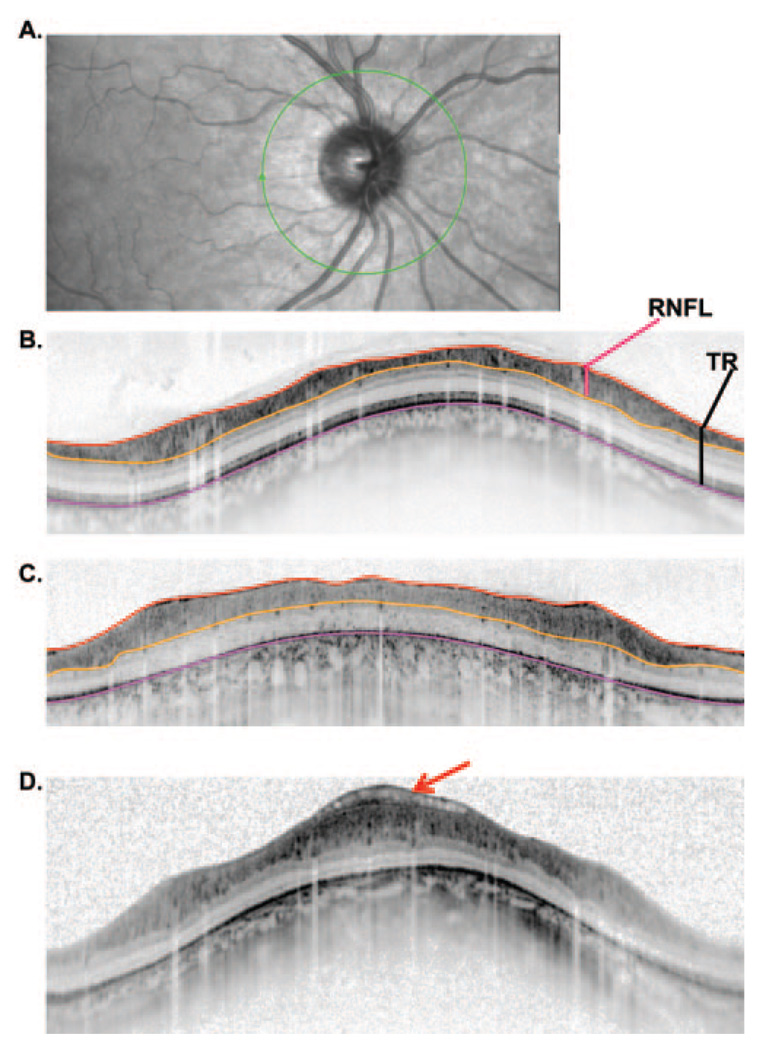
In a similar manner, the vitreous/RNFL, RNFL/RGC, and BM/choroid borders were marked on the circular peripapillary scans as shown in Figure 2 for the scans from a control (Fig. 2A) and two patients (panels B and C). From these borders, RNFL and total retinal thickness were determined as shown in Figure 2B.
FIGURE 2.
(A) Fundus view of an optic disc with the location of the peripapillary circular scan (green). (B) A peripapillary scan of a normal control with the lines marking the borders of the vitreous/RNFL (red), RNFL/RGC (orange), and BM/choroid (pink) (see Fig. 1C). The total retinal (TR) thickness (black vertical line) and RNFL thickness (red vertical line) were calculated from these borders as indicated. (C) Same as in (B) for a patient with RP. (D) A patient’s scan showing an abnormality that gets included in the RNFL thickness measure for this patient.
RESULTS
Retinal Layers along Horizontal Meridian
Figure 3 contains the results for all 23 controls for the six retinal layers measured (see Fig. 1C). The data for the control from Figure 1 are represented by the bold red curves in each panel. All scans were oriented as if they were from left eyes; that is, the results from the right eye were plotted from the nasal retina to the temporal retina to match the results from the left eye. Therefore, in Figure 3 the nasal retina (closest to optic disc) is to the left and temporal retina to the right, with 0 on the x-axis indicating the center of the fovea. The bold back curves are the means ± 2 SD (95% CI) of these measurements. There is reasonable agreement among the controls. Further, the data agree with known retinal anatomy. Notice for example, the RNFL is constant and small in the temporal retina. In principle, there should be no RGC axons along the horizontal meridian in the temporal retina. The small thickness measure is probably largely due to a combination of factors including axons that either cross the midline and/or are present due to small errors in the placement of the horizontal meridian. For more nasal locations, the RNFL increases in thickness as it approaches the optic disc. Further, the RGC+ layer and INL approach zero in the center of the fovea as expected; and the total receptor length and the length of the OS6+ (OS + RPE) increase as the center of the fovea is approached.
The mean curves for the controls in Figure 3 are shown in Figure 4 as white curves. The blue bands around these curves represent ± 1 SE. The mean and ± 1 SE for the 30 patients are shown as green curves and red bands. As expected for a disease that affects the receptors, the patients’ curves for the receptors (Fig. 4D) and outer segments (Fig. 4E) fall below the curves for the control group. The difference between the mean values for the patients and controls increases with eccentricity consistent with the known pattern of receptor loss in RP.
Of particular interest here are the INL, RNFL, and RGC+ layers. The average RNFL (Fig. 4A) in the nasal retina is thicker in the patients. There is also a hint that the RGC+ layer (Fig. 4B), on the temporal side of the foveal center is slightly thicker.
The data for the individual patients are shown in Figure 5 and Figure 6. For clarity, the 30 patients were divided into two groups of 15, rank ordered based on the thickness of the total receptor thickness (panel D) in the foveal center. Figure 5 contains the data for the thicker receptor layers and Figure 6 the thinner. The data for the patient in Figure 1 is shown as the bold red curve in Figure 6. The key findings are clear in these individual data as well. First, the RNFL is thicker than normal (falls above the 95% CI, upper bold black curve) in the nasal region in many patients. In fact, the RNFL curves for at least half of the patients had large nasal portions of their curves outside the 95% limits. Second, the total receptor curves for all patients fall below the 95% CIs in the periphery (Fig. 5D and Fig. 6D), while the 15 most extreme fall below the 95% CI even in the central fovea (Fig. 6D).
Peripapillary RNFL Thickness
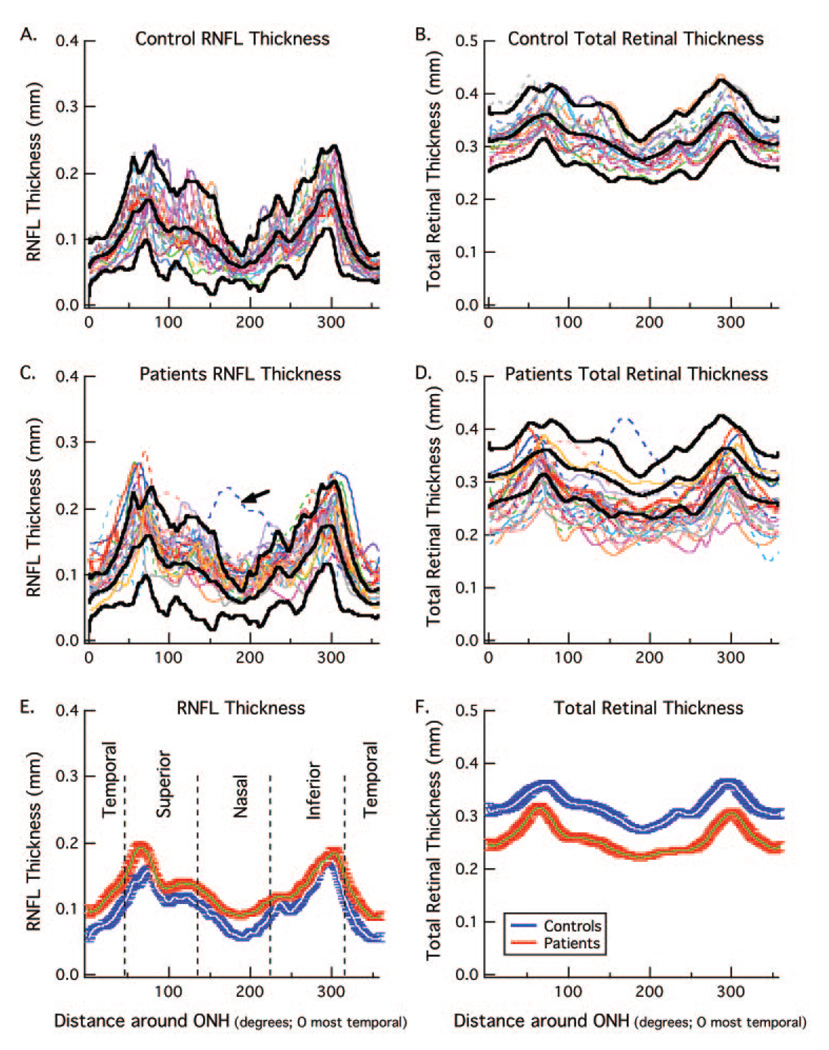
Figure 7A and 7B show the RNFL thickness (A) and total retinal thickness (B) for 20 controls. There is considerable variation in the amplitude and waveform of the RNFL profiles, as previously reported for conventional time domain OCT.14 The bold black curves indicate the average and ± 2 SD values (95% confidence limits). Panels C and D show the same results for 25 patients along with the bold curves for the controls from panels A and B. The results are very different for RNFL compared with the total retinal thickness. For RNFL thickness (Fig. 7C), the curves tend to fall above the average curve (middle bold curve), with many falling above the upper 95% confidence limit at some point. On the other hand, the curves for the patients’ total retinal thickness tend to fall below the mean of the controls with many falling below the lower confidence limit at some point. The dashed blue line (arrow) is a clear outlier and was not included in the overall average or analysis discussed below. This patient had an abnormality that artificially added to the RNFL and total retinal thickness, as shown in Figure 2D.
FIGURE 7.
(A) RNFL thickness for 20 normal controls (colored curves) with the mean and ± 2 SD of these curves shown as the bold black curves. (B) Total retinal thickness for the same 20 normal controls (colored curves) with the mean and ± 2 SD of these curves shown as the bold black curves. (C) RNFL thickness for 25 patients (colored curves) with the mean and ± 2 SD for the controls from (A) shown as the bold black curves. (D) Total retinal thickness for the same 25 patients (colored curves) with the mean and ± 2 SD for the controls from (B) shown as the bold black curves. (E) The white and blue curves are the mean RNFL thickness ± one SE for the 20 normal controls in panel (A) and the green and red curves are the mean RNFL thickness ± one SE for 24 of the 25 patients in (C), the outlier indicated with the arrow in (C) was omitted. (F) The white and blue curves are the mean total retinal thickness ± one SE for the 20 normal controls in (B) and the green and red curves are the mean total retinal thickness ± one SE for 24 of the patients in (D).
The average RNFL for the entire peripapillary scan was calculated for each individual. The mean of these averages for the patients (128.2 ± 16.7 µm) was significantly greater than the mean of the averages for the controls (102.4 ± 12.3 µm) (t = 5.75, df = 42). Further, 13 out of the 24 patients had an average thickness that exceeded the upper bound of the 95% confidence level, whereas none of the patients’ values fell below the lower bound.
The averages for the two groups are shown in Figures 7E and 7F along with the ± 1 SE. The patients (green curve with red band) show thicker RNFLs, but thinner total retinal thickness than the controls (white curve with blue band).
DISCUSSION
Because proposed therapeutic and prosthetic treatments for patients with RP assume functional post-receptoral retinal cells, it has been suggested that patients who are candidates for these treatments should be evaluated with OCT RNFL measurements. 10,11 However, for these measures to be clinically useful, we need to understand how RP affects them. To better understand the effects of RP on OCT measured retinal anatomy, we measured the thickness of different retinal layers, including the RNFL.
RNFL Thickness
In the present study, there is clear evidence for a thickening of the RNFL both along the horizontal meridian and around the disc, and little evidence for a significant thinning. The mean RNFL measurements were significantly larger in the patients than in the controls for both the horizontal meridian (Fig. 3A) and the peripapillary measurements (Fig. 7E). The measurements for the individual patients, in general, fell either within the normal limits or above, indicating a thickening relative to the controls.
While our finding of a thickening in some patients agrees with previous work, others10,11 have also found a thinning in some patients. In particular, Walia et al.10 found that 40% of their patients had a thickening of the RNFL in one or more quadrants of the disc on traditional tdOCT. However, they also reported that 28% of the patients showed significant thinning. Using a newer fdOCT, Walia and Fishman11 divided each of the four quadrants of the disc into four segments and defined an abnormal quadrant as one with two or more abnormal segments. For this analysis, the norms in their machine were used; they did not have a separate control group. Using a criterion of two segments per quadrant, they found that 38% of the eyes showed thinning, and 22% showed thickening. While we cannot perform the exact same analysis, as our fdOCT machine does not have normative values, we did compare the patients’ average peripapillary RNFL thickness to that of our age-similar controls. The mean of the average RNFL thickness of our patients was significantly thicker than our controls. Further, for 13 out of 24 (54%) of our patients, the average thickness of the patient’s RNFL was greater than the 95% confidence limit based on the controls, while none of the patient values fell below the confidence limit.
It is not entirely clear why Walia and Fishman11 observed a thinning of the RNFL and we did not. In general, our exclusion criteria (e.g., discs did not appear glaucomatous) were similar to theirs, as were the ages (33.1, range: 11 to 65 years vs. 39.7, range: 12 to 78 years) and best-corrected visual acuity (0.21 ± 0.24 log MAR vs. 0.37 ± 0.23 log MAR) of our patients. On the other hand, we noted four possible differences between their patient population and ours. First, the distribution of genetic types differed. Our sample of patients had relatively more patients with XlRP (47% vs. 4%) and relatively fewer patients with adRP (3% vs. 25%) and Ushers (7% vs. 19%). Second, Walia and Fishman11 noted that all seven of their patients with “moderate-severe” pallor showed a thinning. While it is hard to compare the ratings of disc pallor across studies, we note that the one patient in our sample rated as severe did not show a thinning; and a third of their patients with either no or normal-mild pallor showed a thinning of the RNFL layer. Third, we have previously argued that the algorithm used to segment the RNFL can affect measures of RNFL thickness.15 The extent to which the RNFL measurements include blood vessels, abnormalities such as those seen in Figure 2D and even the RGC layer, can depend on the algorithm used. A careful comparison of our manual technique to computer algorithms is needed to better understand the influence of these techniques on segmentation results. Finally, it is hard to know if the extent and/or duration of damage were the same in our samples. In any case, it is clear that further work is needed, especially to better understand the influence of genetic types and duration or time after onset of field loss.
Possible Causes of RNFL Thickening
If the thickness of the RNFL is to be of use in evaluating patients for therapies that depend on the integrity of post-receptor cells, it is important to understand the possible reasons for a thickening of the RNFL in many patients with RP. Walia and Fishman11 suggested that glial tissue on the surface of the retina may be included by the algorithm, and thus contribute to RNFL thickness. An examination of the RNFL scans as in Figure 2 suggests that this is unlikely to be a major factor in our study. On the other hand, we cannot exclude the possibility that there is a proliferation of glial cells within the RNFL. Remodeling, involving neuronal migration and glial hypertrophy, also has been suggested for what appears as a thicker RNFL in a patient with RP caused by a PDE6B mutation.16 A reviewer of this study suggested axonal swelling as another possibility. Finally, we wonder if some of the thickening might be due to a purely mechanical factor. Perhaps the RNFL “stretches” slightly to partially fill space emptied by the degeneration of the receptors. Interestingly, on average the RGC+ layer was normal on the nasal side of the fovea, but showed a suggestion of a thickening on the temporal side, where there was no RNFL (Fig. 4). Perhaps where the RNFL could not expand, the RGC+ layer did. However, it is not possible with existing data to distinguish between this hypothesis and several of the alternatives mentioned above.
CONCLUSIONS
Predictably, the patients with RP had markedly reduced receptor layers outside the central fovea. The INL and RGC+ layers were, in general, normal, although often on the thick side of normal, especially in the case of the RGC+ layer. However, the RNFL, whether measured on horizontal line or optic disc scans, showed a thickening in the majority of patients. To make optimal use of OCT RNFL thickness as a measure of the presence of RGCs in patients with RP, we need a better understanding of the causes of this thickening. Our results also raise the possibility that RGC layer thickness, which can be measured directly with fdOCT, may be better than RNFL thickness as an index of ganglion cell integrity in patients with RP.
Acknowledgments
Supported by National Eye Institute Grant R01-EY-09076 and Foundation Fighting Blindness.
Footnotes
Disclosure: D.C. Hood, Topcon (F, C); C.E. Lin, None; M.A. Lazow, None; K.G. Locke, None; X. Zhang, None; D.G. Birch, None
References
- 1.Rizzo JF, III, Wyatt J, Loewenstein J, Kelly S, Shire D. Methods and perceptual thresholds for short-term electrical stimulation of human retina with microelectrode arrays. Invest Ophthalmol Vis Sci. 2003;44:5355–5361. doi: 10.1167/iovs.02-0819. [DOI] [PubMed] [Google Scholar]
- 2.Jensen RJ, Rizzo JF., III Activation of retinal ganglion cells in wild-type and rd1 mice through electrical stimulation of the retinal neural network. Vision Res. 2008;48:1562–1568. doi: 10.1016/j.visres.2008.04.016. [DOI] [PubMed] [Google Scholar]
- 3.Tao W, Wen R, Goddard MB, et al. Encapsulated cell-based delivery of CNTF reduces photoreceptor degeneration in animal models of retinitis pigmentosa. Invest Ophthalmol Vis Sci. 2002;43:3292–3298. [PubMed] [Google Scholar]
- 4.Sieving PA, Caruso RC, Tao W, et al. Ciliary neurotrophic factor (CNTF) for human retinal degeneration: phase I trial of CNTF delivered by encapsulated cell intraocular implants. Proc Natl Acad Sci U S A. 2006;103:3896–3901. doi: 10.1073/pnas.0600236103. [DOI] [PMC free article] [PubMed] [Google Scholar]
- 5.Stone JL, Barlow WE, Humayun MS, de Juan E, Jr, Milam AH. Morphometric analysis of macular photoreceptors and ganglion cells in retinas with retinitis pigmentosa. Arch Ophthalmol. 1992;110:1634–1639. doi: 10.1001/archopht.1992.01080230134038. [DOI] [PubMed] [Google Scholar]
- 6.Santos A, Humayun MS, de Juan E, Jr, et al. Preservation of the inner retina in retinitis pigmentosa. A morphometric analysis. Arch Ophthalmol. 1997;115:511–515. doi: 10.1001/archopht.1997.01100150513011. [DOI] [PubMed] [Google Scholar]
- 7.Flannery JG, Farber DB, Bird AC, Bok D. Degenerative changes in a retina affected with autosomal dominant retinitis pigmentosa. Invest Ophthalmol Vis Sci. 1989;30:191–211. [PubMed] [Google Scholar]
- 8.Huang D, Swanson EA, Lin CP, et al. Optical coherence tomography. Science. 1991;254:1178–1181. doi: 10.1126/science.1957169. [DOI] [PMC free article] [PubMed] [Google Scholar]
- 9.Schuman JS, Hee MR, Puliafito CA, et al. Quantification of nerve fiber layer thickness in normal and glaucomatous eyes using optical coherence tomography. Arch Ophthalmol. 1995;113:586–596. doi: 10.1001/archopht.1995.01100050054031. [DOI] [PubMed] [Google Scholar]
- 10.Walia S, Fishman GA, Edward DP, Lindeman M. Retinal nerve fiber layer defects in RP patients. Invest Ophthalmol Vis Sci. 2007;48:4748–4752. doi: 10.1167/iovs.07-0404. [DOI] [PubMed] [Google Scholar]
- 11.Walia S, Fishman GA. Retinal nerve fiber layer analysis in RP patients using Fourier-domain OCT. Invest Ophthalmol Vis Sci. 2008;49:3525–3528. doi: 10.1167/iovs.08-1842. [DOI] [PubMed] [Google Scholar]
- 12.Oishi A, Otani A, Sasahara M, et al. Retinal nerve fiber layer thickness in patients with retinitis pigmentosa. Eye. doi: 10.1038/eye.2008.63. doi:10.1038/ eye.2008.63 [Epub ahead of print] [DOI] [PubMed] [Google Scholar]
- 13.Lim JI, Tan O, Fawzi AA, Hopkins JJ, Gil-Flamer JH, Huang D. A pilot study of Fourier-domain optical coherence tomography of retinal dystrophy patients. Am J Ophthalmol. 2008;146:417–426. doi: 10.1016/j.ajo.2008.05.018. [DOI] [PMC free article] [PubMed] [Google Scholar]
- 14.Ghadiali Q, Hood DC, Lee C, et al. An analysis of normal variations in retinal nerve fiber layer thickness profiles measured with optical coherence tomography. J Glaucoma. 2008;17:333–340. doi: 10.1097/IJG.0b013e3181650f8b. [DOI] [PMC free article] [PubMed] [Google Scholar]
- 15.Hood DC, Raza AS, Kay KY, et al. A comparison of retinal nerve fiber layer (RNFL) thickness obtained with frequency and time domain optical coherence tomography (OCT) Opt Express. 2009;17:3997–4003. doi: 10.1364/oe.17.003997. [DOI] [PMC free article] [PubMed] [Google Scholar]
- 16.Jacobson SG, Sumaroka A, Aleman TS, Cideciyan AV, Danciger M, Farber DB. Evidence for retinal remodelling in retinitis pigmentosa caused by PDE6B mutation. Br J Ophthalmol. 2007;91:699–701. doi: 10.1136/bjo.2006.104463. [DOI] [PMC free article] [PubMed] [Google Scholar]


