Abstract
The nearly degenerate asymmetric stretch vibrations near 1600 cm−1 of the guanidinium cation in D-glycerol/D2O mixtures having different viscosity were studied by 2D IR photon echo spectroscopy. The polarization dependent photon echo signal shows two separate frequency distributions in the 2D spectrum in D2O, even though only one band is evident from inspection of the linear FTIR spectrum. The split components are more clearly seen at higher viscosity. The interactions with solvent induce energy transfer between the degenerate component modes on the time scale of 0.5 ps. The energy transfer between modes is directly observed in 2D IR and distinguished by the waiting time dependence of the cross peaks from the transfers between threefold symmetric configurations of the distorted ion and solvent. The 2D IR analysis carried out for various polarization conditions required specification of frequency-frequency auto- and cross- correlation functions for the degenerate components.
Keywords: Ultrafast 2D IR spectroscopy, guanidinium chloride, photon-echo, population transfer, coherence transfer
INTRODUCTION
It remains an outstanding challenge to find a microscopic interpretation of the mechanism whereby Guanidinium chloride (GdmCl) denatures proteins. It readily unfolds almost all proteins, often at low GdmCl concentrations1–3. Two perspectives have been proposed for the protein denaturation by the amphiphillic ion Gdm+: one invokes the direct interaction of Gdm+ with nonpolar groups of proteins4–6, and the other gives a key role to changes in the water structure induced by Gdm+7. Therefore it is of value to design experiments that probe this ion along with its associated water structure and accompanying dynamics. In the present experiment 2D IR (two dimensional infrared) spectroscopy is used to provide new information regarding the structural and dynamical characteristics of Gdm+ and its associated water.
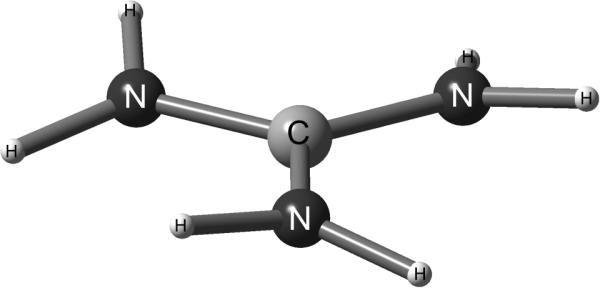
The isolated Gdm+ ion has D3 symmetry with the C and N atoms on the plane perpendicular to a three fold symmetry axis8 as shown on Figure 1. Each of the NH2 group planes makes an angle ~ 12° with the CN3 plane. The isolated ion has a degenerate mode around 1600 cm−1 corresponding to a combined CN3 asymmetric stretch and NH2 scissors motions. The symmetric stretch of CN3 is around 1000 cm−1. Asymmetric stretch mode has a large (ca. 0.5D) transition dipole9. Therefore the IR band of isolated Gdm+ at ca. 1600 cm−1 should correspond to two transitions at the same frequency having orthogonal transition dipole directions. In a solvent at each instant these modes become distinguishable and the transition dipole directions become well defined in the molecular frame. The 2D IR methods can probe the structure distributions of solvent associated ions and also the dynamics of any structural relaxations. By accessing both structural and dynamical features in a single experiment 2D IR10 can provide the transition dipole reorientational motions, intermode coupling and time dependent frequencies of each of the vibrational transitions on the ultrafast time scales commensurate with expectations for H-bond dynamics in aqueous ionic solutions as recently demonstrated for small ions11–13.
Figure 1. Structure of Gdm+ in vacuum.
There is a significant literature on the linear IR and two dimensional vibrational echo spectroscopy of coupled anharmonic oscillators13–21. They are modeled by two zero-order modes whose V=0→V=1 transitions may be chosen as nearly degenerate, such as in a symmetric dimer16 or a dipeptide22, 23, but whose eigenmodes are split by virtue of the term in the Hamiltonian that couples the two modes. The coupling for a pair of anharmonic oscillators represents an excitation exchange interaction which is often approximated for strong transitions as a dipole-dipole interaction. The existence of the coupling causes the eigenmodes to become linear combinations (that is, excitons) of the zero order modes. This is a fundamentally different situation than expected for a delocalized degenerate mode of a three-fold or higher symmetry system. In this case the vibrational eigenmodes have the same frequency, or they have nearly the same frequency if the molecule is in a solvent whose instantaneous structures might slightly break the exact symmetry. In the three-fold symmetry, the coupling of the vibrational and rotational angular momenta (Coriolis coupling) will cause one degenerate component to transfer into the other and the degenerate levels to split. If the solvent interactions strongly quench these angular momenta, the two modes may still mix and split as a result of them having different chemical interactions with surrounding solvent molecules. The splitting need not be caused by an excitation exchange interaction and in a first approximation the two components of the split degeneracy are still the same delocalized vibrational eigenmodes. Thus we see that the degenerate transition presents opportunities to evaluate the solvent interactions from a perspective that differs completely from the spectra of coupled anharmonic oscillators. Nevertheless the coupling to solvent can induce energy transfer between the nearly degenerate modes which can be detected by anisotropy measurements and by 2D IR24–26 because the nearly degenerate modes have nearly perpendicular transition dipoles. The energy transfer is expected to induce cross peaks in the 2D IR spectra25–27 allowing the transfer kinetics to be defined and evaluated.
Recent pump-probe measurements of the anisotropy for the 1600 cm−1 transition of Gdm+ have revealed sub-picosecond solvent induced transfers between the two nearly degenerate components. Intermode energy transfer has been invoked to explain anisotropy decays in a number of other examples24, 28, 29. These include CN vibrations of hexacyanides24 and CO vibrations of hexacarbonyls28, 29 for which the degenerate states can be described by the superpositions of modes that are localized on symmetrically placed CN or CO groups. The relaxation kinetics is then analogous to the relaxation of Frenkel excitons. The present example of Gdm+ is conceptually different in that the relaxation of Gdm+ is intrinsically related to solvent induced mixing of the two nearly degenerate, delocalized vibrations that are not intrinsically exciton-like. In the present paper we investigate these solvent effects through their influence on the vibrational frequency distributions and dynamics for this nearly degenerate pair of Gdm+ transitions at ca. 1600 cm−1 using polarization dependent femtosecond 2D IR photon echo and heterodyned transient grating methods.
EXPERIMENTAL METHODS
Sample Preparation
The guanidinium chloride purchased from Sigma-Aldrich (http://www.sigmaaldrich.com) is fully deuterated (C(ND2)3+, DGdm+ and dissolved in D2O. Deuteration prevents the spectral overlapping of degenerate mode of DGdm+ at ca. 1600 cm−1 with OH bending. The salt was completely deuterated by successive dissolution in excess D2O followed by lyophilization. Samples were held between two CaF2 plates separated by a 12 micron spacer. The use of concentrations less than ~0.2 M ensured that the DGdm+ ions were not aggregated30. D-glycerol/D2O, 59% (by weight) with viscosity 10 cP31 at 295K were also used in the experiments. Sample without spacer and with the concentration of 1.5 M was used in transient grating experiment.
Linear FTIR spectroscopy
Linear FTIR spectra were obtained with Thermo Nicolet 6700 FTIR spectrometer with 0.5 cm−1 resolution.
2D IR photon-echo experiment
A detailed description of the 2D IR photon-echo experiment and data processing can be found elsewhere13, 32. Here, we employed Fourier-transform limited 75 fs pulses with center frequencies at 1600 cm−1. Three of these pulses each with energy 400 nJ and wave vectors , and were incident on the sample. The phase-matched signal at wave vector was detected by heterodyning it with a local oscillator pulse that always preceded the signal pulse by a fixed interval of ~1.0 ps. The interval between pulses 1 and 2 is denoted as τ, that between 2 and 3 as T, and that between 3 and the detected signal as t. In the rephasing (nonrephasing) sequence the beam arrives earlier (later) than by an amount τ. The signal and local oscillator pulses were combined at the focal plane of a monochromator having a 64-element MCT array detector (IR Associates, Inc.). The raw data collected using this method was a function S(τ,λt,T) of the two time intervals and wavelength. Fourier transformation along τ and transformation of λt to ωt generate the two-dimensional spectra for each population interval T. To obtain absorptive spectra, the rephasing and nonrephasing were added at each value of T. For polarization dependent echo experiments the incident and local oscillator pulses passed through polarizers to produce either same polarization for all pulses and the XXXX tensor signal or perpendicular polarization of and pulses corresponding to the XXYY tensor. In the transient grating experiment the XYYX tensor was also investigated. Polarization dependent heterodyned transient grating data (TG) were obtained by scanning T at zero delay between first two interactions, and .
EXPERIMENTAL RESULTS
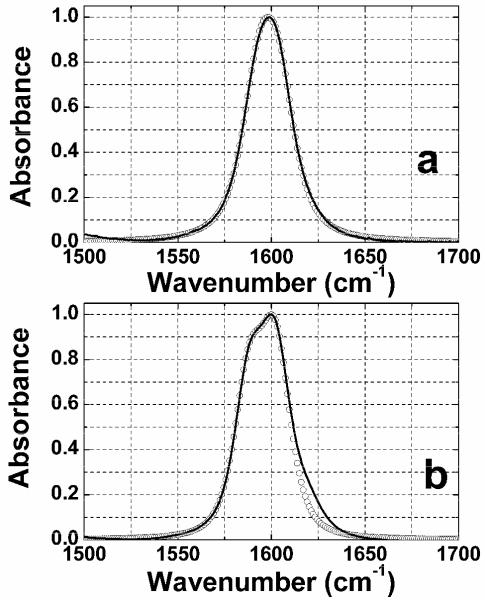
The FTIR spectra of DGdm+ in the 1500 ~ 1700 cm−1 region in different solvents are shown in Figure 2. This spectral region is presumed to incorporate the degenerate asymmetric stretch mode of the CN3 group of DGdm+. The FTIR spectrum of DGdm+ in D2O has one symmetric peak centered at 1599 cm−1 (ε = 868±8 M−1 cm−1). The change of solvent to a glycerol/water mixture leads to clear splitting of this band into two components: the first centered at 1600 cm−1 (ε = 831 ± 65 M−1 cm−1) and the second as a shoulder at 1590 cm−1.
Figure 2. Linear FTIR spectra of guanidinium chloride.
The normalized FTIR spectra of guanidinium chloride, DGdm+, in (a) D2O and (b) 59% D-glycerol/D2O, after solvent absorption is subtracted. The circles represent the simulation of the linear FTIR spectra with parameters given in Table 2.
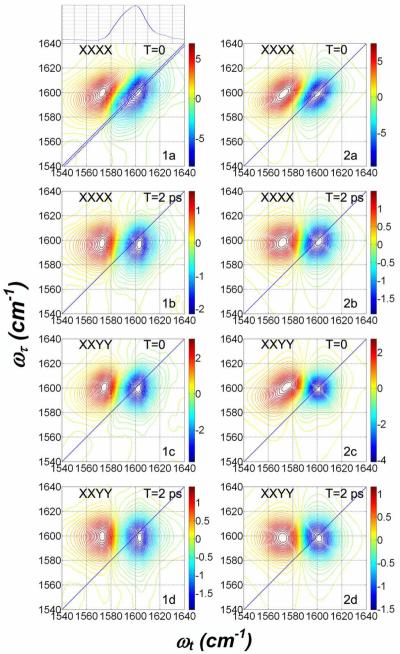
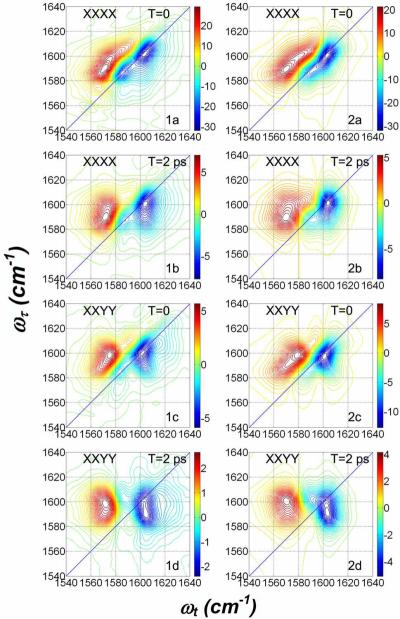
The polarization dependent absorptive 2D IR spectra of DGdmCl in D2O are shown in Figure 3 while those of DGdmCl in D-glycerol/D2O are shown in Figure 4. In both these Figures the data are shown in the left-hand columns: the right-hand columns are simulations to be discussed later in the paper. The details of the 2D IR data in Figures 3 and 4 show conclusively that the 1600 cm−1 band of DGdm+ consists of two identifiable frequency distributions peaked at different locations on the diagonal of the 2D IR spectra. It is also clear that there are cross peaks connecting these two diagonal transitions. The specific features of these 2D IR spectra, pertaining mainly to the V=0→V=1 contribution, which is shown in the blue in Figures 3 and 4, are summarized in the following description.
Figure 3. Polarization dependent absorptive spectra of 0.1 M DGdm+ in D2O.
Experimental spectra (1a–1d) at the two indicated waiting times, T. Simulation results (2a–2d) with parameters from Table 2. The plot situated above (1a) is the trace along the dotted diagonal line shown in (1a). The polarizations of the pulses are indicated on each subplot.
Figure 4. Polarization dependent absorptive spectra of 0.133 M DGdm+ in 59% D-glycerol/D2O.
Experimental spectra (1a–1d) at the two indicated waiting times, T. Simulation results (2a–2d) with parameters from Table 2. The polarizations of the pulses are indicated on each subplot.
The XXXX polarization 2D IR spectra in Figures 3.1a and 4.1a are both elongated along the diagonal at waiting time T = 0 ps. They both show multiply peaked distributions that are most apparent for the D-glycerol/D2O spectra. For the D2O case, the trace of the 2D spectral signal along the diagonal line drawn in Figure 3, presented in the upper panel of Figure 3.1a, shows the asymmetry that indicates of multiple states. In D2O the peaks appear at ωτ = 1600 cm−1 and ~1590 cm−1. In D-glycerol/D2O (Figure 4) they are readily identified at ωτ =1586 cm−1 and 1602 cm−1. These doublet spectra in D2O merge into a single peak with central frequency ωτ = 1598 cm−1 after a waiting time of 2 ps. The relaxed spectrum resembles an almost upright ellipse with its major axis along the coherence frequency axis ωτ. At a waiting time T=2 ps the two diagonal peaks of the 59% D-glycerol/D2O sample are shifted to ωτ =1587 cm−1 and 1601 cm−1 and the lower frequency peak has decreased in intensity. This decrease combined with the increase in cross peak intensity causes the spectrum to appear more upright, as in Figures 3.1b and 4.1b. The term upright signifies that the 2D IR spectrum not tilted from the orthogonal frequency axes. The analysis given later will show that the spectral evolutions of the two samples are quite similar although the increased splitting in glycerol/D2O makes it more readily visualizable. The lower frequency peak appears to decrease significantly with increasing T delay. In both solvents this decrease is accounted for by the overlap of the diagonal negative peak with the positive component of the cross peak. The XXYY 2D IR spectrum of DGdm+ in D2O at T=0 ps shows (see Figure 3) some elongation along the diagonal but it is more upright than the corresponding XXXX spectrum. The significant differences between the XXXX and XXYY signals, evident even at equivalent waiting times, are best visualized by comparing Figures 3.1a with 3.1c or 4.1a with 4.1c. The D2O sample shows only one peak at ωτ =1599 cm−1 for T = 0 but the spectrum evolves to have a distinctly upright shape at T = 2 ps. In D-glycerol/D2O, shown in Figure 4, cross peaks linking the two diagonal peaks are clearly seen along with two diagonal peaks at ωτ = 1585 cm−1 and 1601 cm−1. At T=2 ps a lower frequency diagonal peak is no longer present, and an upright spectrum is seen that has two peaks along the coherence frequency ωτ, at 1598 cm−1 and 1590 cm−1 as shown in Figure 4.
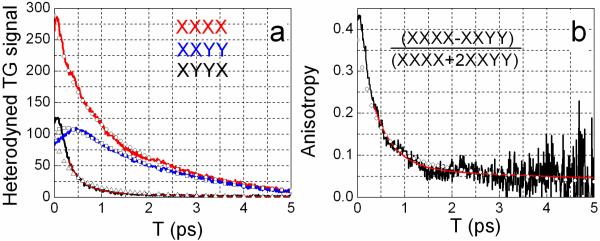
The heterodyned TG signals, recorded at the maximum of the photoinduced absorption are presented in Figure 5(a). They permit a direct comparison of the three tensor components. The XXXX and XXYY signals provide the same information as the polarization dependent pump-probe experiment. The T1 lifetime is obtained from the time evolution of the isotropic signal (XXXX+2XXYY) which, in combination with XXXX−XXYY, yields the anisotropy. The T1 lifetime of 1.8 ps obtained from the TG experiment is in excellent agreement with that obtained from pump-probe data30. The anisotropy presented on Figure 5(b) has a double exponential decay with time constants 0.43±0.07 ps and 13±7 ps and amplitudes 0.34±0.05 and 0.07±0.01. The parameters of the anisotropy agree reasonably with the more accurate pump-probe measurements30. The tensor XYYX decays very quickly compared with the other components and its evolution coincides with the rise of XXYY signal. The XYYX tensor decay could be reasonably fit with one exponential decay function with a time constant of 0.38 ps comparable with the fast decay of the anisotropy. The slow decay part of the anisotropy is too small to measure definitively in the heterodyned TG experiment that we performed.
Figure 5. Heterodyned Transient Grating (TG) of DGdm+ in D2O.
(a) Three tensor components of the experimental (red, blue and black curves) and simulated (circles, squares and triangles) heterodyned TG signals XXXX, XXYY and XYYX are shown. The signals are recorded at the maximum of the photoinduced absorption (1575 cm−1). The smooth red curve almost coincident with the black curve for XYYX is a single exponential decay.
The simulation used parameters from Table 2 with ω1= 1593.1 cm−1, ω2= 1604.5 cm−1, Δ = 1.6 ps−1, and ket=1.1 ps−1 for the best fits.
(b) Anisotropy decay of DGdm+ in D2O from the TG measurement XXXX and XXYY. Experimental (black), the double exponential decay fit (red) and simulated (circles) anisotropy probed at the maximum of photoinduced absorption (1575 cm−1).
DISCUSSION
The absorptive 2D IR spectra [XXXX, T = 0] in D2O in Figure 3 clearly demonstrate that the transition at ca. 1600 cm−1, which shows a single band in FTIR, is composed of a multiple peaked frequency distribution along the diagonal of the 2D IR spectra, having at least two well-defined peaks. The spectra have an upright shape in D-glycerol/D2O and in neat D2O indicating that there is a cross peak between the two peaks of the distribution that is polarization sensitive. In D-glycerol/D2O the cross peak is more readily visualized (see Figure 4) and it is evident by inspection that the relative amplitude of the cross peak at ωτ =1601 cm−1 increases compared with the diagonal peak at 1601 cm−1 as T increases. The increase of cross peak amplitude with increasing T tends to make the spectra appear more upright and elongated along ωτ for all solvents and polarization conditions.
The time scale of the cross peak evolution was derived from the relative amplitude of the cross peak compared with one of the diagonal peaks. Slices along ωτ at ωτ =1601 cm−1 (refer to Figure 4) were used to obtain the T dependences of the ratios shown in Figure 6 of signal amplitudes at ωτ =1585 cm−1 and ωτ =1601 cm−1, for XXYY and XXXX polarizations in D-glycerol/D2O. The exponential fit of the ratios gives a time constant of 550±70 fs for cross peak growth. This manner of analysis removes the effect of population relaxation which causes the overall signal to decay during the T period. The T dependence and polarization dependence of cross peak amplitude immediately suggests there is energy transfer between the two nearly degenerate asymmetric stretches25, 26.
Figure 6. Cross peak dynamics.
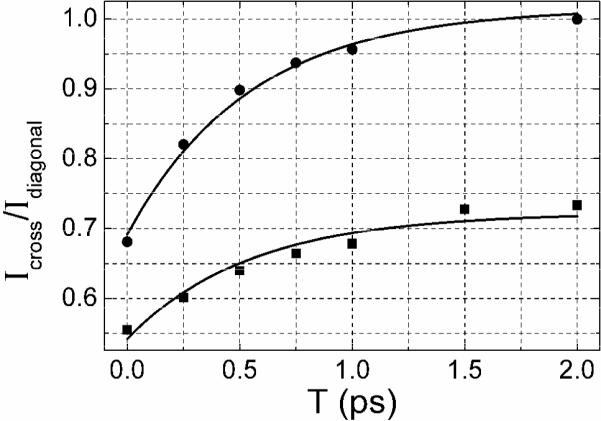
The ratio of the amplitudes between the cross peak at ωτ = 1585 cm−1 and the diagonal peak at ωτ = 1601 cm−1, both at ωτ =1601 cm−1. The polarizations are XXXX (squares) and XXYY (circles). The data refer to the 2D IR absorptive spectra of 0.133 M DGdm+ in 59% D-glycerol/D2O. Single exponential fits (as discussed in the text) are shown as solid curves.
The decay of the transient grating signal includes contributions from rotational diffusion and any processes leading to reorientation of the transition dipole moments. Rotational diffusion of the molecule with two perpendicular transitions in a spherical molecule approximation would provide a decay of XXXX and XXYY components to a constant value and of the XYYX component to zero, as is readily seen from orientational averaging for each component33. The ultrafast decay of the XYYX component occurs on a time scale much faster than characteristic times in rotational diffusion 1/6D and 1/2D. Moreover, the time scales of the XYYX decay and cross peak growth in 2D IR spectra are very similar, suggesting that the two effects have the same origin, namely energy transfer between two nearly degenerate modes which leads to reorientation of the two transition dipole moments. These cross peak dynamics and fast decay of the XYYX component of the TG signal are occurring on the time scale of recently reported pump-probe anisotropy decay for DGdm+ in D2O and in D-glycerol/D2O30
The dephasing and energy transfer parameters obtained from the 2D IR experiment/simulation, described below, are considerably more accurate than those from the TG.
2D IR PHOTON-ECHO SIMULATION
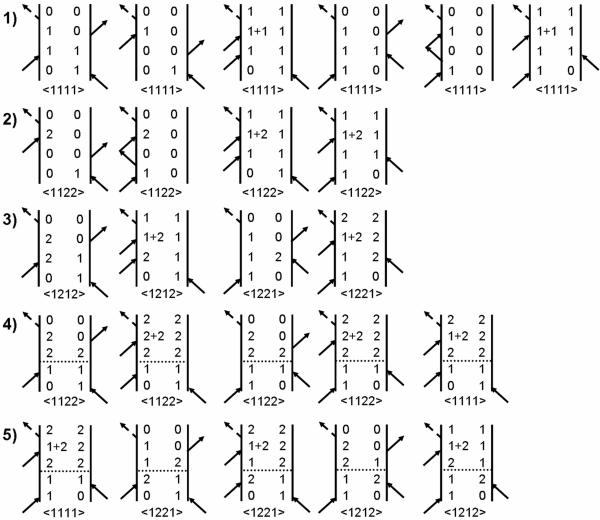
2D IR photon echo spectra for dilute solutions of DGdm+ were simulated by assuming a model consisting of the six states shown in Figure 7 and the response functions illustrated by the pathways in Figure 8. In the model there are two one quantum states (1≡|10〉 and 2≡|01〉) which are the components of the degenerate level. The transition dipole moments to these states from |00〉 are assumed to be perpendicular. There are three two quanta states (1+2≡|11〉, 2+2≡|02〉, 1+1≡|20〉). The frequencies of the |01〉→|02〉 or |10〉→|20〉 transitions are each downshifted by Δ from the fundamental frequency. The |11〉 state is downshifted by Δc from the sum of the two fundamental frequencies. This choice of system eigenstates to describe the solvent induced dynamics of the degenerate manifold of states has been discussed in detail previously30. The simulation is based on response functions given in reference34 and assuming delta function excitation pulses. The relevant diagrams are shown in Figure 8 (rows 1–3). The dephasing dynamics are discussed below.
Figure 7. Energy diagram for the separated normal modes model.
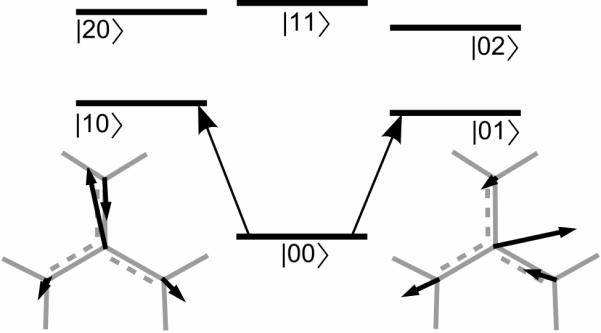
The displacements of the atoms of the CN3 group of DGdm+ for the two degenerate components of the 1600 cm−1 normal mode are shown. The atomic displacements illustrate the orthogonal polarization of the two transitions.
Figure 8. Liouville path diagrams for the photon echo signal emmited in the direction.
Rows 1 and 2 describe stimulated emission (population of state 1 during waiting time), ground state bleaching (ground state 0 during waiting time) and excited state absorption (coherence of 1+1 or 1+2 states and state 1 after the third interaction). Row 3 describes diagrams with interstate coherence during the waiting time. Rows 4–5 describe population and coherence transfer between modes during T due to the system-bath interaction. The horizontal dashed line implies that a spontaneous process occurs in the indicated interval. The complete set of diagrams needed for simulations includes those with indices 1 and 2 interchanged.
We first consider the fast cross peak growth shown in Figure 6. The D3 point symmetry of gas phase DGdm+ will be broken by asymmetric solvent interactions at any instant in the solution phase. The distorted structure that arises must have three equivalent orientations in space that carry with them three solvation shell structures: these configurations are labeled as A1, A2 and A3. For these three configurations the ion normal modes for different molecules in the sample would be identical except for a three-fold rotation in space. The IR transition dipole moments would be rotated by ±2π/3 in the plane of an ion. If an A1 configuration were excited by a short pulse, the redistribution of water molecules in the solvation shell and adjustments of the coupling of solvent to the ion would cause a transfer into the A2 or A3 configuration. Even in the absence of overall molecular rotation, at long delays after excitation of A1 the three configurations will have appeared an equal number of times, and would not be distinguishable. We will show that this process is slower than energy transfer. The former incorporated into the simulation through a simplified kinetics scheme that involves one rate coefficient, ks, connecting any pair of configurations A1, A2 and A3. These 2π/3 flips of the transition dipole moment direction cause a loss of anisotropy on the time scale (3ks)−1 In the 2D spectrum the time dependence of both the diagonal and cross peaks are sensitive to this effect.
The decay of anisotropy and cross peak growth in the 2D IR echo experiment will also be modified by solvent induced energy transfer between the two split degenerate components of any one of the three configurations A1–A3, which will cause stochastic jumps of π / 2 in the transition dipole directions.
The present analysis incorporates all the response functions for the nearly degenerate oscillator and it is assumed that the rate constants for energy transfer and coherence transfer during the T period are equal. This latter idea is based on a highly simplified picture of the system-bath interaction where the solvent bath is not influenced by the vibrational motions of the DGdm+ system. As mentioned in an earlier paper30, the system-bath interaction V is considered to depend on the normal modes Q1 and Q2 of the DGdm+ degenerate state, and on the coordinates, q, of the bath:
| (1) |
The equation of motion describing the dynamics of the reduced density matrix elements, in the basis of the six state model defined above, has the following form in each of the τ, T and t periods of photon echo experiment:
| (2) |
where R is a Redfield matrix35, 36 and |ωij−ωkl|▯ Δt−1 , where Δt is a measure of the evolution time of the system. Subpicosecond evolution times and near degeneracy results in many pairs of states chosen from the six state model being able to satisfy this inequality and so many density matrix elements need to be considered in the simulation. It was shown in earlier work that coherence transfer in the t period does not contribute much to the dynamics30 so here, we consider only coherence transfer during the T period during which time population transfer also occurs. In the simplified analysis the bath is not influenced by the solute, and it is characterized by a spectral density g(ω), so the rate coefficient for population transfer (π / 2 flips) between degenerate components 1 and 2 and for coherence transfer are defined as:
| (3) |
These rate coefficients are the Redfield elements:
| (4) |
| (5) |
where s and r represent the eigenstates of the bath and Pr is the Boltzmann factor for state r of the bath. Equations (3) – (5) are readily obtained from the Redfield Equation36 for Rαβγδ. In the present situation since the degeneracies have small splittings we assume that ω12 ≈ ω21 ≈ 0. The equality of k11→22 and k12→21 in the simple model is readily verified from properties of V=0 and V=1 of harmonic oscillators. It is noted that the energy transfer and the coherence transfer defined by Equation (3) both depend on the variance of the fluctuations of the bath, g(0) . As mentioned above, the exchanges of the coherences ρ01 and ρ02 created by the first pulse are considered to be slower because the states 1 and 2 are eigenmodes of the system and the exchange between ρ01 and ρ02 would appear to require fluctuation of the bath on the time scale of the fundamental transition frequencies, a result which arises from the restricted Redfield model described above. This coherence transfer depends on g(ω01), which is likely to be much less than g(0) when ℏω10 >> KBT, which is certainly the case for a high frequency vibration. For this reason the ρ01 , ρ02 exchange during τ is neglected. Our previous experiments on the pump-probe analysis
As already mentioned, the signal will depend on the 2π / 3 flips between configurations. However, since this process involves significant solvent reconfiguration it would be expected to slow down considerably at higher viscosities. The experiments in D2O and glycerol/water mixtures give quite similar results in regard to time dependence as shown by comparing Figure 3 and 4 at 2 ps. These results indicate that the effect of viscosity on the cross peak dynamics is not large, suggesting that the π / 2 flips are the dominant effect. The following analysis, which incorporates both processes clearly indicates that energy transfer is indeed the dominant mechanism for reorienting the transition dipoles.
To account for the energy transfer in the simulation the rephasing and nonrephasing pathways shown in Figure 8 (rows 4, 5) were incorporated. The main point of these diagrams is that the evolution involves a spontaneous component during T which is represented in the diagrams as the dashed line. This process can cause a population that was driven into one state to be detected through another state into which it spontaneously flows. Similarly it can result in a coherence during T being transformed into its conjugate with a rate described by Equation (5). During the T period the system is assumed to undergo kinetics induced by the system - bath interaction which is incorporated through a multiplicative factor. This factor is for the diagrams in rows (4) and (5) which are those experiencing population or coherence transfer. The probabilities for these diagrams undergoes growth from zero to a limiting contribution of 50%. The corresponding diagrams in rows (1) – (3), which are those not undergoing transfers, are multiplied by a factor . They undergo decay to the same 50% limit. Each diagram in rows (1) to (3) excluding the ground state bleaching terms, has a partner in rows (4) and (5). The rate coefficient ket is defined in Equation (3). The influence of the diagrams in rows (4) and (5) on the signal vanishes when ketT ⪡1.
The relaxation parameters included population lifetimes and dephasing processes. The T1 lifetimes of the states obtained from magic angle pump-probe measurements were 1.82 ps and 2.44 ps for DGdm+ in D2O and in the 59%D-glycerol/D2O mixture respectively30. The population lifetimes for the two nearly degenerate states were assumed to be equal and a harmonic approximation was used to define the lifetimes of doubly excited states. The pure dephasing was incorporated through integrated relaxation functions g11(t), g22(t) and g12(t) with parameters as described below. Orientational factors for two perpendicular transition dipole moments in the approximation of a spherical diffuser were employed in the simulation33. A path such as the first diagram in line 4 of Figure 8 involves energy transfer, and its orientational factor is taken from column iijj of Table 1a since the first two field interactions are with one mode (i) and second two are with the other (j). The 2π / 3 flip contributes to all diagrams. Its kinetic factors are chosen as for the starting configuration, say A1, and for the other two configurations. Thus, for each diagram the orientational coefficient 〈akblcmdn〉 is replaced by:
| (12) |
Table 1.
a) Orientational coefficients for Feynman paths for an oblate symmetric diffuser having two vibrational transition dipole moments in a plane perpendicular to the symmetry axis and b) The orientational factors for ±2π/3 flips.
| a) | ||||
|---|---|---|---|---|
| Tensor *e2D(t+τ) |
Feynman path (α β γ δ) | |||
| (iiii) | (ijij) | (iijj) | (ijji) | |
| <XαXβYγYδ> | <X1X2Y1Y2> | |||
| <XαXβXγXδ> | <X1X2Y1Y2> | |||
| b) | ||||
|---|---|---|---|---|
| 1/15 | −1/30 | 2/15 | −1/30 | |
| 7/60 | 1/60 | 1/12 | 1/60 | |
| 1/5 | 1/15 | 1/15 | 1/15 | |
| 1/10 | −1/30 | 1/6 | −1/30 | |
where superscripts A1, A2, A3 indicate which of the three configurations interacts with the excitation field. Values for and are given in Table 1b.
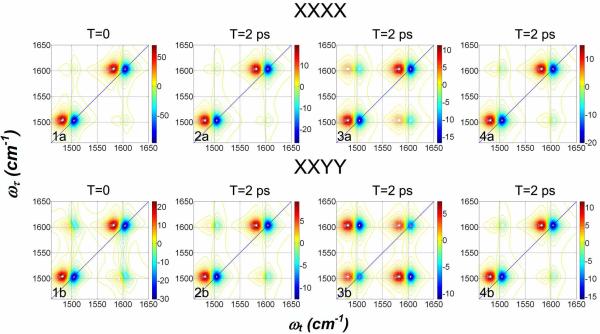
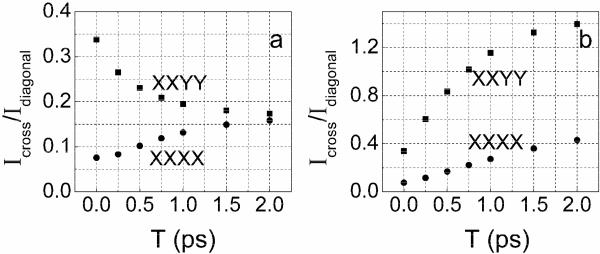
The 2D IR spectra of the split components of the degenerate state are congested so it is useful to visualize them as a function of T for the two components artificially separated in frequency, but otherwise with parameters for the degenerate transitions, as shown in Figure 9 in which spectra are simulated for T=0 and also for T=2 ps. The 2 ps panels are for three different relaxation mechanisms: In the first column of panels (2a and 2b) only the spectral diffusion and T1 processes are incorporated. In the second (3a and 3b) the coupling to induce π / 2 jumps is added. The third panels (4a and 4b) include spectral diffusion, T1 processes and 2π / 3 flips. Even without detailed processing the simulated spectra show clearly that the cross peak growth is completely different for the different mechanisms. The plots of ratios between cross peak and diagonal peak signals for the two mechanisms are shown on Figure 10. Comparisons with the experimental data for D-glycerol/D2O shown in Figure 6 show clearly that the energy transfer model agrees well with experiment and must be the dominant mechanism for cross peak growth in the D-glycerol/D2O mixture. The data show that ket must be much greater than ks.
Figure 9. Simulated spectra for an artificially large (100 cm−1) splitting of the degeneracy: effects of population exchange and 2π / 3 flips of the transition dipoles.
The parameters are from Table 2 for DGdm+ in D2O. The upper row is for XXXX and the lower row for XXYY polarization.
1a and 1b: T=0, spectral diffusion incorporated, no population exchange or 2π / 3 flips.
2a and 2b: T=2 ps, otherwise as in 1a and 1b.
3a and 3b: T=2 ps, spectral diffusion and population exchange incorporated, no 2π / 3 flips.
4a and 4b: T=2 ps, spectral diffusion and 2π / 3 flips incorporated, but no population exchange.
Figure 10. Simulated time dependence of the ratios of cross and diagonal peak intensities.
Simulated 2D IR absorptive spectra for XXXX (circles) and XXYY (squares) polarizations with the assumption of (a) 2π / 3 flips (as defined in the text) and no population exchange and (b) population exchange and no 2π / 3 flips between component states.
Simulated 2D IR spectra for different polarization conditions are shown on Figure 3 and Figure 4 using parameters given in Table 2. The central frequencies, ω1 and ω2, of two modes, their transition dipole moments, μ1 and μ2, the parameters for the autocorrelation and crosscorrelation functions and the rotational diffusion coefficients were chosen to satisfy both the linear FTIR and the 2D IR spectra. Simulated linear FTIR spectra are presented on Figure 2 with curves drawn by circles. The energy transfer rate coefficients were ket=0.53 ps−1 in neat D2O and ket=0.71 ps−1 in D-glycerol/D2O30. The simulation incorporated rotational diffusion coefficients of 3.3*1010 s−1 for D2O and 0.33*1010 s−1 for D-glycerol/D2O30. Figures 3, 2a and 2c show the simulated spectra for XXXX and XXYY polarizations where the main features of the experiment (Figure 3, 1a and 1c) are captured: the XXYY spectrum is proven to be upright (i.e. not tilted from the frequency axes) because of the presence of underlying cross peaks. The simulations in 2a and 2c of Figure 4 reproduce all the main features of the experiment at T=0. The T-dependent growth of the cross peak is also reproduced by the simulation for both samples. In the more viscous solvent, where two bands are more separated in frequency and have different intensities the agreement between the simulation and experiment is more easily visualized. In the simulations the dephasing contributions to the responses were treated differently for different diagrams.
Table 2.
Parameters used for simulation of polarization dependent 2D IR absorptive spectra and linear FTIR spectra of DGdm+ in D2O and 59%D-glycerol/D2O.
| Parameters | Solvent | ||
|---|---|---|---|
| D2O | 59% D-glycerol/D2O | ||
| ω1, cm−1 | 1593.0 | 1588.0 | |
| ω2, cm−1 | 1603.7 | 1602.3 | |
| Δ1, cm−1 | 25 | 18 ± 1 | |
| Δ2, cm−1 | 25 | 11 ± 1 | |
| Δc, cm−1 | 5 ± 1 | 5 ± 1 | |
| D∥, D⊥, *10−10 s−1 | 3.3 | 0.33 | |
| μ1/μ2 | 1 | 0.905 | |
| ket, ps−1 | 0.53 | 0.71 | |
| 〈δωi(τ)δωi(0)〉 | γ, ps−1 | 0.84 | 0.51 |
| Δ, ps−1 | 2.0±0.4 | 1.45±0.15 | |
| τ, ps | 1.13±0.88 | 1.5±0.5 | |
The vibrational frequency autocorrelation function C(t) required for the diagrams in line (1) of Figure 8 was assumed for each of the transitions to be the same sum of a homogenous part γ and a Kubo function, namely: C(t) = 2γδ(t) + Δ2e−t/τ, where the product τΔ is approximately equal to or greater than unity. The diagrams in line (2) involve pumping one transition and probing the other so they require a cross correlation between the two frequency distributions. The homogeneous parts of these transitions are considered, by definition, to be completely uncorrelated so that a cross-correlation function C12(t) of the two vibrational frequencies was incorporated in the approximate form: C12(t) = fΔ2e−t/τ where f is a correlation coefficient that was allowed to vary between 1 and -1. The diagrams in line (2) and (3) were evaluated by using these same auto and cross correlation functions. With these definitions the decay during T depends on the homogeneous relaxation parameter g only when there is a 1-2-coherence, as in the diagrams in row (3) of Figure 8, otherwise the homogeneous dephasing has no influence during T. The integrated relaxation parameters (the g(t) functions 35) have been set down in detail elsewhere 34 and need not be reproduced here. In the initial fitting the pairs of and t parameters of the auto and cross-correlation functions were allowed to vary independently but they consistently emerged as being approximately equal therefore in the fits shown in this paper they were assumed to be equal and only one pair of values of = 2 ps−1 and t = 1.13ps for water and = 1.45ps−1 and t = 1.5ps for D-glycerol/D2O are quoted. The values of the homogeneous dephasing rates were found to be g = 0.84 ps−1 for the D2O solvent and g = 0.51 ps−1 for the D-glycerol/D2O mixture. The picosecond correlation time t is attributed to the reconfiguration of the local water structures involving the ND2 groups of DGdm+ as will be discussed in next section. The cross correlation function of the split component frequencies presented on Figure 3 and 4 utilizes a correlation factor value f = -1 for both solvents. The equality of the cross-correlation and auto-correlation times indicates that the same solvent reconfigurations are responsible for both processes. The response functions for the DGdm+ transitions in D2O and in D-glycerol/D2O solvents incorporate quite similar frequency-frequency auto- and cross-correlation functions. The visual difference in the experimental results for the two solvents shown in Figures 3 and 4 originates from differences in three parameters: the dephasing contributions from population lifetime and reorientation; the solvent dependent splitting of two frequency distributions; and the relative strengths of the two transition dipole moments.
The simulation showed that the shape of the 2D IR spectra is very sensitive to the correlation between the frequency distributions of the two modes. A negative correlation is required to reproduce the shape of the absorptive spectra for XXYY experiment at T = 0 for DGdm+ in D2O and in D-glycerol/D2O shown in Figure 3 and 4. This shape arises because the cross peak tilted toward the antidiagonal direction. This anticorrelation is consistent with the notion that the solvent forces that are splitting the degeneracy tend to push the component states apart. In both solvents the frequencies of the two component modes, w1 and w2, are well separated with the average values of w2-w1 being 10.6 cm−1 for D2O and 14.2 cm−1 in D-glycerol/D2O. These splittings are readily accounted for by water H-bonding not only breaking the symmetry but distorting the -ND2 groups as discussed below. In D-glycerol/D2O the diagonal anharmonicities aising from the fits are 18±1 cm−1 for the lower frequency transition and 11±1 cm−1 for the higher frequency mode. These values are significantly different.
RELATIONSHIP OF 2D IR TO STRUCTURAL DYNAMICS
The influence of water interactions with Gdm+ on the frequency fluctuation of the nearly degenerate asymmetric stretches was first addressed by classical MD simulation. The simulation was performed with the NAMD package 37 using a box with a side of 30 Å containing 816 TIP3P waters and one Gdm+ cation. Parameters for Gdm+ were from the topology file for proteins in CHARMM22. A 1 ns duration trajectory was simulated with 20 fs step. The fluctuation of the NH2 groups was analyzed by means of the fluctuation of the angle (φ) between CN bond and the plane containing a N and two H atoms of a selected NH2 group.
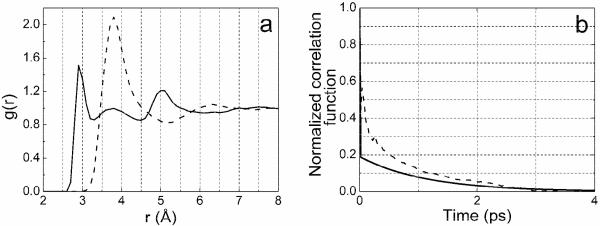
Radial distribution functions gCOw(r) for CGdm+-Owater and gNOw(r) for NGdm+-Owater are presented on Figure 11a. The three nitrogens are equivalent and data for only one of them are shown. The positions of the first peak on the distributions, 2.9 Å for gNOw(r) and 3.8 Å for gCOw(r), clearly indicate the amphiphilicity of the Gdm+: there is a significant lack of the water density immediately above and below Gdm+ plane in comparison with the water density around NH2 groups. Water molecules cannot approach the ion perpendicular to its plane and achieve normal H-bond separations from the carbon to oxygens of water. So the ion has a hydrophobic shield which only allows amphiphilic character towards water molecules around the perimeter of the ion that are approaching in directions that project significantly onto the plane of the CN3 group.
Figure 11. MD simulation results for Gdm+ in H2O.
(a) Radial distribution functions gNOw(r) (solid curve) and gCOw(r) (dashed curve) obtained from MD simulation of Gdm+ in H2O where Ow refers to a water oxygen atom. (b) Simulated (dashed curve) and experimental (solid curve) correlation decays. The simulation corresponds to 〈δφ(t)δφ(0)〉/〈δφ2〉 where δφ is the fluctuation in the NH2 wagging coordinate φ discussed in text. The experiment is the frequency-frequency correlation function with parameters given in Table 2 for DGdm+.
The MD simulation shows that reconfiguration of the H-bonded water molecules around the perimeter leads to significant variations in the -NH2 group geometries. The angle j was chosen to characterize the fluctuation of NH2 groups. A semi-quantitative picture of the time evolution of the reconfiguration of water around ion is given from the classical simulation of the autocorrelation function of the fluctuation of the angle j. The slow autocorrelation time was found to be 0.89 ps. The calculated time constant is similar to the slow decay time of 1.13 ps for the auto and cross correlation functions of the frequency fluctuations given in Table 2. Both the simulation and experiment are shown in Figure 11b. In the experimental fits the fast component of the frequency-frequency correlation function was assumed to be a delta function: the simulation gives a fast time constant of 27 fs. It is concluded that the observed frequency correlation functions are determined by hydrogen bond making and breaking around the perimeter of DGdm+ causing a wagging of the -ND2 groups. It is evident from the MD simulation that the -NH2 groups are bending out of plane and wagging in response to their interactions with the water molecules. It was confirmed by computations that the frequencies of the degenerate mode components are strongly correlated with the configurations of the -NH2 groups. Ab initio calculations on [C(ND2)3]+/D2O clusters with up to 8 D2O molecules showed that the degenerate mode near 1600 cm−1 can split by up to 80 cm−1 due to the interactions with asymmetrically disposed water molecules through H-bonding to the -ND2 groups 30.
CONCLUSION
The 2D IR photon echo spectroscopy of the nearly degenerate asymmetric stretch vibrations of DGdm+ in D2O and D-glycerol/D2O having perpendicular transition dipole moments showed an ultrafast growth of the cross peak between the two modes. Vibrational coupling of the two modes due to the system-bath interaction causes the population transfer (energy transfer) between them and also transfer between the inter-mode coherences which does not significantly contribute to the signal. A decay of the frequency-frequency correlation function occurs on two timescales: a motionally narrowed limit which is presumed to be caused by fast (50 fs) librations of water molecules in the solvation shell; and a slower decay on the time scale of one picosecond which is determined by solvation shell reconfiguration including H-bond making and breaking around the ND2 groups on the perimeter of DGdm+.
ACKNOWLEDGMENT
This research was supported by grants to RMH from NSF-CHE and R01-NIH-GM12592 with instrumentation developed under PO1- NIH-RR001348.
REFERENCES
- 1.Jackson SE, Elmasry N, Fersht AR. Structure of the Hydrophobic Core in the Transition-State for Folding of Chymotrypsin Inhibitor-2 - a Critical Test of the Protein Engineering Method of Analysis. Biochemistry. 1993;32(42):11270–11278. doi: 10.1021/bi00093a002. [DOI] [PubMed] [Google Scholar]
- 2.Mayo SL, Baldwin RL. Guanidinium Chloride Induction of Partial Unfolding in Amide Proton-Exchange in Rnase-A. Science. 1993;262(5135):873–876. doi: 10.1126/science.8235609. [DOI] [PubMed] [Google Scholar]
- 3.Bai YW, Sosnick TR, Mayne L, Englander SW. Protein-Folding Intermediates -Native-State Hydrogen-Exchange. Science. 1995;269(5221):192–197. doi: 10.1126/science.7618079. [DOI] [PMC free article] [PubMed] [Google Scholar]
- 4.Wetlaufer DB, Coffin RL, Malik SK, Stoller L. Nonpolar Group Participation in Denaturation of Proteins by Urea and Guanidinium Salts . Model Compound Studies. J. Am. Chem. Soc. 1964;86(3):508–514. [Google Scholar]
- 5.Bello J, Haas D, Bello HR. Interactions of Protein-Denaturing Salts with Model Amides. Biochemistry. 1966;5(8):2539–&. doi: 10.1021/bi00872a008. [DOI] [PubMed] [Google Scholar]
- 6.Moglich A, Krieger F, Kiefhaber T. Molecular basis for the effect of urea and guanidinium chloride on the dynamics of unfolded polypeptide chains. J. Mol. Biol. 2005;345(1):153–162. doi: 10.1016/j.jmb.2004.10.036. [DOI] [PubMed] [Google Scholar]
- 7.Scott JN, Nucci NV, Vanderkooi JM. Changes in Water Structure Induced by the Guanidinium Cation and Implications for Protein Denaturation. J. Phys. Chem. A. 2008;112(43):10939–10948. doi: 10.1021/jp8058239. [DOI] [PMC free article] [PubMed] [Google Scholar]
- 8.Magalhaes AL, Gomes JANF. Density-Functional Methods for the Study of the Ground-State Vibrations of the Guanidinium Ion. Int. J. Quantum Chem. 1997;61:725–739. [Google Scholar]
- 9.Drozd M. Molecular structure and infrared spectra of guanidinium cation - A combined theoretical and spectroscopic study. Materials Science and Engineering B-Solid State Materials for Advanced Technology. 2007;136(1):20–28. [Google Scholar]
- 10.Kim YS, Hochstrasser RM. Applications of 2D IR spectroscopy to peptides, proteins, and hydrogen-bond dynamics. J. Phys. Chem. B. 2009;113(24):8231–51. doi: 10.1021/jp8113978. [DOI] [PMC free article] [PubMed] [Google Scholar]
- 11.Kuo CH, Vorobyev DY, Chen JX, Hochstrasser RM. Correlation of the vibrations of the aqueous azide ion with the O-H modes of bound water molecules. J. Phys. Chem. B. 2007;111(50):14028–14033. doi: 10.1021/jp076503+. [DOI] [PubMed] [Google Scholar]
- 12.Kuo CH, Hochstrasser RM. Two dimensional infrared spectroscopy and relaxation of aqueous cyanide. Chem. Phys. 2007;341(1–3):21–28. [Google Scholar]
- 13.Kim YS, Wang JP, Hochstrasser RM. Two-dimensional infrared spectroscopy of the alanine dipeptide in aqueous solution. J. Phys. Chem. B. 2005;109(15):7511–7521. doi: 10.1021/jp044989d. [DOI] [PubMed] [Google Scholar]
- 14.Torii H, Tasumi M. Model-Calculations on the Amide-I Infrared Bands of Globular-Proteins. J. Chem. Phys. 1992;96(5):3379–3387. [Google Scholar]
- 15.Schweitzer-Stenner R, Eker F, Griebenow K, Cao XL, Nafie LA. The conformation of tetraalanine in water determined by polarized raman, FT-IR, and VCD spectroscopy. J. Am. Chem. Soc. 2004;126(9):2768–2776. doi: 10.1021/ja039452c. [DOI] [PubMed] [Google Scholar]
- 16.Lim M, Hochstrasser RM. Unusual vibrational dynamics of the acetic acid dimer. J. Chem. Phys. 2001;115(16):7629–7643. [Google Scholar]
- 17.DeFlores LP, Ganim Z, Nicodemus RA, Tokmakoff A. Amide I `−II ' 2D IR Spectroscopy Provides Enhanced Protein Secondary Structural Sensitivity. J. Am. Chem. Soc. 2009;131(9):3385–3391. doi: 10.1021/ja8094922. [DOI] [PubMed] [Google Scholar]
- 18.Rubtsov IV, Wang J, Hochstrasser RM. Dual frequency 2D-IR of peptide amide-A and amide-I modes. J. Chem. Phys. 2003;118(17):7733–7736. [Google Scholar]
- 19.Rubtsov IV, Wang JP, Hochstrasser RM. Dual-frequency 2D-IR spectroscopy heterodyned photon echo of the peptide bond. Proc. Natl. Acad. Sci. U. S. A. 2003;100(10):5601–5606. doi: 10.1073/pnas.0931292100. [DOI] [PMC free article] [PubMed] [Google Scholar]
- 20.Kurochkin DV, Naraharisetty SRG, Rubtsov IV. Dual-frequency 2D IR on interaction of weak and strong IR modes. J. Phys. Chem. A. 2005;109(48):10799–10802. doi: 10.1021/jp055811+. [DOI] [PubMed] [Google Scholar]
- 21.Cho MH. Coherent two-dimensional optical spectroscopy. Chem. Rev. 2008;108(4):1331–1418. doi: 10.1021/cr078377b. [DOI] [PubMed] [Google Scholar]
- 22.Piryatinski A, Tretiak S, Chernyak V, Mukamel S. Simulations of two-dimensional femtosecond infrared photon echoes of glycine dipeptide. J. Raman Spectrosc. 2000;31(1–2):125–135. [Google Scholar]
- 23.Woutersen S, Hamm P. Structure determination of trialanine in water using polarization sensitive two-dimensional vibrational spectroscopy. J. Phys. Chem. B. 2000;104(47):11316–11320. [Google Scholar]
- 24.Sando GM, Zhong Q, Owrutsky JC. Vibrational and rotational dynamics of cyanoferrates in solution. J. Chem. Phys. 2004;121(5):2158–2168. doi: 10.1063/1.1767072. [DOI] [PubMed] [Google Scholar]
- 25.Khalil M, Demirdoven N, Tokmakoff A. Vibrational coherence transfer characterized with Fourier-transform 2D IR spectroscopy. J. Chem. Phys. 2004;121(1):362–373. doi: 10.1063/1.1756870. [DOI] [PubMed] [Google Scholar]
- 26.Cahoon JF, Sawyer KR, Schlegel JP, Harris CB. Determining transition-state geometries in liquids using 2D-IR. Science. 2008;319(5871):1820–1823. doi: 10.1126/science.1154041. [DOI] [PubMed] [Google Scholar]
- 27.Kurochkin DV, Naraharisetty SRG, Rubtsov IV. A relaxation-assisted 2D IR spectroscopy method. Proc. Natl. Acad. Sci. U. S. A. 2007;104(36):14209–14214. doi: 10.1073/pnas.0700560104. [DOI] [PMC free article] [PubMed] [Google Scholar]
- 28.Tokmakoff A, Fayer MD. Homogeneous Vibrational Dynamics and Inhomogeneous Broadening in Glass-Forming Liquids - Infrared Photon-Echo Experiments from Room-Temperature to 10 K. J. Chem. Phys. 1995;103(8):2810–2826. [Google Scholar]
- 29.Tokmakoff A, Urdahl RS, Zimdars D, Francis RS, Kwok AS, Fayer MD. Vibrational Spectral Diffusion and Population-Dynamics in a Glass-Forming Liquid - Variable Bandwidth Picosecond Infrared-Spectroscopy. J. Chem. Phys. 1995;102(10):3919–3931. [Google Scholar]
- 30.Vorobyev DY, Kuo C-H, Chen J-X, Kuroda DG, Scott JN, Vanderkooi JM, Hochstrasser RM. 2D IR photon echo spectroscopy of guanidinium chloride. J. Phys. Chem. B. 2009 doi: 10.1021/jp9069256. submitted. [DOI] [PMC free article] [PubMed] [Google Scholar]
- 31.Segur JB, Oberstar HE. Viscosity of Glycerol and Its Aqueous Solutions. Industrial and Engineering Chemistry. 1951;43(9):2117–2120. [Google Scholar]
- 32.Kim YS, Hochstrasser RM. Dynamics of amide-I modes of the alanine dipeptide in D2O. J. Phys. Chem. B. 2005;109(14):6884–6891. doi: 10.1021/jp0449511. [DOI] [PubMed] [Google Scholar]
- 33.Hochstrasser RM. Two-dimensional IR-spectroscopy: polarization anisotropy effects. Chem. Phys. 2001;266(2–3):273–284. [Google Scholar]
- 34.Ge NH, Zanni MT, Hochstrasser RM. Effects of vibrational frequency correlations on two-dimensional infrared spectra. J. Phys. Chem. A. 2002;106(6):962–972. [Google Scholar]
- 35.Mukamel S. Principles of nonlinear optical spectroscopy. Oxford University Press; New York: 1995. p. xviii.p. 543. [Google Scholar]
- 36.Redfield AG. The theory of relaxation processes. In: Waugh JS, editor. Advances in magnetic resonance. Vol. 1. Academic Press; New York: 1965. pp. 1–32. [Google Scholar]
- 37.Phillips JC, Braun R, Wang W, Gumbart J, Tajkhorshid E, Villa E, Chipot C, Skeel RD, Kale L, Schulten K. Scalable molecular dynamics with NAMD. J. Comput. Chem. 2005;26(16):1781–1802. doi: 10.1002/jcc.20289. [DOI] [PMC free article] [PubMed] [Google Scholar]


