

Abstract
Basic virus dynamics models have been essential in understanding quantitative issues of HIV replication. However, several parts of the viral life cycle remain elusive. One of the most critical steps is the start of viral transcription, which is governed by the regulatory protein trans-activator of transcription (Tat) that induces a positive feedback loop. It has been shown that this feedback loop can alternate between two states leading to a transient activation of viral transcription. Using Monte Carlo simulations, we integrate the transactivation circuit into a new virus dynamics model having an age-dependent transactivation rate and reversion into latency. The cycling of infected cells between an activated and latent state results in the typical decelerating decay of virus load following therapy. Further, we hypothesize that the activation of latently infected cells is governed by the basal transcription rate of the integrated provirus rather than the intra- or extracellular environment. Finally, our systems approach to modeling virus dynamics offers a promising framework to infer the extracellular dynamics of cell populations from their intracellular reaction networks.
Keywords: HIV, mathematical modeling, stochastic noise, transactivation, viral latency
Introduction
Within-host virus dynamics has traditionally been investigated with mathematical models that describe events happening between different compartments on the extracellular level, i.e., the interaction between cells and virus particles. These models have given important insight into the dynamics of virus infections within a host (Nowak and May, 2000; Perelson, 2002). However, critical parts of the viral life cycle remain elusive. Specifically, it has been difficult to understand how the intracellular kinetics of virus replication can influence the extracellular virus dynamics.
In HIV, the protein trans-activator of transcription (Tat) has been found to have a major role within an infected cell, where it induces viral transcription through a positive feedback loop (Karn, 1999). It was shown in experiments that the infected cells alternate between a highly transactivated and a resting or latent state, depending on the intracellular concentration of the protein Tat (Box 1). Stochastic computer simulations of the intracellular circuit that were used to analyze the process of transactivation were found to agree with the experimental results (Weinberger et al, 2005). These findings were intriguing and it was hypothesized that the transactivation circuit could be a critical determinant of viral latency.
Schematic representation of the intracellular transactivation during the HIV replication life cycle.

Box 1 Top left: In a newly infected cell, the viral RNA is transcribed into a linear DNA provirus (orange) that is imported into the nucleus. Before integration at a semi-random position into the host DNA, pre-integration transcripts can be produced. Top right: Viral transcripts are then translated into the regulatory protein trans-activator of transcription (Tat) (blue) that gets re-imported into the nucleus where it induces a positive feedback loop through the elevation of the proviral transcription rate (thick red arrow). Subsequently, the cell becomes transactivated and can produce a sufficient amount of viral proteins that can give rise to new viral particles that are budding of the cell membrane. Bottom right: The positive feedback loop in transactivated cells can interrupt and infected cells revert into a latent state. These cells are now subject to a low basal transcription rate (thin red arrow) that can eventually re-activate the latently infected cells. Bottom left: The fate of a single cell can be determined through Monte Carlo simulations of the intracellular transactivation circuit. Repeating many simulation runs for single cells results in a distribution for the occurrence of each transition from which the corresponding rates can be determined. The rates for transactivation after infection (s), reversion into latency (r) and reactivation of latently infected cells (α) can then be applied in a mathematical model of virus dynamics which is depicted schematically. It should be noted that through all stages of infection, the cells can be subjected to cell death.
The viral reservoir of latently infected cells is considered to be one of the major barriers for eradicating HIV from an infected patient (Lassen et al, 2004a; Han et al, 2007). In patients on highly active antiretroviral therapy (HAART), the pool of latently infected cells decays very slowly, and at a decreasing rate (Finzi et al, 1999; Siliciano et al, 2003; Strain et al, 2003). Also, low-level viremia can persist over years (Palmer et al, 2008). Mathematical studies have investigated the dynamics of latently infected cells in HIV but could not decipher the mechanism of activation and reversion (Muller et al, 2002; Kim and Perelson, 2006; Sedaghat et al, 2008). The majority of the pool of latently infected cells consists of resting CD4+ T cells (Chun et al, 1997). As HIV mainly replicates in activated CD4+ T cells, it is generally believed that latently infected cells need to be activated by extracellular stimuli to provide the right environment for viral transcription. Antigenic stimulation has been suggested as a mechanism at which latently infected cells can become activated (Gunthard et al, 2000) and the availability of cellular transcription factors, the chromatin structure and CpG methylation are believed to have an effect on viral transcription (Lassen et al, 2004a; Blazkova et al, 2009). On the other hand, different forms of viral transcripts have been found in resting CD4+ T cells, highlighting that latency is not due to a complete transcriptional block but is due to an insufficient amount of transcripts and regulatory proteins, such as Tat (Lassen et al, 2004b). Together with the findings on the intracellular transactivation circuit, this observation suggests that viral transcripts and Tat could slowly accumulate to induce the positive feedback loop which itself activates the infected cell and subsequently leads to viral replication.
We apply the intracellular model of HIV transactivation as presented in Weinberger et al (2005) to understand the processes of viral activation and reversion into latency. In a systems approach to modeling virus dynamics, we derive the transition rates of these processes and infer the dynamics of a heterogeneous population of infected cells. We find that a single process, the basal transcription rate of the HIV provirus, can govern the activation from viral latency. This highlights that the activation of latently infected cells in HIV might be dictated, at least in part, by intrinsic viral factors rather than through extracellular stimuli.
Results
Dynamics of transactivation and reversion into latency
We investigate a modified version of the computational model presented in Weinberger et al (2005) to derive stochastic simulations for the transactivation and reversion of HIV-infected cells (see Materials and methods). First, we strictly simulate only the intracellular transactivation circuit, i.e., do not take into account processes such as infected cell death or viral replication. Time plots of representative simulations show the individual behavior of single cells infected with HIV (Figure 1A). Concomitantly with the increase of the regulatory protein Tat, the concentration of the other viral proteins breaches a threshold where we assume that the cell is able to generate new viral particles. An infected cell can be transactivated for a long time period (e.g., black lines), whereas other cells quickly revert back into a latent state (e.g., blue lines).
Figure 1.

Dynamics of transactivation and reversion into latency. (A) Representative time plots from stochastic simulation runs of three HIV-infected cells. Each color depicts the concentration of protein P (solid lines) and protein trans-activator of transcription (Tat) (dashed lines) within one infected cell. The dotted line indicates the threshold of transactivation. (B) Probability distribution and age-dependent rate of transactivation. A small amount of pre-integration transcripts (mRNAn(0)=5) results in early transactivation of HIV-infected cells. (C) Probability distribution and age-dependent rate of reversion. After a time window of a few days, the transactivated cells revert into a latent state at a constant rate (blue line). (D) Probability distribution and age-dependent rate of transactivation of latently infected cells. Reactivation of latently infected cells is determined by the slowest process in the transactivation circuit (basal transcription) and therefore occurs at a constant rate. LTR=1 and all other species are zero except otherwise indicated. kb=10−6 s−1 for all simulations.
Patients infected with HIV harbor, in the order of millions or more, infected CD4+ T cells that are either in an activated or a resting (latent) state (Chun et al, 1997). The turnover of the total infected cell population within a patient will be influenced by the stochastic fluctuations in single cells. To investigate the dynamics that arises from a large number of infected cells, we carried out many simulations of single cells to derive the probability distribution of transactivation (Figure 1B, red line). A small amount of pre-integration transcripts, mRNAn (Wu, 2004), is sufficient for the early transactivation of an infected cell during the first 24 h after integration of the provirus. As a cascade of stochastic processes rules the event of transactivation, it is not surprising that the probability distribution approximates a log-normal distribution. We can also derive the probability distribution of reversion into latency, i.e., the probability at which an activated cell that is producing viral particles will revert into a latent state (Figure 1C, red line). Finally, latently infected cells can get reactivated (Figure 1D, red line).
Once we know the probability distribution of a transition into another state, we can derive the age-dependent rate at which it occurs (see Materials and methods). As expected, we find that infected cells have a high probability of being transactivated early after infection. The age-dependent transactivation rate peaks a few hours after infection and decreases afterwards (Figure 1B, blue line). Once an infected cell is activated, it can revert into a latent state. This age-dependent reversion rate, i.e., the reversion rate that depends on the age of the activated cell, reaches a constant value after an initial delay (Figure 1C, blue line). The delay is caused through the threshold that we set in order to discriminate between activated and latent cells. Overall, the rate at which the feedback loop is interrupted seems to be independent of the time the cell has spent in an activated state. Latently infected cells can get reactivated and we also find a constant rate of transactivation that does not depend on the age of the latent cell (Figure 1D, blue line). In our simulations, the process of transactivation in latently infected cells is indeed governed by a single process. The rate-limiting step of the transactivation circuit is given by the basal transcription rate of the long terminal repeat (LTR) that determines the rate at which latent cells become activated virus-producing cells. To test whether this behavior holds for an extended range of basal transcription rates, we run stochastic simulations with different basal transcription rates and obtain a linear relation between kb and the activation rate of latently infected cells, α (see Supplementary Figure S1). This highlights that the basal transcription rate determines the activation of latently infected cells, even if the rates are widely distributed.
An age-dependent transactivation model predicts biphasic viral load decline during antiretroviral therapy
After deriving the transition rates between the different states of an infected cell, we can test whether the turnover between activated and latent cells can account for the characteristic virus load decline after the initiation of antiretroviral therapy (Perelson et al, 1997). Hence, we integrate the cycling between activated and latent cells into a full virus dynamics model that includes viral replication, infection and cell death. As observed in Figure 1B, the transactivation of HIV-infected cells early after infection follows an age-dependent rate where the age, a, is given as the time that has passed since infection of the cell. In a virus dynamics model based on partial differential equations (PDEs) (Kirschner and Webb, 1996; Nelson et al, 2004; Althaus et al, 2009), this can be integrated as follows:

where I(a,t) is defined as the time-density of infected cells of age a before they are transactivated with rate s(a) and produce viral particles. We assume that activated cells A are subject to a constant reversion rate r and die at a rate δ per day that is independent of the age of the cell (Althaus et al, 2009). Latently infected cells, L, are generated through reversion of activated cells and can either become activated with rate α or die with rate μ. The boundary condition of the infected cells (i.e., the infection of cells) is simply given by I(0,t). The dynamics of free virus particles can be described by the conventional dV/dt=pA−cV.
Using the transition rates that we derived from the transactivation circuit (Figure 1B, C and D, blue lines), we have run numerical simulations of the virus dynamics model given in Equation (1) to model the chronic state of the infection (Figure 2). This set-point level during chronic infection is perturbed by the administration of antiretroviral drugs. Our model describes the typical shoulder phase during the first day after the start of therapy that is caused by the transactivation of recently infected cells I (Figure 2, black line) into activated, virus-producing cells A (Figure 2, blue line). During the first week after the start of therapy, the virus load (Figure 2, red line) declines exponentially with a slope that approximates the death rate of activated cells A. In addition, the dynamics is partly determined by the reversion of activated cells A into latent cells L and the reactivation of latently infected cells (Figure 2, red line). After the first week during treatment, the virus decay is described by a slower second phase that is caused by the slow reactivation of cells in the latently infected cell pool, accurately describing the first two phases of virus load decline during antiretroviral therapy.
Figure 2.

An age-dependent transactivation model predicts biphasic viral load decline during antiretroviral therapy. Numerical simulations of the partial differential equation (PDE) model from Equation (1) accurately describe the first two phases. Recently infected cells become transactivated (black line) causing the initial shoulder phase of the viral load after treatment (red line). The virus load decays proportional to the number of activated virus-producing cells (blue line). The first phase of decline is followed by a slower second phase, which is caused by reactivation of latently infected cells (green line). Initially, the simulation is run to approach an equilibrium before the number of new infections, I(0,t), is set to zero (dotted line). Parameters are: r=0.019 d−1, α=0.039 d−1, δ=0.7 d−1, μ=0.0 d−1 and p/δV=100.
Intracellular Tat transactivation kinetics predict a decelerating decay during prolonged antiretroviral therapy
The basal transcription rate of the provirus depends on the position where it is inserted into the host DNA. Generally, the HIV provirus appears to be inserted at positions that are under active transcription because of the free access for integration (Schroder et al, 2002). However, experiments have shown that the transcriptional profile of HIV proviruses obeys a distribution (Jordan et al, 2001), suggesting that the basal transcription rates of some proviruses are likely to be low. Because of the linear relation between basal transcription rates and activation rates that we have shown above, this suggests that activation rates are also heterogeneously distributed. The decelerating decay of virus load following drug therapy has indeed been linked to different activation rates of latently infected cells (Strain et al, 2003, 2005). A decelerating decay can also be found in a recent study by Chun et al (2007) and has been suggested by mathematical modeling (Muller et al, 2002; Kim and Perelson, 2006). It has been speculated that the decelerating decay is a result of antigenic stimulation of resting CD4+ T cells that have different specificities. Here, we hypothesize that the heterogeneous activation rates of latently infected cells derive from the integration of the provirus at different sites in the host DNA, which results in the distribution of basal transcription rates. Once the latently infected cell pool gets depleted during drug treatment, the activation rates of the remaining cells shift towards low values resulting in a decelerating decay. As this affects the long-term behavior of the decay dynamics, we use a simplified HIV dynamics model that does not take into account the population of recently infected cells, i.e., we omit the integral of transactivation from Equation (1). For the cycling between activated and latently infected cells, we devise the following integro-differential equations with different classes of latently infected cells, La:
![]()
As we assume that de novo infections have stopped, activated cells A are only generated through activation of latently infected cells with a maximal activation rate αmax. They revert into latently infected cells with rate r or die with rate δ. Latently infected cells of type La are generated according to a distribution of activation rates, f(α), become activated with rate α and die with rate μ. By solving for the explicit solution (see Materials and methods) and using parameters values from the literature, we can accurately describe the decay dynamics of the virus load (Figure 3A and B) and the latently infected cells (Figure 3C). We obtain similar decay dynamics for several distributions of activation rates, f(α), as long as they decrease and approach zero at low activation rates. Both, the concentration of virus and of latently infected cells falls below one copy per ml over a prolonged period of treatment, but the virus fails to become eradicated because some latently infected cells have very low activation rates, i.e., harbor an HIV provirus with a very low basal transcription rate.
Figure 3.

Intracellular trans-activator of transcription (Tat) transactivation kinetics predict a decelerating decay during prolonged antiretroviral therapy. (A) Viral load decay within the first 45 days. The first phase results primarily from the death of activated virus-producing cells, whereas the second phase is determined by the reactivation of latently infected cells. Experimental estimates of the decay rates during the two phases are given by the dashed (Perelson et al, 1997) and dotted (Palmer et al, 2008) lines. (B) Decelerating decay during prolonged periods of therapy approximates experimental observations (dotted lines, Palmer et al, 2008). (C) Similarly, the pool of latently infected cells decays and approximates experimental estimates (dashed lines, Zhang et al, 1999; Finzi et al, 1999; Ramratnam et al, 2000; Siliciano et al, 2003). Parameters used: initial pool of activated, virus-producing cells A0=3.1 × 10⁷ cells (Chun et al, 1997), initial pool of latently infected cells I0=1.4 × 10⁶ cells (Chun et al, 1997), death rate of activated, virus-producing cells δ=0.7 d−1 (Perelson et al, 1997) and for simplicity we assume lifelong persistence of the resting CD4+ cells, i.e., μ=0.0 d−1 per day. In this figure, f(α) is a normal distribution with μ=0.2 and σ=0.1, truncated at zero and renormalized.
Discussion
It is challenging to investigate how the intracellular life cycle of a virus influences the virus dynamics within a host. Only few attempts have been made that combine the intra- and extracellular levels of virus dynamics so far (Haseltine et al, 2005, 2008). Further, one often assumes populations to be homogeneous to model the dynamics of viruses and infected cells. However, theoretical and experimental studies have shown how intrinsic noise in single cells can give rise to heterogeneous cell populations (McAdams and Arkin, 1997; Elowitz et al, 2002). Here, we used a modified computational model of the intracellular transactivation circuit of HIV (Weinberger et al, 2005; Weinberger and Shenk, 2007) to elucidate the events of transactivation after infection, reversion into latency and reactivation of latently infected cells. In a systems approach to modeling virus dynamics, we show the influence of this transactivation circuit on the virus dynamics that is observed after the initiation of antiretroviral therapy.
Early transcription of non-integrated proviruses has been observed in HIV-infected cells, but the biological potential of pre-integration transcripts are unclear (Stevenson et al, 1990; Wu and Marsh, 2003; Wu, 2004). We find that a small amount of pre-integration transcripts of viral RNA can be sufficient to trigger the transactivation circuit that renders an infected cell into an activated, virus-producing cell. The cascade of the intracellular transactivation circuit generates a delay between the infection of a cell and the production of viral proteins that contributes to the intracellular delay before virus production that is observed during the first day after antiretroviral drug treatment.
Latently infected cells consist of resting CD4+ T cells harboring an HIV provirus that does not provide sufficient transcription. Our simulations show, that a low basal transcription rate of the LTR can keep the infected cells in a latent state. However, as soon as a few Tat molecules have accumulated, the transactivation circuit may render a cell to become activated. Therefore, we postulate that the activation of latently infected cells is, at least in part, governed by the basal transcription rate of the provirus that is inserted in the host DNA. In contrast to previous studies, this suggests that the turnover of the latent infected cell pool is dictated by intrinsic viral factors, rather than extracellular stimuli such as antigenic activation. A recent study provides supporting evidence that Tat can indeed prime and activate peripheral blood mononuclear cells (PBMCs) if cultured at physiological oxygen levels (Sahaf et al, 2008). Hence, the intracellular transactivation circuit might result in Tat levels that induce translocation of host transcription factors which are necessary to activate resting CD4+ T cells for virus production.
The mechanisms behind the generation of viral latency have been difficult to assess so far (Lassen et al, 2004a). Li et al (1996) proposed that HIV-infected cells have a ‘shutdown’ mechanism for virus production. Mathematical models have incorporated the process of reversion into latency (Bucy, 1999; Sedaghat et al, 2008) but a definite mechanism has not been further investigated. The transient gene expression for the transcriptional circuit in HIV that has been found by Weinberger et al (2008) provides a model at which viral latency could be generated. One can speculate whether activated, virus-producing CD4+ cells survive long enough to revert into a latent state (Han et al, 2007). The stochastic simulations of the intracellular transactivation circuit result in a reversion rate of ∼0.019 per day. In the model that describes the long-term behavior of the decay dynamics, the reversion rate is determined by Equation (9) and we obtain r∼0.007 per day. As virus-producing cells follow a constant death rate (Althaus et al, 2009), these two estimates suggest that about 1−3% of the cells becoming latent is sufficient to account for the characteristic dynamics.
We can also show, by assuming a distribution of activation rates in latently infected cells that would arise from a distribution of basal transcription rates, that a model with different classes of latently infected cells fully explains the long-term decay dynamics during drug treatment. The second (Perelson et al, 1997), third and fourth (Palmer et al, 2008) phase of virus decay may not just arise from different compartments of infected cells but may reflect the decay profile of latently infected cells with different activation rates, similar as it was shown in Muller et al (2002). In contrast to the gradual depletion of latently infected cells that can be explained by a slow process such as the basal transcription rate, another phenomenon during antiretroviral therapy, the occurrence of transient viral ‘blips’, are unlikely to be caused by this mechanism. As blips appear to be the result of viral replication in a distinct sub-population of latently infected cells, they are more likely to be caused by a mechanism such as antigenic stimulation of localized T-cell populations harboring HIV (Rong and Perelson, 2009).
If the basal transcription rate indeed determines the activation rate of latently infected cells, then complete eradication of the latently infected cell pool during antiretroviral therapy is unlikely to happen, as the resting CD4+ T cells may persist lifelong. However, strategies for purging the pool of latently infected cells with activating stimuli have been proposed (Kulkosky et al, 2001; Brooks et al, 2003). Our study suggests that elevating the transcription rate of the provirus might prove to be a new target to activate the latently infected cells. If the basal transcription rates could be increased with transcriptional activators, or even with the molecule Tat, eradication of the latently infected cell pool in a reasonable time span may become feasible.
Different host factors are likely to contribute to the nature of viral latency in HIV, but we have shown that the properties of the intracellular transactivation circuit can account for many characteristics of the viral dynamics. These findings are in contrast with a common concept that the availability of host transcription factors determines viral latency. However, it is unclear whether the translocation of transcription factors is the cause or consequence of this process. Primarily, transcription factors such as the nuclear factor NF-κB have been found to stabilize the transactivation circuit (Burnett et al, 2009). We can only speculate about the definite role of the basal transcription rate and the HIV protein Tat in the generation and maintenance of viral latency, but recent observations have given support that latency could indeed be an intrinsic property of HIV (Jeeninga et al, 2008).
Materials and methods
Intracellular transactivation circuit
To simulate the transactivation of HIV-infected cells and their reversion into latency, we adopt the model from Weinberger et al (2005) and Weinberger and Shenk (2007). For some additions of the model and parameters, we refer to the studies by Reddy and Yin (1999) and Kim and Yin (2005). Using chemical kinetics, the transactivation circuit can be described as follows:
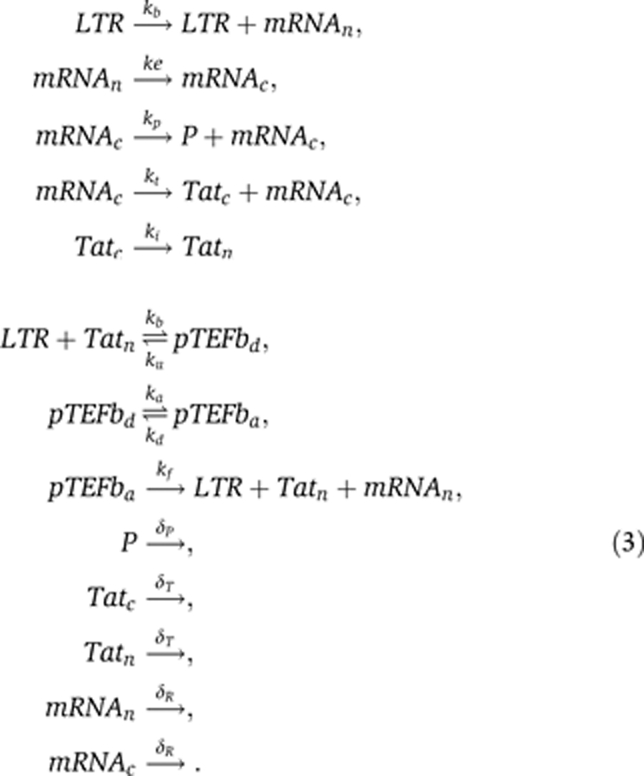
The promoter site of the HIV provirus consists of the LTR, which is under the control of a low basal transcription rate kb. Transcription can also happen in bursts giving rise to a higher number of mRNA molecules, i.e.,  . However, as long as the transcriptional bursts also occur at a low but constant rate kb, the properties of the transactivation circuit are not affected. Messenger RNA is transcribed in the nucleus (mRNAn) and exported into the cytoplasm (mRNAc) at a rate ke. There protein translation takes place, which generates the proteins for viral particle assembly, P, and at a lower rate the regulatory protein Tatc. After it is imported into the nucleus, Tatn binds reversibly, together with co-factors, to the LTR resulting in the transcriptional elongation factor pTEFbd. pTEFbd can reversibly become acetylated into the activated form pTEFba that leads to a much higher transcription rate, kf, of the provirus. Messenger RNA, Tat and proteins P have different rates of decay.
It is important to note that we do not take into account the processes of the HIV replication life cycle that occur before or after transactivation, such as reverse transcription or the assembly of viral particles. Also, it has been shown that after the first steps of transactivation, the regulatory protein Rev will generate differently spliced transcripts that eventually translate into structural proteins. Although these intermediate processes will extend the time delay until newly produced viral particles are released, it is unlikely that they influence the switch-like behavior of the transactivation circuit. Therefore, we simply define an infected cell as activated and virus-producing when the intracellular concentration of the viral protein P breaches a threshold of 103 (Figure 1A). We initialize the simulation runs of newly infected cells with a small amount of pre-integration transcripts (Wu, 2004). Sensitivity analysis shows that a single transcript of mRNA is rarely sufficient to induce the positive feedback loop. However, a few mRNA transcripts are enough to launch the transactivation circuit in ∼99% of the simulation runs and we set the number of pre-integration transcripts to mRNAn(0)=5. The parameters are given in Table I. For stochastic simulations of the transactivation circuit, we make use of the Gillespie algorithm (Gillespie, 1977). A program of the model was written in C and can be obtained freely on request from the authors.
Table 1. Reaction rates for the intracellular transactivation circuit of HIV.
| Reaction rate | Value | Unit | References |
|---|---|---|---|
| Depending on the proviral integration into the host DNA, the basal transcription rate can be given as a distribution (see Results). The translation rate and degradation rate of the viral protein P is adjusted that the level of intracellular protein in a fully activated cell saturates around 104 (Figure 1A). | |||
| kb: basal transcription rate | f(kb) | s−1 | See legend |
| ke: mRNA export into cytoplasm | 7.2 × 10⁻⁴ | s−1 | (Reddy and Yin, 1999) |
| kp: viral protein translation | 1.0 × 10⁻² | s−1 | See legend |
| kt: trans-activator of transcription (Tat) translation | 1.32 × 10⁻³ | s−1 | (Weinberger et al, 2005) |
| ki: Tat import into nucleus | 5.1 × 10⁻³ | s−1 | (Kim and Yin, 2005) |
| kb: binding of elongation factor | 1.5 × 10⁻⁴ | mol−1s−1 | (Weinberger et al, 2005) |
| ku: dissociation of elongation factor | 1.7 × 10⁻² | s−1 | (Weinberger et al, 2005) |
| ka: acetylation of elongation factor | 1.0 × 10⁻³ | s−1 | (Weinberger et al, 2005) |
| kd: deacetylation of elongation factor | 1.3 × 10⁻¹ | s−1 | (Weinberger et al, 2005) |
| kf: transactivated transcription rate | 1.0 × 10⁻¹ | s−1 | (Weinberger et al, 2005) |
| δp: degradation rate of viral protein | 5.0 × 10⁻⁶ | s−1 | See legend |
| δT: degradation rate of Tat | 4.3 × 10⁻⁵ | s−1 | (Reddy and Yin, 1999) |
| δR: degradation rate of mRNA | 4.8 × 10⁻⁵ | s−1 | (Kim and Yin, 2005) |
From probability densities to age-dependent rates
To analyze the behavior of a large population of HIV-infected cells that are subject to stochastic processes, we carry out many simulation runs of the transactivation circuit given in Equation (3) within a single cell. For example, in the case of transactivation of recently infected cells, we measure the time point at which the viral protein P exceeds the threshold of 103 (Figure 1A). This point is defined as the time of transactivation and we repeat the simulation 106 times to obtain the probability distribution of transactivation depending on the age of the infected cell (Figure 1B, red line). Next, we derive the age-dependent transactivation rate s(a), where a is the age of the cell after infection. The probability that an infected cell has not yet been transactivated until time t is given by
![]()
where ŝ(a) is the probability density function and  the cumulative probability density function of transactivation. By taking the logarithm and differentiating over t we derive the age-dependent transactivation rate
![]()
Similarly, the reversion rate and transactivation rate of latently infected cells can be obtained. For numerical simulations of the PDE model from Equation (1), we use the age-dependent transactivation rate obtained in Figure 1B and the constant rates that are approached in Figure 1C and 1D to solve the equations using the escalator boxcar train model formulation as described in De Roos et al (1992) (available on http://staff.science.uva.nl/~aroos/Ebt.htm).
Virus dynamics with heterogeneous activation rates
Based on the model given in Equation (2), we derive an explicit mathematical solution for the dynamics of virus and latently infected cells during drug therapy. We extend a previous model by (Muller et al, 2002) to account for the reversion of virus-producing cells into latency and additionally assume a distribution of activation rates of latently infected cells, f(α). For simplicity, we consider 100% drug efficacy and therefore assume that de novo infections have stopped.
First, we examine a simple case with only one class of latently infected cells, Lα, with a single activation rate α. As the turnover of activated cells is much faster than that of latently infected cells, we can make a quasi steady-state assumption:
![]()
The virus produced by activation of latently infected cells is then given by
![]()
where p/c accounts for the virus production and clearance.
Second, we assume a distribution of latently infected cells and define the pre-treatment steady-state as
![]()
with A(0) being the pool of activated cells. The total pool of latently infected cells is then given by
![]()
Now, we can account for the virus production through activation of a heterogeneous pool of latently infected cells by simply substituting Equation (9) into Equation (7), which gives the final solution:
![]()
Similarly, the decay of latently infected cells is given by
![]()
In addition, the initial pool of activated virus producing cells is decaying rapidly and the virus load is given by
![]()
where  represent the cells that are activated by latently infected cells at time 0 and therefore have been included in Equation (10). The total concentration of virus over time is then given by V(t)=VL(t)+VA(t). Numerical simulations of a full model without the quasi steady-state assumptions validate our explicit solution (results not shown).
Supplementary Material
Supplementary figure S1
Acknowledgments
We thank Vitaly Ganusov for discussions on technical aspects of the paper and three anonymous reviewers for helpful comments. Christian L Althaus and Rob J De Boer gratefully acknowledge financial support by the Netherlands Organisation for Scientific Research (VICI Grant 016.048.603).
Footnotes
The authors declare that they have no conflict of interest.
References
- Althaus CL, De Vos AS, De Boer RJ (2009) Reassessing the human immunodeficiency virus type 1 life cycle through age-structured modeling: life span of infected cells, viral generation time, and basic reproductive number, R0. J Virol 83: 7659–7667 [DOI] [PMC free article] [PubMed] [Google Scholar]
- Blazkova J, Trejbalova K, Gondois-Rey F, Halfon P, Philibert P, Guiguen A, Verdin E, Olive D, Van Lint C, Hejnar J, Hirsch I (2009) CpG methylation controls reactivation of HIV from latency. PLoS Pathog 5: e1000554. [DOI] [PMC free article] [PubMed] [Google Scholar]
- Brooks DG, Hamer DH, Arlen PA, Gao L, Bristol G, Kitchen CMR, Berger EA, Zack JA (2003) Molecular characterization, reactivation, and depletion of latent HIV. Immunity 19: 413–423 [DOI] [PubMed] [Google Scholar]
- Bucy RP (1999) Immune clearance of HIV type 1 replication-active cells: a model of two patterns of steady state HIV infection. AIDS Res Hum Retroviruses 15: 223–227 [DOI] [PubMed] [Google Scholar]
- Burnett JC, Miller-Jensen K, Shah PS, Arkin AP, Schaffer DV (2009) Control of stochastic gene expression by host factors at the HIV promoter. PLoS Pathog 5: e1000260. [DOI] [PMC free article] [PubMed] [Google Scholar]
- Chun T, Carruth L, Finzi D, Shen X, DiGiuseppe J, Taylor H, Hermankova M, Chadwick K, Margolick J, Quinn T, Kuo Y, Brookmeyer R, Zeiger M, Barditch-Crovo P, Siliciano R (1997) Quantification of latent tissue reservoirs and total body viral load in HIV-1 infection. Nature 387: 183–188 [DOI] [PubMed] [Google Scholar]
- Chun T, Justement J, Moir S, Hallahan C, Maenza J, Mullins J, Collier A, Corey L, Fauci A (2007) Decay of the HIV reservoir in patients receiving antiretroviral therapy for extended periods: implications for eradication of virus. J Infect Dis 195: 1762–1764 [DOI] [PubMed] [Google Scholar]
- De Roos AM, Diekmann O, Metz JAJ (1992) Studying the dynamics of structured population models: a versatile technique and its application to daphnia. Am Nat 139: 123–147 [Google Scholar]
- Elowitz MB, Levine AJ, Siggia ED, Swain PS (2002) Stochastic gene expression in a single cell. Science 297: 1183–1186 [DOI] [PubMed] [Google Scholar]
- Finzi D, Blankson J, Siliciano J, Margolick J, Chadwick K, Pierson T, Smith K, Lisziewicz J, Lori F, Flexner C, Quinn T, Chaisson R, Rosenberg E, Walker B, Gange S, Gallant J, Siliciano R (1999) Latent infection of CD4+ T cells provides a mechanism for lifelong persistence of HIV-1, even in patients on effective combination therapy. Nat Med 5: 512–517 [DOI] [PubMed] [Google Scholar]
- Gillespie D (1977) Exact stochastic simulation of coupled chemical reactions. J Phys Chem 81: 2340–2361 [Google Scholar]
- Gunthard HF, Wong JK, Spina CA, Ignacio C, Kwok S, Christopherson C, Hwang J, Haubrich R, Havlir D, Richman DD (2000) Effect of influenza vaccination on viral replication and immune response in persons infected with human immunodeficiency virus receiving potent antiretroviral therapy. J Infect Dis 181: 522–531 [DOI] [PubMed] [Google Scholar]
- Han Y, Wind-Rotolo M, Yang H, Siliciano J, Siliciano R (2007) Experimental approaches to the study of HIV-1 latency. Nat Rev Microbiol 5: 95–106 [DOI] [PubMed] [Google Scholar]
- Haseltine E, Rawlings J, Yin J (2005) Dynamics of viral infections: incorporating both the intracellular and extracellular levels. Comput Chem Eng 29: 675–686 [Google Scholar]
- Haseltine EL, Yin J, Rawlings JB (2008) Implications of decoupling the intracellular and extracellular levels in multi-level models of virus growth. Biotechnol Bioeng 101: 811–820 [DOI] [PMC free article] [PubMed] [Google Scholar]
- Jeeninga RE, Westerhout EM, van Gerven ML, Berkhout B (2008) HIV-1 latency in actively dividing human T cell lines. Retrovirology 5: 37. [DOI] [PMC free article] [PubMed] [Google Scholar]
- Jordan A, Defechereux P, Verdin E (2001) The site of HIV-1 integration in the human genome determines basal transcriptional activity and response to Tat transactivation. EMBO J 20: 1726–1738 [DOI] [PMC free article] [PubMed] [Google Scholar]
- Karn J (1999) Tackling Tat. J Mol Biol 293: 235–254 [DOI] [PubMed] [Google Scholar]
- Kim H, Perelson AS (2006) Viral and latent reservoir persistence in HIV-1-infected patients on therapy. PLoS Comput Biol 2: e135. [DOI] [PMC free article] [PubMed] [Google Scholar]
- Kim H, Yin J (2005) Robust growth of human immunodeficiency virus type 1 (HIV-1). Biophys J 89: 2210–2221 [DOI] [PMC free article] [PubMed] [Google Scholar]
- Kirschner D, Webb GF (1996) A model for treatment strategy in the chemotherapy of aids. Bull Math Biol 58: 376–390 [DOI] [PubMed] [Google Scholar]
- Kulkosky J, Culnan DM, Roman J, Dornadula G, Schnell M, Boyd MR, Pomerantz RJ (2001) Prostratin: activation of latent HIV-1 expression suggests a potential inductive adjuvant therapy for HAART. Blood 98: 3006–3015 [DOI] [PubMed] [Google Scholar]
- Lassen K, Han Y, Zhou Y, Siliciano J, Siliciano R (2004a) The multifactorial nature of HIV-1 latency. Trends Mol Med 10: 525–531 [DOI] [PubMed] [Google Scholar]
- Lassen KG, Bailey JR, Siliciano RF (2004b) Analysis of human immunodeficiency virus type 1 transcriptional elongation in resting CD4+ T cells in vivo. J Virol 78: 9105–9114 [DOI] [PMC free article] [PubMed] [Google Scholar]
- Li XD, Moore B, Cloyd MW (1996) Gradual shutdown of virus production resulting in latency is the norm during the chronic phase of human immunodeficiency virus replication and differential rates and mechanisms of shutdown are determined by viral sequences. Virology 225: 196–212 [DOI] [PubMed] [Google Scholar]
- McAdams HH, Arkin A (1997) Stochastic mechanisms in gene expression. Proc Natl Acad Sci USA 94: 814–819 [DOI] [PMC free article] [PubMed] [Google Scholar]
- Muller V, Vigueras-Gomez J, Bonhoeffer S (2002) Decelerating decay of latently infected cells during prolonged therapy for human immunodeficiency virus type 1 infection. J Virol 76: 8963–8965 [DOI] [PMC free article] [PubMed] [Google Scholar]
- Nelson P, Gilchrist M, Coombs D, Hyman J, Perelson A (2004) An age-structured model of HIV infection that allows for variations in the production rate of viral particles and the death rate of productively infected cells. Math Biosci Eng 1: 267–288 [DOI] [PubMed] [Google Scholar]
- Nowak M, May R (2000) Virus Dynamics: Mathematical Principles of Immunology and Virology. New York: Oxford Univerity Press [Google Scholar]
- Palmer S, Maldarelli F, Wiegand A, Bernstein B, Hanna GJ, Brun SC, Kempf DJ, Mellors JW, Coffin JM, King MS (2008) Low-level viremia persists for at least 7 years in patients on suppressive antiretroviral therapy. Proc Natl Acad Sci USA 105: 3879–3884 [DOI] [PMC free article] [PubMed] [Google Scholar]
- Perelson A (2002) Modelling viral and immune system dynamics. Nat Rev Immunol 2: 28–36 [DOI] [PubMed] [Google Scholar]
- Perelson A, Essunger P, Cao Y, Vesanen M, Hurley A, Saksela K, Markowitz M, Ho D (1997) Decay characteristics of HIV-1-infected compartments during combination therapy. Nature 387: 188–191 [DOI] [PubMed] [Google Scholar]
- Ramratnam B, Mittler J, Zhang L, Boden D, Hurley A, Fang F, Macken C, Perelson A, Markowitz M, Ho D (2000) The decay of the latent reservoir of replication-competent HIV-1 is inversely correlated with the extent of residual viral replication during prolonged anti-retroviral therapy. Nat Med 6: 82–85 [DOI] [PubMed] [Google Scholar]
- Reddy B, Yin J (1999) Quantitative intracellular kinetics of HIV type 1. AIDS Res Hum Retroviruses 15: 273–283 [DOI] [PubMed] [Google Scholar]
- Rong L, Perelson AS (2009) Modeling HIV persistence, the latent reservoir, and viral blips. J Theor Biol 260: 308–331 [DOI] [PMC free article] [PubMed] [Google Scholar]
- Sahaf B, Atkuri K, Heydari K, Malipatlolla M, Rappaport J, Regulier E, Herzenberg LA, Herzenberg LA (2008) Culturing of human peripheral blood cells reveals unsuspected lymphocyte responses relevant to HIV disease. Proc Natl Acad Sci USA 105: 5111–5116 [DOI] [PMC free article] [PubMed] [Google Scholar]
- Schroder ARW, Shinn P, Chen H, Berry C, Ecker JR, Bushman F (2002) HIV-1 integration in the human genome favors active genes and local hotspots. Cell 110: 521–529 [DOI] [PubMed] [Google Scholar]
- Sedaghat AR, Siliciano RF, Wilke CO (2008) Low-level HIV-1 replication and the dynamics of the resting CD4+ T cell reservoir for HIV-1 in the setting of HAART. BMC Infect Dis 8: 2. [DOI] [PMC free article] [PubMed] [Google Scholar]
- Siliciano J, Kajdas J, Finzi D, Quinn T, Chadwick K, Margolick J, Kovacs C, Gange S, Siliciano R (2003) Long-term follow-up studies confirm the stability of the latent reservoir for HIV-1 in resting CD4+ T cells. Nat Med 9: 727–728 [DOI] [PubMed] [Google Scholar]
- Stevenson M, Stanwick TL, Dempsey MP, Lamonica CA (1990) HIV-1 replication is controlled at the level of T cell activation and proviral integration. EMBO J 9: 1551–1560 [DOI] [PMC free article] [PubMed] [Google Scholar]
- Strain M, Gunthard H, Havlir D, Ignacio C, Smith D, Leigh-Brown A, Macaranas T, Lam R, Daly O, Fischer M, Opravil M, Levine H, Bacheler L, Spina C, Richman D, Wong J (2003) Heterogeneous clearance rates of long-lived lymphocytes infected with HIV: intrinsic stability predicts lifelong persistence. Proc Natl Acad Sci USA 100: 4819–4824 [DOI] [PMC free article] [PubMed] [Google Scholar]
- Strain M, Little S, Daar E, Havlir D, Gunthard H, Lam R, Daly O, Nguyen J, Ignacio C, Spina C, Richman D, Wong J (2005) Effect of treatment, during primary infection, on establishment and clearance of cellular reservoirs of HIV-1. J Infect Dis 191: 1410–1418 [DOI] [PubMed] [Google Scholar]
- Weinberger L, Burnett J, Toettcher J, Arkin A, Schaffer D (2005) Stochastic gene expression in a lentiviral positive-feedback loop: HIV-1 Tat fluctuations drive phenotypic diversity. Cell 122: 169–182 [DOI] [PubMed] [Google Scholar]
- Weinberger L, Shenk T (2007) An HIV feedback resistor: auto-regulatory circuit deactivator and noise buffer. PLoS Biol 5: e9. [DOI] [PMC free article] [PubMed] [Google Scholar]
- Weinberger LS, Dar RD, Simpson ML (2008) Transient-mediated fate determination in a transcriptional circuit of HIV. Nat Genet 40: 466–470 [DOI] [PubMed] [Google Scholar]
- Wu Y (2004) HIV-1 gene expression: lessons from provirus and non-integrated DNA. Retrovirology 1: 13. [DOI] [PMC free article] [PubMed] [Google Scholar]
- Wu Y, Marsh JW (2003) Early transcription from nonintegrated DNA in human immunodeficiency virus infection. J Virol 77: 10376–10382 [DOI] [PMC free article] [PubMed] [Google Scholar]
- Zhang L, Ramratnam B, Tenner-Racz K, He Y, Vesanen M, Lewin S, Talal A, Racz P, Perelson A, Korber B, Markowitz M, Ho D (1999) Quantifying residual HIV-1 replication in patients receiving combination antiretroviral therapy. N Engl J Med 340: 1605–1613 [DOI] [PubMed] [Google Scholar]
Associated Data
This section collects any data citations, data availability statements, or supplementary materials included in this article.
Supplementary Materials
Supplementary figure S1