Abstract
We analyzed DNA methyltransferase protein expression and DNA methylation patterns during four progressive stages of prostate cancer in the Transgenic Adenocarcinoma of Mouse Prostate (TRAMP) model, including prostatic intraepithelial neoplasia (PIN), well differentiated tumors (WD), early poorly differentiated tumors (EPD), and late poorly differentiated tumors (LPD). Dnmt1, Dnmt3a, and Dnmt3b protein expression are increased in all stages, however, after normalization to Cyclin A to account for cell cycle regulation, Dnmt proteins remained over-expressed in PIN and WD, but not in poorly differentiated tumors. Restriction Landmark Genomic Scanning (RLGS) analysis of locus-specific methylation revealed a high incidence of hypermethylation only in poorly differentiated (EPD and LPD) tumors. Several genes identified by RLGS showed hypermethylation of downstream regions correlating with mRNA overexpression, including p16INK4a, p19ARF, and Cacna1a. Parallel gene expression and DNA methylation analyses suggests that gene overexpression precedes downstream hypermethylation during prostate tumor progression. In contrast to gene hypermethylation, genomic DNA hypomethylation, including hypomethylation of repetitive elements and loss of genomic 5mdC, occurred in both early and late stages of prostate cancer. DNA hypermethylation and DNA hypomethylation did not correlate in TRAMP, and Dnmt protein expression did not correlate with either parameter, with the exception of a borderline significant association between Dnmt1 expression and DNA hypermethylation. In summary, our data reveal the relative timing of and relationship between key alterations of the DNA methylation pathway occurring during prostate tumor progression in an in vivo model system.
Keywords: TRAMP, DNA methylation, epigenetics, prostate cancer, DNA methyltransferase
Introduction
DNA methylation is deregulated in cancer such that the promoter regions of tumor suppressor genes become hypermethylated, resulting in gene silencing, while, on a global level, DNA becomes hypomethylated, leading to genomic instability (1, 2). In human prostate cancer, both of these mechanisms have been observed (3-8). In addition, deregulated expression of DNA methyltransferase (Dnmt) proteins is seen in human prostate cancer (9). These data provide compelling circumstantial evidence of a role for these alterations in prostate cancer development. However, it is difficult to assess the functional contribution of these alterations to prostate cancer development using only human clinical samples. Moreover, the relative timing of and relationship between distinct DNA methylation pathway alterations during prostate tumor progression has not been assessed in an in vivo model system. To this end, we and others have recently established TRAMP (Transgenic Adenocarcinoma of Mouse Prostate) as a suitable mouse model to investigate the role of altered DNA methylation in prostate cancer development (10-13). We have shown that late stage primary tumors and metastases from TRAMP mice display increased Dnmt expression, locus-specific non-random CpG island hypermethylation, and hypomethylation of repetitive DNA elements (11, 13). In addition, Day and colleagues have demonstrated, using pharmacological inhibition of Dnmt enzymes, that DNA hypermethylation contributes to the development of primary cancer in both intact and castrated TRAMP mice (10, 12). Taken together, these data suggest that the TRAMP model may be particularly useful to clarify the role of DNA methylation pathway alterations in prostate cancer development.
One notable finding of our previous study was that TRAMP tumors frequently display overexpression of p19ARF (p19) and p16INK4a (p16), correlating with hypermethylation of a shared downstream region (exon 3) of the Cdkn2a locus (11). The relevance of this event to human prostate cancer is supported by the prior observation that p16 gene up-regulation and downstream hypermethylation also occur in human prostate cancer (14). Using Restriction Landmark Genomic Scanning (RLGS), we identified several other genes that were hypermethylated in downstream regions in TRAMP relative to normal prostate, suggesting that this phenomenon may be widespread (11). Previous work in other systems has also reported hypermethylation of actively transcribed downstream gene regions in cancer (14-16). However, it remains unclear whether gene overexpression in cancer occurs prior or subsequent to downstream DNA hypermethylation.
In the current study we sought to define the relationship between disease stage, Dnmt expression, DNA hypermethylation, and DNA hypomethylation in prostate cancer. For this purpose, we selected TRAMP prostate samples from four distinct groups (prostatic intraepithelial neoplasia (PIN), well-differentiated tumors (WD), early poorly differentiated tumors (EPD), and late poorly differentiated tumors (LPD)) for analysis, for comparison to non-transgenic strain matched normal mouse prostates. In each sample set we measured Dnmt1, Dnmt3a, and Dnmt3b protein expression by Western blot, locus-specific methylation using RLGS, and global methylation using Liquid Chromatography-Mass Spectrometry (LC-MS) detection of 5-methyldeoxycytidine (5mdC), and bisulfite pyrosequencing of the B1 repetitive element. In addition, we examined the relationship between gene overexpression and downstream hypermethylation in TRAMP, via comparative mRNA expression and DNA methylation analysis of p16INK4a, p19ARF, and Cacna1a in staged tumor samples. We also performed statistical correlation analyses to determine the association between each of these parameters during tumor progression. Our findings reveal key aspects of the relationship between distinct alterations of the DNA methylation pathway occurring during prostate tumor progression.
Results
Multi-stage Prostate Cancer (CaP) Progression in TRAMP
We utilized prostate tumors from TRAMP mice, as well as normal prostates from non-transgenic, strain-matched mice (Fig. 1A). We grouped TRAMP samples based on differentiation status, age, and prostate weight into four categories: Prostatic Intraepithelial Neoplasia (PIN, 10-12 weeks, 0.008-0.04 gm, n = 35), well-differentiated tumors (WD, 15-20 weeks, 0.03-0.09 gm, n = 25), early poorly-differentiated tumors (EPD, 15-20 weeks, 0.49-4.86 gm, n = 12), and late poorly-differentiated tumors (LPD, 22-28 weeks, 1.65-15.65 gm, n = 12) (Fig. 1A). This grouping is based on previous studies showing that age and prostate weight directly correlate with tumor progression in TRAMP (17). PIN samples are normal in weight, but microscopically display neoplasia and hyperplastic infolding of the epithelial layer into the luminal space of the gland (Fig. 1, A and B). WD samples are larger than normal prostates, but were not palpable at necropsy. The majority of the disease in these samples is well differentiated glandular epithelium (Fig. 1B). EPD samples are from the same age range as WD samples (15-20 weeks), but were palpable at necropsy and histologically demonstrated predominantly sheets of poorly differentiated epithelial cells (Fig. 1, A and B). LPD tumors, from 20-28 week old mice, were very large and show poorly differentiated late stage disease (Fig. 1, A and B). Hematoxylin and eosin (H&E) staining was used to stage a large subset of samples and confirmed the assigned groupings (Fig. 1B and data not shown).
FIGURE 1.
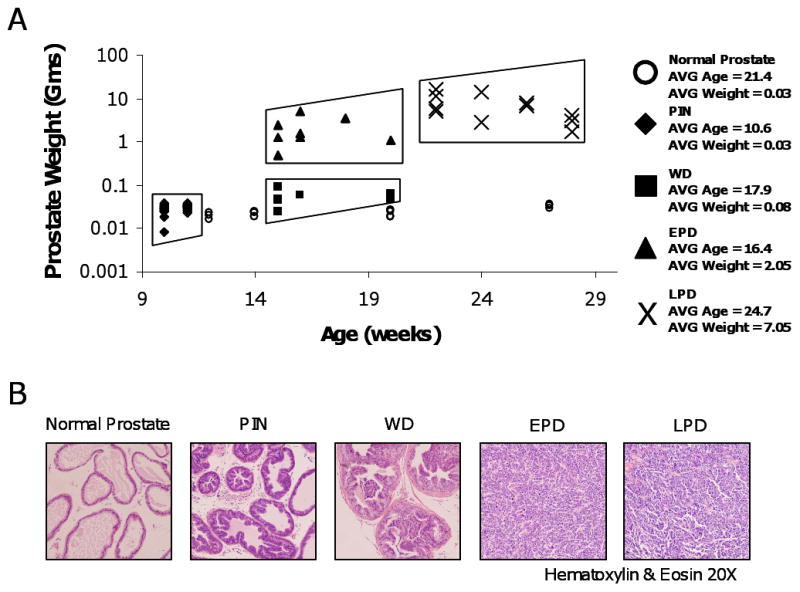
TRAMP sample grouping and histology. A. Age and weight of TRAMP samples. TRAMP sample groups and age and weight ranges are as follows: Prostatic Intraepithelial Neoplasia (PIN, 10-12 weeks, 0.008-0.04 gms), Well Differentiated (WD, 15-20 weeks, 0.03-0.09 gms), Early Poorly Differentiated Tumors (EPD, 15-20 weeks, 0.49-4.86 gms), and Late Poorly Differentiated Tumors (LPD, 22-28 weeks, 1.65-15.65 gms). Normal strain-matched prostates were uniformly small regardless of age. The sample key is shown on right. B. Representative H&E staining of each sample group.
Dnmt protein expression during multi-stage CaP progression
We initially examined Dnmt1, Dnmt3a, and Dnmt3b protein expression in normal prostates and the four sets of TRAMP samples described above using Western blot analysis. Dnmt1 expression is significantly elevated in PIN and WD and its level increases further in late stage (EPD and LPD) samples (Fig. 2A and B). Dnmt3a and Dnmt3b show small increases in PIN and WD, which increases further in EPD and LPD tumors (Fig. 2A, C-D). As Dnmt expression is cell cycle regulated with high level expression restricted to S phase (18), we next measured Cyclin A to normalize Dnmt expression. Notably, Cyclin A expression is increased only in late stage (EPD and LPD) disease (Fig. 2A and E), suggesting that the increased expression of Dnmt proteins seen in PIN and WD is not related to increased cell proliferation. After normalization of Dnmt protein expression to Cyclin A, expression of all three Dnmts are elevated in early stage lesions (PIN and WD) relative to normal prostate, but not in late stage tumors (EPD and LPD) (Fig. 2F). These data suggest that increased Dnmt protein expression in TRAMP may be most biologically significant in the early stages of prostate cancer.
FIGURE 2.
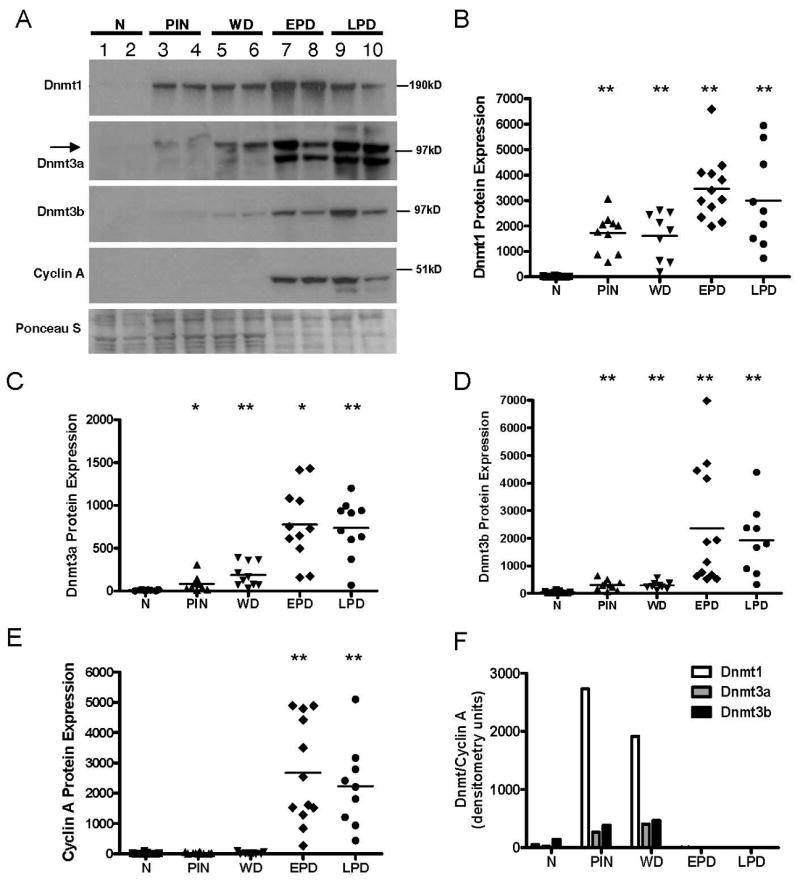
Dnmt protein overexpression during TRAMP tumor progression. A. Representative Western blot images of Dnmt1, Dnmt3a, Dnmt3b, and Cyclin A in normal prostates (N) and TRAMP samples (PIN, WD, EPD, and LPD). The arrow on the Dnmt3a blot indicates the position of Dnmt3a (upper band), as determined by Western analysis of cell lines containing a genetic disruption of Dnmt3a (data not shown). Representative Ponceau S total protein staining is shown, and served as a loading control. B-E. Densitometric quantification of Dnmt1, Dnmt3a, Dnmt3b, and Cyclin A Western blots, showing all analyzed samples. Y-axes show protein densitometry units. Dots represent individual samples and horizontal bars indicate the mean of each sample group. Mann-Whitney test p-values: ** p < 0.005; * p < 0.01, for each group compared to normal prostate. (F) Dnmt1, 3a, and 3b protein expression normalized to Cyclin A. Protein densitometry units (mean of each group) are plotted.
Locus-specific DNA hypermethylation during multi-stage CaP progression
We next utilized RLGS to examine global CpG island methylation patterns in TRAMP samples of each progression stage. RLGS is a two-dimensional gel analysis of radio-labeled, methylation sensitive enzyme-restricted DNA fragments (19). When comparing RLGS gel patterns, spot loss and spot gain correspond to DNA hypermethylation and DNA hypomethylation events, respectively. RLGS allowed for the identification of hypermethylation events in TRAMP which, in the vast majority of instances, were confined to late stage (EPD or LPD) disease (examples shown in Fig. 3A and B). A low level of both hypermethylation and hypomethylation events were observed in PIN and WD samples, while EPD and LPD tumors showed a substantial increase in hypermethylation events (Fig. 3C and D). In addition, the number of hypermethylated loci from tumor to tumor was variable within the EPD, and particularly the LPD, groups (Fig. 3D). We identified the genes corresponding to different RLGS spots using cloning techniques described previously (20) (Table 1). A number of these loci were hypermethylated at high frequency in EPD and LPD (Table 1), suggesting that methylation of these loci are under positive selection during prostate cancer progression in TRAMP.
FIGURE 3.
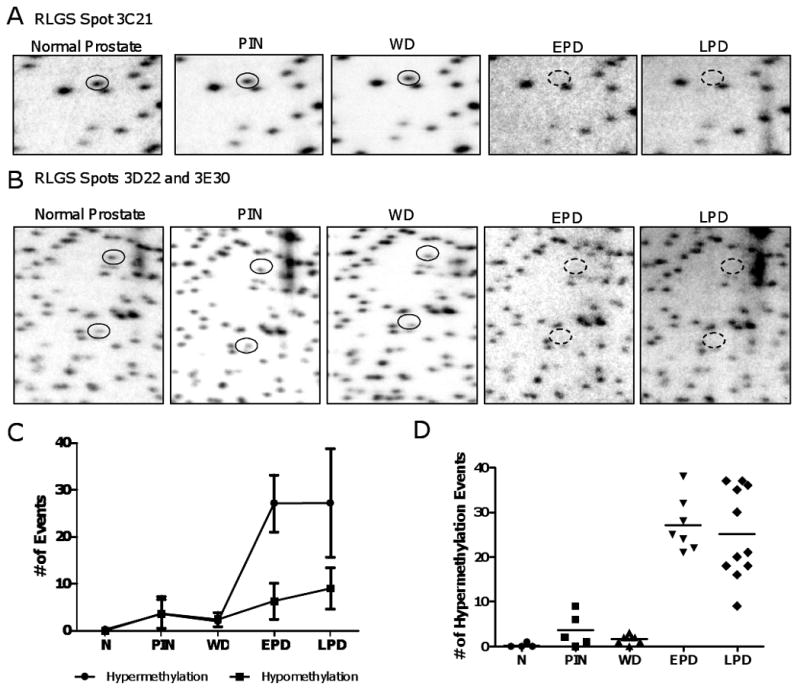
Locus-specific DNA hypermethylation during TRAMP tumor progression. A. RLGS analysis showing Spot 3C21, corresponding to Nrnx2 (solid circle). The dashed circle illustrates the position of spot loss (hypermethylation event), seen exclusively in the EPD and LPD samples. B. RLGS analysis showing Spots 3D22 (upper spot) and 3E30 (lower spot), corresponding to Cdkn2a and Gsc, respectively (solid circles). The dashed circles illustrate the position of spot loss (hypermethylation events), seen exclusively in the EPD and LPD samples. C. RLGS spot losses (hypermethylation events) and RLGS spot gains (hypomethylation events) in each sample group. Error bars indicate +/- 1 SD. D. Hypermethylation events in each sample analyzed by RLGS. Dots represent individual samples and horizontal bars indicate the mean of each sample group.
Table 1.
RLGS spot loss in TRAMP samples
| Number of times hypermethylated (%) | |||||||
|---|---|---|---|---|---|---|---|
| Spot ID | PIN n = 5 |
WD n = 6 |
EPD n = 7 |
LPD n = 14 |
Gene Name | Gene Context of NotI Site | NotI Site in CpG Island |
| 3D22 | 0 (0) | 0 (0) | 7 (100) | 14 (100) | Cdkn2a | 3′ end | n |
| 4C13 | 0 (0) | 0 (0) | 5 (71) | 13 (93) | AK039621 | 5′end | y |
| 3D67 | 0 (0) | 0 (0) | 6 (86) | 12 (86) | Oprd1 | 3′ end | y |
| 3C21 | 0 (0) | 0 (0) | 6 (86) | 10 (71) | Nrxn2 | 5′ end | y |
| 4C31 | 0 (0) | 0 (0) | 7 (100) | 10 (71) | Adcy5 | Body | n |
| 3E30 | 0 (0) | 0 (0) | 7 (100) | 10 (71) | Gsc | 3′ end | y |
| 2G63 | 0 (0) | 0 (0) | 6 (86) | 10 (71) | BC051947 | Body | y |
| 2C28 | 1 (20) | 4 (67) | 3 (43) | 9 (64) | AK004006 | 5′end | y |
| 5F09 | 0 (0) | 0 (0) | 3 (43) | 9 (64) | Cacna1a | 3′ end | n |
| 5B30 | 0 (0) | 0 (0) | 5 (71) | 8 (57) | ARHGEF17 | 5′end | y |
| 2B37 | 0 (0) | 0 (0) | 1 (14) | 7 (50) | Ptprs | Body | y |
| 4C01 | 0 (0) | 0 (0) | 2 (29) | 7 (50) | AK044818 | 5′end | y |
| 6C17 | 0 (0) | 0 (0) | 1 (14) | 6 (43) | Foxd3 | 5′ end | y |
| 4D27 | 0 (0) | 0 (0) | 0 (0) | 6 (43) | Hoxa2 | 5′ end | y |
| 4C11 | 0 (0) | 0 (0) | 3 (43) | 6 (43) | 4932416N17Rik | Body | n |
| 5D52 | 0 (0) | 0 (0) | 0 (0) | 5 (36) | Zar1 | 5′ end | y |
| 2D39 | 0 (0) | 0 (0) | 0 (0) | 5 (36) | CG869761 | 5′end | y |
| 4C17 | 0 (0) | 0 (0) | 3 (43) | 5 (36) | Lhfpl4 | 5′end | y |
| 2D21 | 0 (0) | 0 (0) | 1 (14) | 5 (36) | BC025575 | 3′end | y |
| 4G73 | 0 (0) | 0 (0) | 2 (29) | 5 (36) | Irx3 | 5′end | y |
| 4C38 | 0 (0) | 0 (0) | 1 (14) | 4 (29) | Lhfpl4 | 5′end | y |
| 3D36 | 0 (0) | 0 (0) | 1 (14) | 4 (29) | Lmln | 5′ end | y |
Downstream hypermethylation and increased gene expression
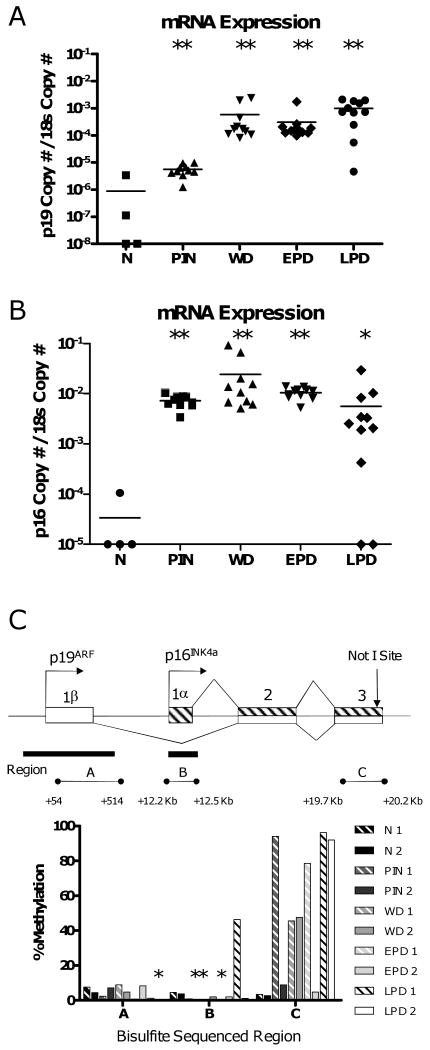
We previously reported that overexpression of p19 and p16 correlated with the downstream hypermethylation at the shared exon 3 of the Cdkn2a locus in late stage TRAMP tumors (11). Several other genes also display hypermethylation in downstream regions in TRAMP tumors, providing further evidence of the potential importance of this phenomenon (Table 1). The staged progression model we describe here allows for an investigation of the relative timing of gene overexpression and downstream hypermethylation. We find that p19 and p16 are over-expressed in all stages analyzed, as compared to normal prostate, indicating that overexpression is an early event (Fig. 4A and B). In contrast, RLGS indicated that hypermethylation of the NotI site at exon 3 of the Cdkn2a locus was exclusively found in late stage (EPD and LPD) samples (Table 1). In addition, bisulfite sequencing indicated that TRAMP tumors sometimes fail to show Cdkn2a exon 3 hypermethylation, despite the fact that overexpression is uniformly observed in these lesions (Fig. 4C). These data suggest that gene overexpression precedes downstream hypermethylation at the Cdkn2a locus during tumor progression. Moreover, we find that downstream hypermethylation at the Cdkn2a locus in TRAMP is not accompanied by hypermethylation at the p16 promoter, and only rarely with hypermethylation at the p19 promoter (Fig. 4C).
FIGURE 4.
Downstream hypermethylation and increased expression of Cdkn2a genes during TRAMP tumor progression. Expression of p19ARF (A) and p16INK4a (B) in normal prostates and TRAMP tumor samples. mRNA copy number is normalized relative to 18s rRNA copy number. Dots represent individual samples and horizontal bars indicate the mean of each sample group. Mann-Whitney test p-values: ** p < 0.006; * p < 0.05, for each group compared to normal prostate. C. Top: diagram of the Cdkn2a locus. Open rectangles, p19 exons; hashed rectangles, p16 exons; lines, introns; right arrows, transcriptional start sites; vertical arrow, position of the NotI site identified by RLGS; black rectangles, CpG islands; horizontal line with circles (A-C), regions analyzed by sodium bisulfite sequencing. Bottom: sodium bisulfite sequencing data of regions A-C in normal prostate and TRAMP samples. Percent methylation (averaged over the entire sequenced region), from at least ten sequenced clones per sample, is plotted. Asterisks are shown above samples that displayed ≤ 1 % methylation.
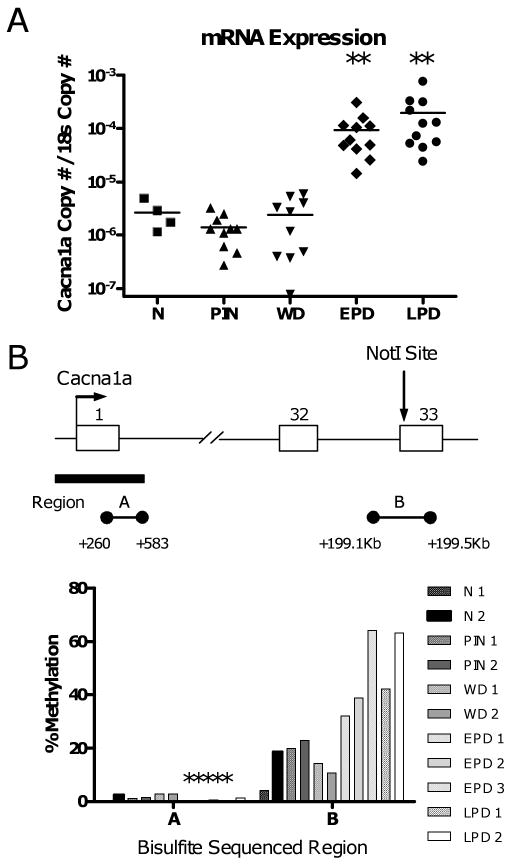
To investigate this phenomenon at a distinct locus, we measured the expression and methylation of the calcium channel gene Cacna1a, which is frequently methylated in a 3′ region (exon 33) in TRAMP (Table 1). Cacna1a is overexpressed only in late stage (EPD and LPD) tumors, paralleling its exclusive methylation in these stages (Fig. 5A, Table 1). Notably, overexpression occurred in all late stage (EPD and LPD) samples, while downstream hypermethylation occurred only in approximately half of these samples (Fig. 5A, Table 1). Bisulfite sequencing further demonstrated that this downstream region of Cacna1a, but not its promoter region, is methylated in TRAMP (Fig. 5B). Taken together, these data suggest that, similar to Cdkn2a genes, overexpression of Cacna1a precedes its downstream hypermethylation. Interestingly, a low but significant level of methylation at the Cacna1a locus was seen in both normal prostates and early stage samples (Fig. 5B). This situation may be analogous to certain genes that are partially methylated in normal human prostate and become hypermethylated in human prostate cancer (21).
FIGURE 5.
Downstream hypermethylation and increased expression of Cacna1a during TRAMP tumor progression. A. Expression of Cacna1a in normal prostates and TRAMP tumor samples. mRNA copy number is normalized relative to 18s rRNA. Dots represent individual samples and horizontal bars indicate the mean of each sample group. Mann-Whitney test p-value: ** p < 0.006, for each group compared to normal prostate. B. Top: diagram of the Cacna1a locus. Right arrow, transcriptional start site; open rectangles, exons; lines, introns; vertical arrow, position of the NotI site identified by RLGS; black bar, CpG island; horizontal line with circles (A and B), regions analyzed by sodium bisulfite sequencing. Bottom: sodium bisulfite sequencing data of regions A and B in normal prostate and TRAMP samples. Percent methylation (averaged over the sequenced entire region), from at least ten sequenced clones per sample, is plotted. Asterisks are shown above samples that displayed ≤ 1 % methylation.
DNA hypomethylation during multi-stage CaP progression
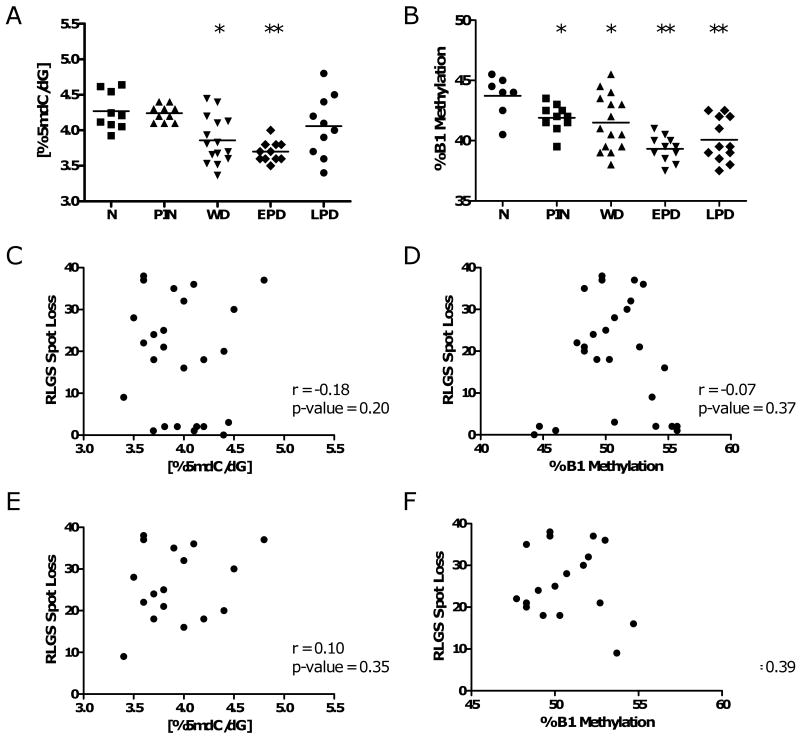
In addition to gene specific DNA hypermethylation, global DNA hypomethylation contributes to oncogenesis (22-24). In TRAMP, we previously found increased variability but no consistent changes in 5mdC levels in late stage TRAMP tumors and metastases as compared to normal strain-matched prostates (11). We hypothesized that global hypomethylation may be an early event during TRAMP tumor development that could have been missed in our previous study. To test this hypothesis, we measured 5mdC levels by LC-MS as well as the methylation level of the common murine repetitive element B1 using quantitative bisulfite pyrosequencing, in the four stages of TRAMP samples described earlier (Fig 1A). 5mdC levels were significantly decreased in WD and EPD tumors (Fig. 6A). At the latest stage, LPD, this effect was lost; however increasing variability from tumor to tumor was apparent (Fig 6A). In contrast to 5mdC levels, the B1 repetitive element is significantly hypomethylated in all four progression stages measured, but more dramatically in the later stages (Fig. 6B). Analyzed over the entire data set, 5mdC levels directly correlated with B1 methylation (one-tailed Spearman Rank Correlation, r = 0.30, P = 0.0214). These experiments demonstrate that genomic DNA hypomethylation occurs as an early event during prostate tumorigenesis in TRAMP, and persists and/or increases in advanced stages.
FIGURE 6.
DNA hypomethylation during TRAMP tumor progression. A. 5mdC levels in normal prostates and TRAMP samples. 5mdC levels were determined by LC-MS as described in the Materials and Methods. Sample groups are the same as described in Fig. 1A. Dots represent individual samples and horizontal bars indicate the mean of each sample group. Mann-Whitney test p-values: ** p < 0.005; * p < 0.05, for each group compared to normal prostate. B. B1 methylation in normal prostates and TRAMP samples. Methylation of the mouse B1 repetitive element was determined by quantitative bisulfite pyrosequencing as described in the Materials and Methods. Dots represent individual samples and horizontal bars indicate the mean of each sample group. Mann-Whitney test p-values: ** p < 0.005; * p < 0.05, for each group compared to normal prostate. Correlation analysis of RLGS hypermethylation events with global 5mdC levels or B1 repetitive element methylation in all TRAMP samples (C and D), or specifically in late stage (EPD and LPD) samples (E and F). Spearman rank order correlation coefficients (r values) and P values are shown.
Relationship between DNA methylation pathway alterations in TRAMP
We next took advantage of this unique data set to examine the relationship between Dnmt protein expression, DNA hypermethylation, and DNA hypomethylation during prostate tumorigenesis. To examine the link between DNA hypermethylation and DNA hypomethylation, we compared the extent of RLGS spot loss to 5mdC levels or B1 element methylation status in all samples (Fig. 6C and D). Interestingly, we found no association between DNA hypermethylation and either parameter of global DNA hypomethylation, suggesting that hyper- and hypomethylation are independently controlled in TRAMP. The lack of association was maintained when only late stage (EPD and LPD) samples, which show a much higher incidence of DNA hypermethylation (Fig 3), were analyzed (Fig. 6E and F). Finally, we compared Dnmt1, Dnmt3a, and Dnmt3b protein expression to DNA hypermethylation and DNA hypomethylation. Because both protein and DNA could not be obtained from the same PIN sample, only WD, EPD, and LPD samples were part of this analysis. Expression of Dnmt3a and 3b did not correlate with either DNA hypermethylation or DNA hypomethylation (data not shown). In contrast, Dnmt1 expression showed a borderline significant correlation with DNA hypermethylation (two-tailed Spearman rank order correlation P = 0.0546), but not with DNA hypomethylation (data not shown).
Discussion
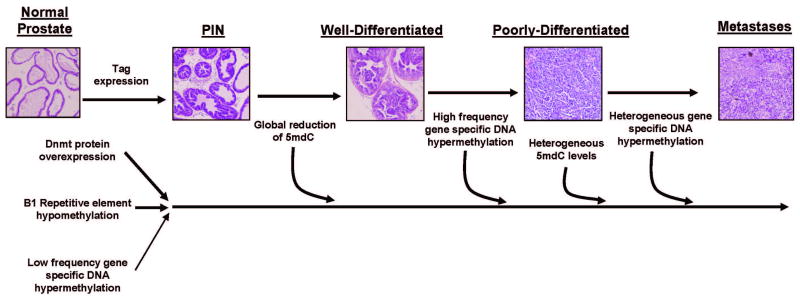
We have utilized the TRAMP model to elucidate the nature and the temporal relationship of distinct DNA methylation pathway alterations occurring during prostate cancer development. A unified model encompassing the data presented here, as well that of our previous work (11, 13), is shown in Fig 7. At the earliest stage analyzed, PIN, a number of alterations are already detected, including Dnmt protein overexpression, hypomethylation of the B1 repetitive DNA element and, to a far lesser extent, gene-specific DNA hypermethylation (Fig. 7). 5mdC loss is substantial at the WD and EPD stages, but becomes highly heterogeneous later on (Fig. 7). DNA hypermethylation becomes highly prevalent only in late stage primary and metastatic tumors (Fig. 7). Similar to the heterogeneous 5mdC levels seen in late progression stages, there is increased heterogeneity of DNA hypermethylation events in metastatic lesions (Fig. 7).
FIGURE 7.
DNA methylation pathway alterations during prostate cancer progression in TRAMP. The timing and relative extent of distinct alterations in the DNA methylation pathway are shown. Details of the model are explained in the Discussion.
In general, we observed a lack of association between Dnmt expression, DNA hypermethylation, and DNA hypomethylation, suggesting that these three alterations largely make independent contributions to prostate cancer in TRAMP. The only exception to this was a borderline significant association between Dnmt1 expression and DNA hypermethylation (as determined by RLGS spot loss). This apparent association will be interesting to follow-up in studies utilizing more comprehensive analyses of global DNA hypermethylation. However, the general lack of a strong association between Dnmt overexpression and DNA hypermethylation is consistent with studies of ovarian and lung cancer (25, 26), and suggests that improper targeting of Dnmt proteins to specific loci, or positive selection of stochastic hypermethylation events, rather than increased Dnmt expression, may drive locus-specific DNA hypermethylation in prostate cancer. The former model is in agreement with previous studies showing that specific DNA motifs have an intrinsic propensity for aberrant DNA hypermethylation (27, 28).
In TRAMP, accumulating evidence suggests that aberrant DNA hypermethylation directly contributes to the disease progression. Treatment of TRAMP mice with the DNA methyltransferase inhibitor 5-aza-2′-deoxycytidine delays tumor progression, without altering the incidence of early stage disease (10). Consistent with this finding, we observe that very few aberrant locus specific hypermethylation events are detected in early stage tumors (PIN and WD), while a large number of these events are seen in late stage tumors (EPD and LPD). The fact that high frequency gene specific DNA hypermethylation occurs only at late stages of prostate cancer suggests that they may result from tumor selection and not simply transgene expression. This is in agreement with a recent study examining DNA hypermethylation in a murine lymphoma model, which found changes in DNA methylation only in late stage disease (29).
Increased expression of p19 and p16 occur as early as the PIN stage in TRAMP, while overexpression of Cacna1a occurs at later stage disease. For each gene, increased expression coincides with regional downstream DNA hypermethylation. It is intriguing that downstream hypermethylation of overexpressed genes occurs at several loci in TRAMP (Table 1). The relative timing of these two events in vivo, for the genes studied here, suggests that gene overexpression occurs prior to and may facilitate downstream hypermethylation. However, in preliminary studies we have observed that treatment of TRAMP cell lines with 5-aza-2′-deoxycytidine results in decreased expression of p19 and p16, coinciding with reduced downstream hypermethylation (data not shown). Taken together, these data appear to suggest that increased transcription facilitates downstream hypermethylation, which may then contribute to the maintenance of the transcriptionally active state. In vivo manipulation of DNA methylation levels in TRAMP mice will be required to adequately test this hypothesis. In any case, it is important to point out that p16 gene expression is also increased in human prostate cancer, in conjunction with hypermethylation of downstream regions (14), strongly supporting the relevance of our observations in the TRAMP model.
Significant reduction of global 5mdC occurs only in the WD and EPD stages; in contrast, the B1 element is hypomethylated at all stages, including PIN. This result suggests that DNA hypomethylation of certain genomic regions is an early event during prostate tumor progression but is not uniform across the entire methylome. In the context of murine intestinal tumorigenesis, Jaenisch and colleagues have shown that DNA hypomethylation accelerates the formation of early stage microadenomas, but dramatically inhibits the formation of macroscopic polyps (30). Our findings suggest that an analogous scenario could occur in murine prostate cancer, with hypomethylation contributing to tumor initiation and hypermethylation contributing to tumor progression. The increased heterogeneity of both hypo- and hypermethylation in late stage prostate disease in TRAMP suggests a general decrease in the fidelity of DNA methylation in these tumors, which may serve as a source of tumor heterogeneity.
In summary, we have utilized a progression stage model of prostate cancer to decipher the temporal relationship between the three chief DNA methylation pathway alterations in cancer. Key aspects of this model will allow for the examination of the role of specific epigenetic defects to prostate tumor development in vivo.
Materials and Methods
Animals and tissue samples
Fig. 1A summarizes the TRAMP samples used in this study. Normal prostate samples were obtained from f1 males generated by crosses of C57BL/6 and FVB strain mice. TRAMP prostate tissues were obtained from f1 males generated by crosses of C57BL/6 TRAMP males (homozygous for the Probasin-SV40 transgene) with wildtype FVB females. Thus, all TRAMP tumors were heterozygous for the transgene. All prostate and tumor tissues were microdissected at necropsy. Samples were flash frozen in liquid nitrogen, and stored at −80°C until use.
Hematoxylin and Eosin (H&E) Staining
Five micron thick tissue sections were cut from paraffin embedded blocks and mounted on slides. Slides were deparafinized and rehydrated with Xylene and graded alcohol and equilibrated with Tris-phosphate buffer. Samples were then stained with H&E, dehydrated through alcohol into xylene, and mounted with glass coverslips. Tissue sections were scored using a compound Olympus XI-50 microscope equipped with QCapture imaging software.
Western blot analysis
Nuclear proteins were extracted from mouse tissues using the Nuclear Extract kit (Pierce Biochemical, Rockland, IL). Protein concentrations were determined using the Lowry High system (BioRad, Hercules, CA). Western blots were completed as described previously (11). Dnmt1 was detected using the NB 100-264 rabbit polyclonal antibody (Novus Biologicals, Littleton CO). Dnmt3a was detected with ab14291 chicken polyclonal antibody (Abcam Inc., Cambridge, MA). Dnmt3b was detected using the NB 100-266 rabbit polyclonal antibody (Novus Biologicals). Cyclin A and E2F1 were detected using the sc-751 and sc-193 rabbit polyclonal antibodies, respectively (Santa Cruz Biotechnology, Santa Cruz, CA) and Tag was detected with monoclonal mouse SV-40 large T antigen antibody 554149 (BD Pharmingen, San Diego, CA). Band density was analyzed using the Personal Densitometer SI instrument and ImageQuant 5.2 software (Molecular Dynamics, Sunnyvale, CA).
Restriction Landmark Genomic Scanning (RLGS) and RLGS spot cloning
High molecular weight genomic DNA was isolated from TRAMP samples and non-transgenic control prostates as described previously (31). Individual tumor samples (∼75 mg of tissue) were used for DNA isolation and RLGS analysis. Normal prostate samples were segregated into four pools of 3-4 prostates to allow for isolation of sufficient high molecular weight DNA for RLGS. RLGS was performed as described previously (19). Hypermethylated genes in TRAMP were identified by RLGS spot cloning as described previously (20, 32).
Quantitative Reverse Transcriptase PCR (qRT-PCR)
RNA samples were extracted from mouse tissues and converted to cDNA as described previously (11). PCR reactions were conducted using qPCR SYBR MasterMix (Eurogentec, San Diego, CA) and the 7300 Real Time PCR System (Applied Biosystems, Foster City, CA). Primer sequences for analysis of p19, p16, Cacna1a and 18s rRNA expression were designed using the Primer3 web-based program and are available upon request. SYBR green absolute quantification analysis was used to determine target gene copy number, which was normalized to 18s rRNA.
Sodium Bisulfite Sequencing
Genomic DNAs were isolated using the Puregene kit (Gentra Systems) and sodium bisulfite conversion was performed using the EZ DNA Methylation Kit (Zymo Research). Sodium bisulfite sequencing primers were designed using MethPrimer (33) and are available upon request. Gradient PCR reactions were used to optimize annealing temperatures for each primer set. PCR products were directly cloned into the pTopoTA 4.1 vector (Invitrogen, Carlsbad, CA) and individual clones were sequenced at the RPCI Biopolymer core facility, using an ABI prism automated DNA sequencer. DNA sequence information was analyzed using Lasergene (DNASTAR Inc., Madison, WI). A minimum of 10 independent clones were sequenced per sample.
Determination of 5mdC levels
5mdC levels were determined using liquid chromatography-electrospray ionization quadrapole mass spectrometry (LC-MS) as described previously (34). Genomic DNAs were isolated using the Puregene DNA isolation kit (Gentra Systems) and 1 μg genomic DNA samples were digested using 4 units of Nuclease S1 (Fermentas). All samples were analyzed in duplicate.
B1 Repetitive Element Pyrosequencing
Genomic DNA isolation and sodium bisulfite conversion were completed as described above. A bisulfite pyrosequencing assay for the murine B1 element was performed as described previously (35), with slight modifications. The pyrosequencing primer (CpG 2) was utilized (35). Pyrosequencing of the purified single-stranded PCR product was accomplished using the PSQ HS96 Pyrosequencing System (Biotage AB, Uppsala, Sweden). The sequence analyzed contains 2 CpG sites (5′-CGAACTCAGAAATCCG-3′) and the mean methylation value of both sites was averaged for each sample. All samples were analyzed in duplicate.
Acknowledgments
We thank Ms. Ellen Karasik of the Foster lab and the Mouse Tumor Models Resource at RPCI for excellent technical assistance.
Grant Information: NIH R21CA128062 (ARK), NIH 5T32CA009072 (SRMK), DOD PC060354 (SRMK), NCI Center Grant CA16056 (Roswell Park Cancer Institute).
References
- 1.Feinberg AP, Tycko B. The history of cancer epigenetics. Nat Rev Cancer. 2004;4:143–53. doi: 10.1038/nrc1279. [DOI] [PubMed] [Google Scholar]
- 2.Jones PA, Baylin SB. The fundamental role of epigenetic events in cancer. Nat Rev Genet. 2002;3:415–28. doi: 10.1038/nrg816. [DOI] [PubMed] [Google Scholar]
- 3.Kang GH, Lee S, Lee HJ, Hwang KS. Aberrant CpG island hypermethylation of multiple genes in prostate cancer and prostatic intraepithelial neoplasia. J Pathol. 2004;202:233–40. doi: 10.1002/path.1503. [DOI] [PubMed] [Google Scholar]
- 4.Brooks JD, Weinstein M, Lin X, et al. CG island methylation changes near the GSTP1 gene in prostatic intraepithelial neoplasia. Cancer Epidemiol Biomarkers Prev. 1998;7:531–6. [PubMed] [Google Scholar]
- 5.Henrique R, Jeronimo C, Teixeira MR, et al. Epigenetic heterogeneity of high-grade prostatic intraepithelial neoplasia: clues for clonal progression in prostate carcinogenesis. Mol Cancer Res. 2006;4:1–8. doi: 10.1158/1541-7786.MCR-05-0113. [DOI] [PubMed] [Google Scholar]
- 6.Brothman AR, Swanson G, Maxwell TM, et al. Global hypomethylation is common in prostate cancer cells: a quantitative predictor for clinical outcome? Cancer genetics and cytogenetics. 2005;156:31–6. doi: 10.1016/j.cancergencyto.2004.04.004. [DOI] [PubMed] [Google Scholar]
- 7.Cho NY, Kim BH, Choi M, et al. Hypermethylation of CpG island loci and hypomethylation of LINE-1 and Alu repeats in prostate adenocarcinoma and their relationship to clinicopathological features. J Pathol. 2007;211:269–77. doi: 10.1002/path.2106. [DOI] [PubMed] [Google Scholar]
- 8.Schulz WA, Elo JP, Florl AR, et al. Genomewide DNA hypomethylation is associated with alterations on chromosome 8 in prostate carcinoma. Genes Chromosomes Cancer. 2002;35:58–65. doi: 10.1002/gcc.10092. [DOI] [PubMed] [Google Scholar]
- 9.Patra SK, Patra A, Zhao H, Dahiya R. DNA methyltransferase and demethylase in human prostate cancer. Molecular carcinogenesis. 2002;33:163–71. doi: 10.1002/mc.10033. [DOI] [PubMed] [Google Scholar]
- 10.McCabe MT, Low JA, Daignault S, Imperiale MJ, Wojno KJ, Day ML. Inhibition of DNA methyltransferase activity prevents tumorigenesis in a mouse model of prostate cancer. Cancer Res. 2006;66:385–92. doi: 10.1158/0008-5472.CAN-05-2020. [DOI] [PubMed] [Google Scholar]
- 11.Morey SR, Smiraglia DJ, James SR, et al. DNA methylation pathway alterations in an autochthonous murine model of prostate cancer. Cancer Res. 2006;66:11659–67. doi: 10.1158/0008-5472.CAN-06-1937. [DOI] [PubMed] [Google Scholar]
- 12.Zorn CS, Wojno KJ, McCabe MT, Kuefer R, Gschwend JE, Day ML. 5-aza-2′-deoxycytidine delays androgen-independent disease and improves survival in the transgenic adenocarcinoma of the mouse prostate mouse model of prostate cancer. Clin Cancer Res. 2007;13:2136–43. doi: 10.1158/1078-0432.CCR-06-2381. [DOI] [PubMed] [Google Scholar]
- 13.Camoriano M, Kinney SR, Moser MT, et al. Phenotype-specific CpG island methylation events in a murine model of prostate cancer. Cancer Res. 2008;68:4173–82. doi: 10.1158/0008-5472.CAN-07-6715. [DOI] [PMC free article] [PubMed] [Google Scholar]
- 14.Nguyen TT, Nguyen CT, Gonzales FA, Nichols PW, Yu MC, Jones PA. Analysis of cyclin-dependent kinase inhibitor expression and methylation patterns in human prostate cancers. Prostate. 2000;43:233–42. doi: 10.1002/(sici)1097-0045(20000515)43:3<233::aid-pros10>3.0.co;2-s. [DOI] [PubMed] [Google Scholar]
- 15.Jones PA. The DNA methylation paradox. Trends Genet. 1999;15:34–7. doi: 10.1016/s0168-9525(98)01636-9. [DOI] [PubMed] [Google Scholar]
- 16.Smith JF, Mahmood S, Song F, et al. Identification of DNA methylation in 3′ genomic regions that are associated with upregulation of gene expression in colorectal cancer. Epigenetics. 2007;2:161–72. doi: 10.4161/epi.2.3.4805. [DOI] [PubMed] [Google Scholar]
- 17.Kaplan-Lefko PJ, Chen TM, Ittmann MM, et al. Pathobiology of autochthonous prostate cancer in a pre-clinical transgenic mouse model. Prostate. 2003;55:219–37. doi: 10.1002/pros.10215. [DOI] [PubMed] [Google Scholar]
- 18.Robertson KD, Keyomarsi K, Gonzales FA, Velicescu M, Jones PA. Differential mRNA expression of the human DNA methyltransferases (DNMTs) 1, 3a and 3b during the G(0)/G(1) to S phase transition in normal and tumor cells. Nucleic Acids Res. 2000;28:2108–13. doi: 10.1093/nar/28.10.2108. [DOI] [PMC free article] [PubMed] [Google Scholar]
- 19.Costello JF, Smiraglia DJ, Plass C. Restriction landmark genome scanning. Methods. 2002;27:144–9. doi: 10.1016/s1046-2023(02)00067-1. [DOI] [PubMed] [Google Scholar]
- 20.Smiraglia DJ, Fruhwald MC, Costello JF, et al. A new tool for the rapid cloning of amplified and hypermethylated human DNA sequences from restriction landmark genome scanning gels. Genomics. 1999;58:254–62. doi: 10.1006/geno.1999.5840. [DOI] [PubMed] [Google Scholar]
- 21.Kwabi-Addo B, Chung W, Shen L, et al. Age-related DNA methylation changes in normal human prostate tissues. Clin Cancer Res. 2007;13:3796–802. doi: 10.1158/1078-0432.CCR-07-0085. [DOI] [PubMed] [Google Scholar]
- 22.Ehrlich M. DNA methylation in cancer: too much, but also too little. Oncogene. 2002;21:5400–13. doi: 10.1038/sj.onc.1205651. [DOI] [PubMed] [Google Scholar]
- 23.Eden A, Gaudet F, Waghmare A, Jaenisch R. Chromosomal instability and tumors promoted by DNA hypomethylation. Science. 2003;300:455. doi: 10.1126/science.1083557. [DOI] [PubMed] [Google Scholar]
- 24.Karpf AR, Matsui S. Genetic disruption of cytosine DNA methyltransferase enzymes induces chromosomal instability in human cancer cells. Cancer Res. 2005;65:8635–9. doi: 10.1158/0008-5472.CAN-05-1961. [DOI] [PubMed] [Google Scholar]
- 25.Ahluwalia A, Hurteau JA, Bigsby RM, Nephew KP. DNA methylation in ovarian cancer. II. Expression of DNA methyltransferases in ovarian cancer cell lines and normal ovarian epithelial cells. Gynecol Oncol. 2001;82:299–304. doi: 10.1006/gyno.2001.6284. [DOI] [PubMed] [Google Scholar]
- 26.Vallbohmer D, Brabender J, Yang D, et al. DNA methyltransferases messenger RNA expression and aberrant methylation of CpG islands in non-small-cell lung cancer: association and prognostic value. Clin Lung Cancer. 2006;8:39–44. doi: 10.3816/CLC.2006.n.031. [DOI] [PubMed] [Google Scholar]
- 27.Feltus FA, Lee EK, Costello JF, Plass C, Vertino PM. Predicting aberrant CpG island methylation. Proc Natl Acad Sci U S A. 2003;100:12253–8. doi: 10.1073/pnas.2037852100. [DOI] [PMC free article] [PubMed] [Google Scholar]
- 28.Feltus FA, Lee EK, Costello JF, Plass C, Vertino PM. DNA motifs associated with aberrant CpG island methylation. Genomics. 2006;87:572–9. doi: 10.1016/j.ygeno.2005.12.016. [DOI] [PubMed] [Google Scholar]
- 29.Opavsky R, Wang SH, Trikha P, et al. CpG island methylation in a mouse model of lymphoma is driven by the genetic configuration of tumor cells. PLoS Genet. 2007;3:1757–69. doi: 10.1371/journal.pgen.0030167. [DOI] [PMC free article] [PubMed] [Google Scholar]
- 30.Yamada Y, Jackson-Grusby L, Linhart H, et al. Opposing effects of DNA hypomethylation on intestinal and liver carcinogenesis. Proc Natl Acad Sci U S A. 2005;102:13580–5. doi: 10.1073/pnas.0506612102. [DOI] [PMC free article] [PubMed] [Google Scholar]
- 31.Blin N, Stafford DW. A general method for isolation of high molecular weight DNA from eukaryotes. Nucleic Acids Res. 1976;3:2303–8. doi: 10.1093/nar/3.9.2303. [DOI] [PMC free article] [PubMed] [Google Scholar]
- 32.Yu L, Liu C, Bennett K, et al. A NotI-EcoRV promoter library for studies of genetic and epigenetic alterations in mouse models of human malignancies. Genomics. 2004;84:647–60. doi: 10.1016/j.ygeno.2004.06.010. [DOI] [PubMed] [Google Scholar]
- 33.Li LC, Dahiya R. MethPrimer: designing primers for methylation PCRs. Bioinformatics. 2002;18:1427–31. doi: 10.1093/bioinformatics/18.11.1427. [DOI] [PubMed] [Google Scholar]
- 34.Song L, James SR, Kazim L, Karpf AR. Specific method for the determination of genomic DNA methylation by liquid chromatography-electrospray ionization tandem mass spectrometry. Anal Chem. 2005;77:504–10. doi: 10.1021/ac0489420. [DOI] [PubMed] [Google Scholar]
- 35.Jeong KS, Lee S. Estimating the total mouse DNA methylation according to the B1 repetitive elements. Biochem Biophys Res Commun. 2005;335:1211–6. doi: 10.1016/j.bbrc.2005.08.015. [DOI] [PubMed] [Google Scholar]


