

Abstract
Previously, we identified the regions of chromosomes 10q12–q31 and 15p16–q21 harbor quantitative trait loci (QTLs) for lumbar volumetric bone mineral density (vBMD) in female F2 rats derived from Fischer 344 (F344) × Lewis (LEW) and Copenhagen 2331 (COP) × Dark Agouti (DA) crosses. The purpose of this study is to identify the candidate genes within these QTL regions contributing to the variation in lumbar vBMD. RNA was extracted from bone tissue of F344, LEW, COP, and DA rats. Microarray analysis was performed using Affymetrix Rat Genome 230 2.0 Arrays. Genes differentially expressed among the rat strains were then ranked based on the strength of the correlation with lumbar vBMD in F2 animals derived from these rats. Quantitative PCR (qPCR) analysis was performed to confirm the prioritized candidate genes. A total of 285 genes were differentially expressed among all strains of rats with a false discovery rate less than 10%. Among these genes, 18 candidate genes were prioritized based on their strong correlation (r2 > 0.90) with lumbar vBMD. Of these, 14 genes (Akap1, Asgr2, Esd, Fam101b, Irf1, Lcp1, Ltc4s, Mdp-1, Pdhb, Plxdc1, Rabep1, Rhot1, Slc2a4, Xpo4) were confirmed by qPCR. We identified several novel candidate genes influencing spinal vBMD in rats.
Keywords: Lumbar vBMD, Gene expression, Microarray, QTLs, Osteoporotic fracture
Introduction
Osteoporosis is a common polygenic disorder with reduced bone mineral density (BMD) and increased susceptibility to fracture at multiple skeletal sites (Kanis et al. 1994). Spinal fracture is one of the most common osteoporotic fracture sites (Cooper et al. 1993; Huang et al. 1996; Leidig-Bruckner et al. 1997; Ray et al. 1997; Kado et al. 1999; Lips et al. 1999). The primary skeletal determinants of fracture risk are bone mineral density, structure, and strength (Arden et al. 1996; Garnero et al. 1996; Peacock et al. 2002; Stone et al. 2003; Ralston 2005). As much as 80% of the variability of BMD is due to the result of heritable factors (Peacock et al. 2002). Identification of genes underlying spinal bone mass will, thus, reveal valuable insight regarding the genetics of vertebral fracture risk.
Linkage studies in human and experimental animal models have identified several quantitative trait loci (QTLs) linked to spinal bone mass (Kaufman et al. 2008; Styrkarsdottir et al. 2003, 2008; Hsu et al. 2007; Ioannidis et al. 2007; Shen et al. 2004; Wilson et al. 2003; Deng et al. 2002; Karasik et al. 2002; Koller et al. 2000; Duncan et al. 1999; Devoto et al. 1998; Johnson et al. 1997). Although the identification of QTL is often straightforward, the task of identifying the causal gene(s) that underlies each QTL is extremely challenging. The main obstacle is narrowing the critical QTL region to a very small chromosomal segment containing only a few candidate genes that can then be tested further. To overcome this challenge, several strategies were undertaken, such as development of congenic animal strains, for the isolation of the QTL into a smaller chromosomal regions or the creation of recombinant inbred animal lines. However, in addition to the time and cost required for these breeding approaches, there is often still not enough resolution to detect the causal genes and variants.
Microarray-based expression analysis, a method for screening thousands of genes simultaneously, is a useful tool for gene discovery. This approach has already been successfully used in congenic strains (Aitman et al. 1999; Karp et al. 2000; Rozzo et al. 2001), suggesting that synthesis of information from multiple methods including QTL mapping and gene expression analyses might be tremendously valuable for comprehensive analysis of complex traits. Specifically, a strategy involving an integrative genetic approach combining linkage with genomic expression analysis in multiple inbred lines already used for QTL analysis could be an effective way to identify candidate genes. Such studies are difficult in humans but can be undertaken in animal models.
Previously, we showed that skeletal mass, structure, and strength varies among inbred strains of rats in a site-specific manner (Turner et al. 2001). We also demonstrated that despite similar body size, substantial variation exists in bone geometry and biomechanical properties among adult Fischer 344 (F344), Lewis (LEW), Copenhagen 2331 (COP), Dark Agouti (DA) rats (Turner et al. 2001). Subsequently, we have generated a large number of second filial (F2) female progeny derived from (F344 × LEW) and (COP × DA) crosses and detected QTLs influencing lumbar volumetric BMD (vBMD) (Koller et al. 2005, 2008). The QTLs with strongest linkage for spinal vBMD were detected within the regions of chromosomes (Chrs) 10 (q12–q31) and 15 (p16–q21) in F344 × LEW and COP × DA crosses, respectively. The purpose of this study was to narrow the list of candidate genes within these QTL regions contributing to the variation in spinal vBMD among F344, LEW, COP, and DA rats. We chose these rats because, at present, they are the only available rat models in which bone QTLs have been identified (Koller et al. 2005, 2008). In addition, we selected female rats for this study because our initial QTL analysis in F344 and LEW study (Koller et al. 2005) was done only in female rats; whereas, we included both male and female rats for QTL analysis in COP and DA study (Koller et al. 2008).
We used the data from microarray-based gene expression analyses to identify genes differentially expressed among F344, LEW, COP, and DA rats. These genes were then ranked based on the proportion of the variation in lumbar vBMD phenotype explained by the expression level of each gene. Subsequently, several candidate genes were prioritized from these genes whose expression was strongly correlated with lumbar vBMD among these inbred rats. In addition, the expression differences of these prioritized genes were confirmed using quantitative real-time polymerase chain reaction (qPCR). Furthermore, we analyzed the pathways among these confirmed genes based on their molecular function, biological process, and cellular component of the gene products. This analysis was performed using a structured network-based system (Ingenuity Pathway Analysis) already successfully used for various systems including bone (Calvano et al. 2005; Li et al. 2007).
Materials and methods
As described previously, lumbar phenotypes were obtained from 595 female F2 offspring derived from F344 and LEW progenitors and 423 female F2 offspring derived from COP and DA progenitors (Koller et al. 2005, 2008). At 26 weeks of age, the rats were euthanized, and lumbar vertebrae (L3–L5) were dissected out for densitometry analysis. Total vBMD (milligram per cubic centimeter) of the L5 were measured using a Norland Stratec XCT Research SA + pQCT machine as described previously (Koller et al. 2005, 2008). Genomic DNA was isolated from the rat spleen; genotyping was accomplished using microsatellite markers, and quantitative linkage analysis of L5 vBMD was performed as described previously (Koller et al. 2005, 2008).
RNA extraction and microarray analysis
Femora were harvested from 4-week-old F344, LEW, COP, and DA animals and were immediately frozen in liquid nitrogen and stored at −80°C until required. RNA from femoral bone tissue was extracted (n = 4 per strain) using Trizol (Invitrogen, Carlsbad, CA), followed by further purification using an RNeasy Mini Kit (Qiagen Inc., Valencia, CA) as described previously (Alam et al. 2008). RNA quality was determined using a 2100 Bioanalyzer (Agilent, Palo Alto, CA) and was quantified using a spectrophotometer (NanoDrop, Wilmington, DE, USA). For microarray analysis, 5 μg of total RNA from each sample was used, labeled, and hybridized to Affymetrix Rat Genome 230 2.0 GeneChips (Affymetrix, Santa Clara, CA) as described previously (Alam et al. 2008). Quality control for RNA and Affymetrix data was done as described previously (Alam et al. 2008).
Microarray data analysis and informatics
The images from each array were analyzed using Affymetrix GeneChip Operating System 1.2 software. Mapping of probe sets to chromosomal location was accomplished with data provided by Affymetrix. On chromosome 10, the region of interest (10q12–q31) was demarcated by the markers D10Rat80 (19.3 cm) and D10Rat124 (58.5 cm) and included 968 genes. On chromosome 15, the critical interval (15p16–q21) was between the markers D15Rat69 (3.9 cm) and D15Rat97 (41.3 cm) and harbored 437 genes. Among these genes, the identities of 285 differentially expressed genes (199 genes in the 10q12–q31 region and 86 genes in the 15p16–q21 region) were confirmed by comparing the target mRNA sequences on the Affymetrix Rat Genome 230 2.0 GeneChip with the National Center for Biotechnology Information (NCBI) GenBank database (http://www.ncbi.nlm.nih.gov/Genbank/). To increase power and decrease the false discovery rate (FDR), we only analyzed probe sets that were reliably detected on all of the microarrays, based upon the detection call generated by the Affymetrix Microarray Analysis Suite 5.0 algorithm (Benjamini and Hochberg 1995). FDR was calculated by the method of Benjamini and Hochberg (McClintick and Edenberg 2006). Probe sets were considered differentially expressed if the FDR was less than 10%. The microarray data set was submitted to the NCBI Gene Expression Omnibus (GEO) Express web portal (GEO accession number GSE 11180).
Quantitative real time PCR analysis
Five micrograms of total RNA (same RNA used for Affymetrix analysis) from each femoral bone tissue (n = 4 per strain) was reverse transcribed using Superscript III reverse transcription reagent for first strand cDNA synthesis (Invitrogen, CA). Eighteen strongly correlated (r2 > 0.90) candidate genes for lumbar vBMD were selected for verification of microarray data by qPCR analysis. All real-time PCR reactions contained the first-strand cDNA corresponding to 25 ng of total RNA. Real-time detection of PCR products was performed using ABI PRISM 7300 sequence detector (Applied Biosystem, CA) as described previously (Alam et al. 2008). Relative expression of mRNA was calculated based on a relative standard curve and normalized to beta-actin. All qPCR analysis used triplicates of each of four biological samples.
Statistics
The gene-wise p values for microarray analysis among all strains were calculated by ANOVA using the package Limma (Smyth 2004). Regression analysis for L5 vBMD was performed with the average gene expression level for the strain as the dependent variable and the L5 vBMD mean value in animals of that strain as the independent variable. The proportion of variation (r2 value) in the L5 vBMD means explained by the variation in gene expression was obtained using the statistical software package StatView (Abacus Concepts, Inc., Berkeley, CA).
Pathway analysis
The interactions between differentially expressed genes confirmed by qPCR for femur strength and all other genes were investigated using Ingenuity Pathway Analysis (IPA 5.0; Ingenuity Systems, Inc., Mountain View, CA) as described previously (Alam et al. 2008).
Results
Genetic loci for L5 vBMD on Chrs 10 and 15
Significant evidence of linkage of L5 vBMD was detected in the region of q12–q31 on Chr 10 in F344 × LEW F2 animals with a LOD score of 9.4 and in the region of p16–q21 on Chr 15 in COP × DA F2 animals with a LOD score of 10.5 (Fig. 1).
Fig. 1.

Linkage analysis for lumbar 5 vBMD for rat chromosome 10 (a) and 15 (b) in F344 × LEW and COP × DA crosses. While a large QTL for lumbar 5 vBMD was observed only on chromosome 10 (D10Rat80~D10Rat124) in F344 × LEW cross, a strong QTL for the same phenotype was observed only on chromosome 15 (D15Rat69~ D15Rat97) in COP × DA cross. LOD scores plotted on the y-axis vs the relative microsatellite markers location along chromosomes 10 and 15 on the x-axis
L5 vBMD as a function of genotypes
Genotypic means for L5 vBMD in the F344 × LEW and COP × DA F2 rats are summarized in Table 1. Since a QTL had been detected at marker D10Rat32, the mean values for the lumbar vBMD were significantly different between the F2 animals homozygous for the F344 (f/f) and LEW (l/l) F2 alleles. Despite the lack of a QTL in this region in the COP × DA F2 rats, the F2 animals homozygous for the COP (c/c) and the DA (d/d) alleles also had a significant difference in their mean lumbar vBMD. In contrast, at marker D15Rat117, significant differences in the mean values for the lumbar vBMD were observed between the c/c and d/d F2 genotypic groups and not the f/f and l/l F2 genotypic groups (Table 1).
Table 1.
Genotypic means for lumbar vBMD (milligram per cubic centimeter) on Chrs 10 and 15 in F344 × LEW and COP × DA F2 rats
| Chromosome | f/f | l/l | p value (f/f vs l/l) | c/c | d/d | p value (c/c vs d/d) |
|---|---|---|---|---|---|---|
| 10a | 755.08 ± 44.69 | 722.82 ± 46.56 | <0.0001 | 728.67 ± 37.03 | 744.70 ± 33.60 | 0.002 |
| 15b | 753.97 ± 50.27 | 746.47 ± 43.27 | 0.21 | 718.90 ± 35.44 | 751.24 ± 34.58 | <0.0001 |
F344 × LEW cross marker: D10Rat32 (44.1cM); COP × DA cross marker: D10Rat162 (43.02 cM)
F344 × LEW cross marker: D15Rat80 (21.06 cM); COP × DA cross marker: D15Rat117 (27.58 cM)
Microarray analysis for genes explaining lumbar vBMD phenotype
With a FDR less than 10%, microarray analysis identified a number of differentially expressed genes within the 10q12–q31 (n = 199 genes) and 15p16–q21 (n = 86 genes) regions among the F344, LEW, COP, and DA rats. The 15p16–q21 QTL for lumbar vBMD was not replicated in F344 × LEW cross; therefore, we excluded the 28 genes differentially expressed between these strains. Regression analysis were performed for the 199 genes in the 10q12–q31 region and the 58 genes in the 15p16–q21 region differentially expressed among these strains to test whether the gene expression in a particular inbred strain explained a substantial proportion of the variation (r2 > 0.50) in lumbar vBMD of F2 offspring from both the F344 × LEW and COP × DA crosses. A total of 81 genes, including 72 known genes (51 on Chr 10 and 21 on Chr 15; Tables 2 and 3) and nine predicted genes, were identified using this method. Among these 72 known genes, 18 genes (13 on Chr 10 and 5 on Chr 15) were ranked as having the highest priority because they were found to be strongly correlated (r2 > 0.90) with lumbar vBMD (Tables 2 and 3).
Table 2.
Differentially expressed genes (r2 > 0.5) for lumbar 5 vBMD in q12–q31 region on Chr 10 in F344, LEW, COP, and DA rats (prioritized genes (r2 > 0.90) are indicated in bold face)
| Gene symbol | Gene name | Lumbar 5 vBMD (r2) |
|---|---|---|
| Irf1 | Interferon regulatory factor 1 | 1.00 |
| Plxdc1 | Plexin domain containing 1 | 0.98 |
| Ube2i | Ubiquitin-conjugating enzyme E2I | 0.98 |
| Ltc4s | Leukotriene C4 synthase | 0.98 |
| Aurkb | Aurora kinase B | 0.98 |
| Akap1 | A kinase (PRKA) anchor protein 1 | 0.97 |
| G3bp1 | GTPase activating protein (SH3 domain) binding protein 1 | 0.97 |
| Rnps1 | Ribonucleic acid binding protein S1 | 0.96 |
| Rhot1 | Ras homolog gene family, member T1 | 0.96 |
| Asgr2 | Asialoglycoprotein receptor 2 | 0.95 |
| Rabep1 | Rabaptin, RAB GTPase binding effector protein 1 | 0.94 |
| Fam101b | Family with sequence similarity 101, member B | 0.93 |
| Slc2a4 | Solute carrier family 2 (facilitated glucose transporter), member 4 | 0.92 |
| Myh4 | Myosin, heavy chain 4, skeletal muscle | 0.89 |
| Ndel1 | Nuclear distribution gene E-like homolog 1 | 0.88 |
| Mgl1 | Macrophage galactose N-acetyl-galactosamine specific lectin 1 | 0.87 |
| Txndc17 | Thioredoxin domain containing 17 | 0.87 |
| Top2a | Topoisomerase (DNA) II alpha | 0.86 |
| Acaca | Acetyl-coenzyme A carboxylase alpha | 0.85 |
| Slfn8 | Schlafen 8 | 0.85 |
| Mtmr4 | Myotubularin related protein 4 | 0.84 |
| Unc45b | Unc-45 homolog B | 0.83 |
| Rnasek | Ribonuclease, RNase K | 0.83 |
| Ublcp1 | Ubiquitin-like domain containing CTD phosphatase 1 | 0.83 |
| Sar1b | SAR1 homolog B | 0.80 |
| Trappc1 | Trafficking protein particle complex 1 | 0.80 |
| Pigq | Phosphatidylinositol glycan anchor biosynthesis, class Q | 0.78 |
| Obscn | Obscurin, cytoskeletal calmodulin and titin-interacting RhoGEF | 0.77 |
| Alox12 | Arachidonate 12-lipoxygenase | 0.75 |
| Kif1c | Kinesin family member 1C | 0.74 |
| C1qbp | Complement component 1, q subcomponent binding protein | 0.73 |
| Gemin5 | Gem (nuclear organelle) associated protein 5 | 0.71 |
| Nola2 | Nucleolar protein family A, member 2 | 0.71 |
| Lasp1 | LIM and SH3 protein 1 | 0.71 |
| Acadvl | Acyl-coenzyme A dehydrogenase, very long chain | 0.70 |
| Ap1gbp1 | AP1 gamma subunit binding protein 1 | 0.70 |
| Rpl19 | Ribosomal protein L19 | 0.69 |
| Anxa6 | Annexin A6 | 0.68 |
| Cd68 | Cd68 molecule | 0.68 |
| Atp2a3 | ATPase, Ca++ transporting, ubiquitous | 0.62 |
| Epn2 | Epsin 2 | 0.60 |
| Narfl | Nuclear prelamin A recognition factor-like | 0.60 |
| Msi2 | Musashi homolog 2 | 0.59 |
| Lig3 | Ligase III, DNA, ATP-dependent | 0.58 |
| Unc119 | UNC-119 homolog | 0.58 |
| Elac2 | ElaC homolog 2 | 0.58 |
| Ppp2ca | Protein phosphatase 2 (formerly 2A), catalytic subunit, alpha isoform | 0.55 |
| Sap30l | SAP30-like | 0.55 |
| Mfap3 | Microfibrillar-associated protein 3 | 0.54 |
| Stub1 | STIP1 homology and U-Box containing protein 1 | 0.53 |
| Tob1 | Transducer of ErbB-2.1 | 0.53 |
Table 3.
Differentially expressed genes (r2 > 0.5) for lumbar 5 vBMD in p16–q21 region on Chr 15 in F344, LEW, COP, and DA rats (prioritized genes (r2 > 0.90) are indicated in bold face)
| Gene symbol | Gene name | Lumbar 5 vBMD (r2) |
|---|---|---|
| Esd | Esterase D/formylglutathione hydrolase | 0.97 |
| Xpo4 | Exportin 4 | 0.97 |
| Lcp1 | Lymphocyte cytosolic protein 1 | 0.94 |
| Pdhb | Pyruvate dehydrogenase (lipoamide) beta | 0.93 |
| Mdp-1 | Magnesium-dependent phosphatase 1 | 0.91 |
| Bmp4 | Bone morphogenetic protein 4 | 0.87 |
| Sucla2 | Succinate-CoA ligase, ADP-forming, beta subunit | 0.81 |
| Cdadc1 | Cytidine and dCMP deaminase domain containing 1 | 0.80 |
| Blk | B lymphoid tyrosine kinase | 0.79 |
| Mphosph8 | M-phase phosphoprotein 8 | 0.78 |
| Psme2 | Proteasome (prosome, macropain) 28 subunit, beta | 0.73 |
| Dusp13 | Dual specificity phosphatase 13 | 0.70 |
| Tox4 | TOX high mobility group box family member 4 | 0.68 |
| Bnip3l | BCL2/adenovirus E1B interacting protein 3-like | 0.65 |
| Ap1g2 | Adaptor protein complex AP-1, gamma 2 subunit | 0.63 |
| Sgcg | Sarcoglycan, gamma (dystrophin-associated glycoprotein) | 0.63 |
| Cebpe | CCAAT/enhancer binding protein (C/EBP), epsilon | 0.63 |
| Rpgrip1 | Retinitis pigmentosa GTPase regulator interacting protein 1 | 0.60 |
| Cab39l | Calcium binding protein 39-like | 0.60 |
| Txndc16 | Thioredoxin domain containing 16 | 0.57 |
| Pdlim2 | PDZ and LIM domain 2 | 0.54 |
Quantitative PCR analysis
Among the 18 prioritized candidate genes in Tables 2 and 3 (indicated in bold face), 14 were confirmed to have similar (r2 values ranging from 0.57 to 0.99) correlation with lumbar bone density by qPCR (Table 4).
Table 4.
R2 values from qPCR analysis for top 18 candidate genes for lumbar 5 vBMD within 10q12–q31 and 15p16–q21 regions on Chrs 10 and 15 in F344, LEW, COP, and DA rats (confirmed genes (r2 > 0.50) are indicated in bold face)
| Gene symbol | Gene name | Lumbar 5 vBMD (r2) | Rat location | Human synteny |
|---|---|---|---|---|
| Chromosome 10 | ||||
| Irf1 | Interferon regulatory factor 1 | 0.83 | 10q22 | 5q31.1 |
| Plxdc1 | Plexin domain containing 1 | 0.94 | 10q31 | 17q21.1 |
| Ube2i | Ubiquitin-conjugating enzyme E2I | 0.28 | 10q12 | 16p13.3 |
| Ltc4s | Leukotriene C4 synthase | 0.90 | 10q22 | 5q35 |
| Aurkb | Aurora kinase B | 0.12 | 10q24 | 17p13.1 |
| Akap1 | A kinase (PRKA) anchor protein 1 | 0.82 | 10q26 | 17q21–q23 |
| G3bp1 | GTPase activating protein (SH3 domain) binding protein 1 | 0.30 | 10q22 | 5q33.1 |
| Rnps1 | Ribonucleic acid binding protein S1 | 0.12 | 10q12 | 16p13.3 |
| Rhot1 | Ras homolog gene family, member T1 | 0.78 | 10q26 | 17q11.2 |
| Asgr2 | Asialoglycoprotein receptor 2 | 0.77 | 10q24 | 17p |
| Rabep1 | Rabaptin, RAB GTPase binding effector protein 1 | 0.57 | 10q24 | 17p13.2 |
| Fam101b | Family with sequence similarity 101, member B | 0.57 | 10q24 | 17p13.2 |
| Slc2a4 | Solute carrier family 2 (facilitated glucose transporter), member 4 | 0.73 | 10q24 | 17p13 |
| Chromosome 15 | ||||
| Esd | Esterase D/formylglutathione hydrolase | 0.97 | 15q11 | 13q14.1–q14.2 |
| Xpo4 | Exportin 4 | 0.99 | 15p12 | 13q11 |
| Lcp1 | Lymphocyte cytosolic protein 1 | 0.85 | 15q11 | 13q14.3 |
| Pdhb | Pyruvate dehydrogenase (lipoamide) beta | 0.78 | 15p14 | 3p21.1–p14.2 |
| Mdp-1 | Magnesium-dependent phosphatase 1 | 0.92 | 15p13 | 14q12 |
Pathway analysis
The 14 candidate genes that were confirmed by qPCR for lumbar bone density were mapped to pathways using IPA (Fig. 2). Among these genes, Plxdc1 was not identified by IPA for network analysis. In addition, three genes (Mdp-1, Rhot1, and Slc2a4) were not linked to the molecules within the same pathways. The remaining ten genes that were eligible for network analysis were directly or indirectly connected to interleukin 1 (IL1), transforming growth factor-β (TGF-β), growth hormone (GH) pathways (Fig. 2).
Fig. 2.
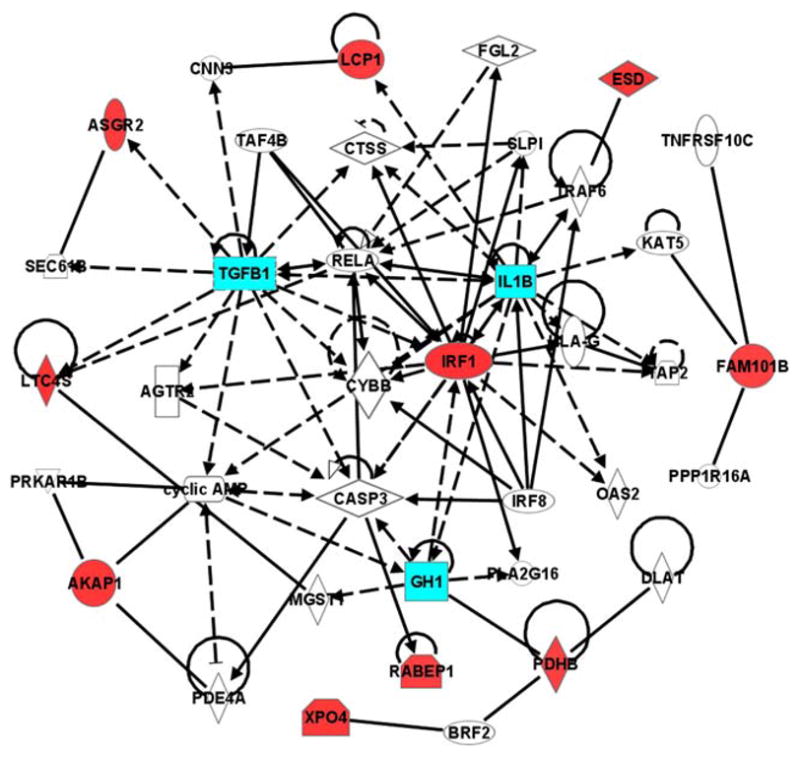
Network of ten candidate genes that were confirmed by qPCR for lumbar 5 vBMD in IPA. The well-known IL1, TGF-β, and GH pathways related to bone metabolism is highlighted in blue
Discussion
Our results demonstrate that the QTL regions within 10q12–q31 and 15p16–q21 harbor several candidate genes that were differentially expressed with lumbar bone mineral density in inbred F344, LEW, COP, and DA rats. Eighteen of these candidate genes were also found to be strongly correlated with lumbar density. qPCR analysis confirmed the expression differences for 14 of these 18 candidate genes. Pathway analysis identified networks of several growth factors and cytokines known to affect bone metabolism, including IL1, TGF-β, and growth hormone.
Genetic mapping for complex traits usually identifies chromosomal regions that are typically quite broad and contain many genes of small-to-moderate size effect. In many instances, subsequent chromosomal dissection to the fine-mapping or subcentimorgan resolution has been detected QTL with pleiotropic effect on different related phenotypes or a cluster of genes each contributing to phenotypic variation. Also, the alleles of two or more closely linked genes underlying a QTL might have similar or opposite effects. The 10q12–q31 and 15p16–q21 regions linked to lumbar bone density encompass a broad region of roughly 40 cm of the rat genome, harboring 968 and 437 potential genes, respectively. To narrow these regions and prioritize candidate genes for further analysis, we employed an integrative genetic approach combining linkage, gene expression, and physical traits. We analyzed the differential expression of these genes using Affymetrix microarray platform in F344, LEW, COP, and DA rats. We chose these strains of rats because, at present, these are the only available rat models in which bone QTLs have been identified (Koller et al. 2005, 2008). In addition, we used young (4-week old) rats rather than the adult (26-week old) rats in the gene expression study because gene expression is substantially suppressed in mature skeletons in adult rats. We targeted a rapid skeletal growth phase so the gene expression should reflect the accrual of bone toward peak bone mass obtained at 26 weeks and for which we detected QTLs. By comparing the genes differentially expressed among these rats, we were able to significantly reduce the number of candidate genes within these QTL regions. Using correlation analysis between gene expression and physical traits, we were able to reduce a list of 285 genes to a subset of 81 genes that were strongly correlated (r2 > 0.50) with lumbar vBMD (Tables 2 and 3). Furthermore, 18 genes were found to be correlated with more than 90% (r2 > 0.90) with lumbar vBMD.
Among these 18 candidate genes, 14 genes were confirmed to have similar strong correlations (R2 values ranging from 0.57 to 0.99) with the lumbar bone density by qPCR (Table 4). Surprisingly, four genes (Ube2i, Aurkb, G3bp1, and Rnps) that showed high correlations for lumbar vBMD by Affymetrix analysis were not confirmed by qPCR; the difference might relate to the probe location for the arrays at the 3′ end of the target gene. Among these genes, several of them have been found to affect bone metabolism: Irf1 has been shown to involve in apoptosis during bone tissue development (Lynch et al. 1998); Plxdc1 or tumor endothelial marker 7 is associated with metastasis of osteogenic sarcoma (Fuchs et al. 2007); Slc2a4 or Glut4 is involved in early as well as longitudinal bone growth (Maor and Karnieli 1999; Wang et al. 1999); Pdhb has been identified as phosphatase for Smad in the BMP pathway (Chen et al. 2006); and Esd is involved in a patient with adamantinoma of the long bones (Sozzi et al. 1990). Rabep1 is a novel fusion partner to platelet-derived growth factor beta receptor (Magnusson et al. 2001). As platelet-derived growth factor has been shown to regulate bone metabolism, Rabep1 might be involved in the molecular regulation of the same pathway. The role of the other candidate genes in bone metabolism has yet to be discovered. Further functional analysis using gene targeting such as knockout and transgenic strategies will be necessary to identify the role of these candidate genes in bone metabolism.
The pathway analysis among these 14 confirmed genes revealed networks directly or indirectly involved in controlling of multiple molecular functions such as cellular movement, growth and proliferation, cell-to-cell signaling and interaction, cellular function and maintenance, molecular metabolism and transport, and tissue development and apoptosis. Genes in the canonical pathways were related to amino acid biosynthesis and metabolism, and cyclic AMP-mediated, interferon, insulin receptor, and eicosanoid signaling. Interestingly, several molecules identified in these networks were already reported to have effect on bone metabolism (Fig. 2). Among them, TGF-β has been shown to affect both bone formation and resorption (Macdonald et al. 2007; Koseki et al. 2002; Zhou et al. 1995); GH has important role of bone mass regulation (Giustina et al. 2008; Olney 2003), and IL1 has role on osteoclast differentiation and inflammatory bone loss (Nakamura and Jimi 2006; Polzer et al. 2009). In addition, previous studies demonstrate that some of these 14 genes confirmed by qPCR are also regulated by the additional molecules identified in the network analysis. TGF-β modulates adenylate cyclase or cyclic AMP in osteoblast (Schneider et al. 1992). Also, TGF-β increases Ltc4s expression in monocyte cell line (Riddick et al. 1999), and inactivation of TAF4 stimulates TGF-β signaling in fibroblast (Mengus et al. 2005). While GH stimulates Irf1 expression in liver (Le Stunff and Rotwein 1998), IL1 has inhibitory effect on GH secretion (Wada et al. 1995). TRAF6 deficiency leads to osteopetrosis and defective IL1 signaling (Lomaga et al. 1999). In addition, IL1-β has been shown to modulate both TGF-β and PTHrP mRNA expression in human osteoblast-like cells (Tsai et al. 2000). Rabep 5 is involved in apoptosis through caspase 3 (CASP3)-mediated signaling (Swanton et al. 1999). The networks we discovered in this study might serve as a basis for further studies to unveil the molecular mechanism for the regulation of spinal bone mass.
The chromosomal region of the candidate genes for lumbar vBMD on Chrs 10 and 15 in rat are homologous to regions of mouse chromosomes 11, 14, and 17 and human chromosomes 3p, 5q, 13q, 14q, 16p, 17p, and 17q (Table 4). Linkage to mouse Chrs 11 and 14 was previously reported for spine BMD (Benes et al. 2000; Beamer et al. 2001). Also, the homologous region in human 3p21 (Wilson et al. 2003), 3p25 (Ioannidis et al. 2007), 13q21 (Hsu et al. 2007), and 14q21 (Karasik et al. 2002), 17q21–23 (Kaufman et al. 2008) was previously linked to spine BMD.
In this study, using an integrative genetic approach, we identified several candidate genes underlying the QTL regions of 10q12–q31 and 15p16–q21 that were differentially expressed and strongly correlated with spinal bone density in rats. We took an approach which is complementary to conventional strategies for the dissection of complex skeletal traits and will facilitate the QTL to gene discovery process. However, our approach has several limitations. The differentially expressed genes in femoral bone tissue might not reveal all genes influencing spinal bone mass although many common genes important in bone metabolism might have similar differential expression at different skeletal sites or even at nonskeletal tissues as it has been demonstrated in a recent study (Farber et al. 2009). Another limitation is that we used only female rats in this study and, thus, could not identify sex-specific candidate genes influencing spinal bone mass. In addition, gene expression analysis will not detect the alternative gene splicing, polymorphism in coding region affecting protein structure and function, or posttranslational modification of protein. Also, our approach could not isolate the genetic influences from other QTLs on the same or other chromosomes. Further studies involving the identification of the molecular mechanism by which the novel genes identified in this study regulating spinal bone mass is thus necessary for the development of drug to prevent and treat vertebral osteoporotic fractures.
Acknowledgments
This work was supported by the US National Institutes of Health through the following grants: RO1AR047822, P01AG018397, and AA10707. Microarray analysis was carried out in the Center for Medical Genomics at Indiana University School of Medicine, which is supported in part by the Indiana Genomics Initiative (INGEN®, supported in part by The Lilly Endowment Inc.).
Funding Source: US National Institutes of Health.
References
- Aitman TJ, Glazier AM, Wallace CA, Cooper LD, Norsworthy PJ, Wahid FN, Al-Majali KM, Trembling PM, Mann CJ, Shoulders CC, Graf D, St Lezin E, Kurtz TW, Kren V, Pravenec M, Ibrahimi A, Abumrad NA, Stanton LW, Scott J. Identification of Cd36 (Fat) as an insulin-resistance gene causing defective fatty acid and glucose metabolism in hypertensive rats. Nature Genet. 1999;21:76–83. doi: 10.1038/5013. [DOI] [PubMed] [Google Scholar]
- Alam I, Sun Q, Liu L, Koller DL, Liu L, Edenberg HJ, Econs MJ, Foroud T, Turner CH. Genomic expression analysis of rat chromosome 4 for skeletal traits at femoral neck. Physiol Genomics. 2008;35:191–196. doi: 10.1152/physiolgenomics.90237.2008. [DOI] [PMC free article] [PubMed] [Google Scholar]
- Arden NK, Baker J, Hogg C, Bann K, Spector TD. The heritability of bone mineral density, ultrasound of the calcaneus and hip axis length: a study of postmenopausal twins. J Bone Miner Res. 1996;11:530–534. doi: 10.1002/jbmr.5650110414. [DOI] [PubMed] [Google Scholar]
- Beamer WG, Shultz KL, Donahue LR, Churchill GA, Sen S, Wergedal JR, Baylink DJ, Rosen CJ. Quantitative trait loci for femoral and lumbar vertebral bone mineral density in C57BL/6J and C3H/HeJ inbred strains of mice. J Bone Miner Res. 2001;16:1195–1206. doi: 10.1359/jbmr.2001.16.7.1195. [DOI] [PubMed] [Google Scholar]
- Benes H, Weinstein RS, Zheng W, Thaden JJ, Jilka RL, Manolagas SC, Shmookler Reis RJ. Chromosomal mapping of osteopenia-associated quantitative trait loci using closely related mouse strains. J Bone Miner Res. 2000;15:626–633. doi: 10.1359/jbmr.2000.15.4.626. [DOI] [PubMed] [Google Scholar]
- Benjamini Y, Hochberg Y. Controlling the false discovery rate: a practical and powerful approach to multiple testing. J R Stat Soc (B) 1995;57:289–290. [Google Scholar]
- Calvano SE, Xiao W, Richards DR, Felciano RM, Baker HV, Cho RJ, Chen RO, Brownstein BH, Cobb JP, Tschoeke SK, Miller-Graziano C, Moldawer LL, Mindrinos MN, Davis RW, Tompkins RG, Lowry SF. A network-based analysis of systemic inflammation in humans. Nature. 2005;437:1032–1037. doi: 10.1038/nature03985. [DOI] [PubMed] [Google Scholar]
- Chen HB, Shen J, Ip YT, Xu L. Identification of phosphatases for Smad in the BMP/DPP pathway. Genes Dev. 2006;20:648–653. doi: 10.1101/gad.1384706. [DOI] [PMC free article] [PubMed] [Google Scholar]
- Cooper C, Atkinson EJ, Jacobsen SJ, O’Fallon WM, Melton LJ., 3rd Population-based study of survival after osteoporotic fractures. Am J Epidemiol. 1993;137:1001–1005. doi: 10.1093/oxfordjournals.aje.a116756. [DOI] [PubMed] [Google Scholar]
- Deng HW, Xu FH, Huang QY, Shen H, Deng H, Conway T, Liu YJ, Liu YZ, Li JL, Zhang HT, Davies KM, Recker RR. A whole-genome linkage scan suggests several genomic regions potentially containing quantitative trait loci for osteoporosis. J Clin Endocrinol Metab. 2002;87:5151–5159. doi: 10.1210/jc.2002-020474. [DOI] [PubMed] [Google Scholar]
- Devoto M, Shimoya K, Caminis J, Ott J, Tnenhouse A, Whyte MP, Sereda L, Hall S, Considine E, Williams CJ. First-stage autosomal genome screen in extended pedigrees suggests genes predisposing to low bone mineral density on chromosomes 1p, 2p and 4q. Euro J Human Genet. 1998;6:151–157. doi: 10.1038/sj.ejhg.5200169. [DOI] [PubMed] [Google Scholar]
- Duncan EL, Browon MA, Sinsheimer J, Bell J, Carr AJ, Wordsworth BP, Wass JA. Suggestive linkage of the parathyroid receptor type 1 to osteoporosis. J Bone Miner Res. 1999;14:1993–1999. doi: 10.1359/jbmr.1999.14.12.1993. [DOI] [PubMed] [Google Scholar]
- Farber CR, van Nas A, Ghazalpour A, Aten JE, Doss S, Sos B, Schadt EE, Ingram-Drake L, Davis RC, Horvath S, Smith DJ, Drake TA, Lusis AJ. An integrative genetics approach to identify candidate genes regulating BMD: combining linkage, gene expression, and association. J Bone Miner Res. 2009;24:105–116. doi: 10.1359/JBMR.080908. [DOI] [PMC free article] [PubMed] [Google Scholar]
- Fuchs B, Mahlum E, Halder C, Maran A, Yaszemski M, Bode B, Bolander M, Sarkar G. High expression of tumor endothelial marker 7 is associated with metastasis and poor survival of patients with osteogenic sarcoma. Gene. 2007;399:137–143. doi: 10.1016/j.gene.2007.05.003. [DOI] [PMC free article] [PubMed] [Google Scholar]
- Garnero P, Arden NK, Griffiths G, Delmas PD, Spector TD. Genetic influence on bone turnover in postmenopausal twins. J Clin Endocrinol Metab. 1996;81:140–146. doi: 10.1210/jcem.81.1.8550741. [DOI] [PubMed] [Google Scholar]
- Giustina A, Mazziotti G, Canalis E. Growth hormone, insulin-like growth factors, and the skeleton. Endocr Rev. 2008;29:535–559. doi: 10.1210/er.2007-0036. [DOI] [PMC free article] [PubMed] [Google Scholar]
- Hsu YH, Xu X, Terwedow HA, Niu T, Hong X, Wu D, Wang L, Brain JD, Bouxsein ML, Cummings SR, Rosen CJ, Xu X. Large-scale genome-wide linkage analysis for loci linked to BMD at different skeletal sites in extreme selected sibships. J Bone Miner Res. 2007;22:184–194. doi: 10.1359/jbmr.061015. [DOI] [PubMed] [Google Scholar]
- Huang C, Ross PD, Wasnich RD. Vertebral fracture and other predictors of physical impairment and health care utilization. Arch Intern Med. 1996;156:2469–2475. [PubMed] [Google Scholar]
- Ioannidis JP, Ng MY, Sham PC, Zintzaras E, Lewis CM, Deng HW, Econs MJ, Karasik D, Devoto M, Kammerer CM, Spector T, Andrew T, Cupples LA, Duncan EL, Foroud T, Kiel DP, Koller D, Langdahl B, Mitchell BD, Peacock M, Recker R, Shen H, Sol-Church K, Spotila LD, Uitterlinden AG, Wilson SG, Kung AW, Ralston SH. Meta-analysis of genome-wide scans provides evidence for sex- and site-specific regulation of bone mass. J Bone Miner Res. 2007;22:173–183. doi: 10.1359/jbmr.060806. [DOI] [PMC free article] [PubMed] [Google Scholar]
- Johnson ML, Gong G, Kimberling W, Reckér SM, Kimmel DB, Recker RB. Linkage of a gene causing high bone mass to human chromosome 11 (11q12–13) Am J Hum Genet. 1997;60:1326–1332. doi: 10.1086/515470. [DOI] [PMC free article] [PubMed] [Google Scholar]
- Kado DM, Browner WS, Palermo L, Nevitt MC, Genant HK, Cummings SR. Vertebral fractures and mortality in older women: a prospective study. Study of osteoporotic fractures research group. Arch Intern Med. 1999;159:1215–1220. doi: 10.1001/archinte.159.11.1215. [DOI] [PubMed] [Google Scholar]
- Kanis JA, Melton LJ, Christiansen C, Johnston CC, Khaltaev N. The diagnosis of osteoporosis. J Bone Miner Res. 1994;9:1137–1141. doi: 10.1002/jbmr.5650090802. [DOI] [PubMed] [Google Scholar]
- Karasik D, Myers RH, Cupples LA, Hannan MT, Gagnon DR, Herbert A, Kiel DP. Genome screen for quantitative trait loci contributing to normal variation in bone mineral density: the Framingham Study. J Bone Miner Res. 2002;17:1718–1727. doi: 10.1359/jbmr.2002.17.9.1718. [DOI] [PubMed] [Google Scholar]
- Karp CL, Grupe A, Schadt E, Ewart SL, Keane-Moore M, Cuomo PJ, Köhl J, Wahl L, Kuperman D, Germer S, Aud D, Peltz G, Wills-Karp M. Identification of complement factor 5 as a susceptibility locus for experimental allergic asthma. Nat Immunol. 2000;1:221–226. doi: 10.1038/79759. [DOI] [PubMed] [Google Scholar]
- Kaufman JM, Ostertag A, Saint-Pierre A, Cohen-Solal M, Boland A, Van Pottelbergh I, Toye K, de Vernejoul MC, Martinez M. Genome-wide linkage screen of bone mineral density (BMD) in European pedigrees ascertained through a male relative with low BMD values: evidence for quantitative trait loci on 17q21–23, 11q12–13, 13q12–14, and 22q11. J Clin Endocrinol Metab. 2008;93:3755–3762. doi: 10.1210/jc.2008-0678. [DOI] [PubMed] [Google Scholar]
- Koller DL, Econs MJ, Morin PA, Christian JC, Hui SL, Parry P, Curran ME, Rodriguez LA, Conneally PM, Joslyn G, Peacock M, Johnston CC, Foroud T. Genome screen for QTLs contributing to normal variation in bone mineral density and osteoporosis. J Clin Endocrinol Metab. 2000;85:3116–3120. doi: 10.1210/jcem.85.9.6778. [DOI] [PubMed] [Google Scholar]
- Koller DL, Alam I, Sun Q, Liu L, Fishburn T, Carr LG, Econs MJ, Foroud T, Turner CH. Genome screen for bone mineral density phenotypes in Fischer 344 and Lewis rats. Mammalian Genome. 2005;16:578–586. doi: 10.1007/s00335-004-2459-0. [DOI] [PubMed] [Google Scholar]
- Koller DL, Liu L, Alam I, Sun Q, Econs MJ, Foroud T, Turner CH. Linkage screen for BMD phenotypes in male and female COP and DA rat strains. J Bone Miner Res. 2008;23:1382–1388. doi: 10.1359/JBMR.080401. [DOI] [PMC free article] [PubMed] [Google Scholar]
- Koseki T, Gao Y, Okahashi N, Murase Y, Tsujisawa T, Sato T, Yamato K, Nishihara T. Role of TGF-beta family in osteoclastogenesis induced by RANKL. Cell Signal. 2002;14:31–36. doi: 10.1016/s0898-6568(01)00221-2. [DOI] [PubMed] [Google Scholar]
- Leidig-Bruckner G, Minne HW, Schlaich C, Wagner G, Scheidt-Nave C, Bruckner T, Gebest HJ, Ziegler R. Clinical grading of spinal osteoporosis: quality of life components and spinal deformity in women with chronic low back pain and women with vertebral osteoporosis. J Bone Miner Res. 1997;12:663–675. doi: 10.1359/jbmr.1997.12.4.663. [DOI] [PubMed] [Google Scholar]
- Le Stunff C, Rotwein P. Growth hormone stimulates interferon regulatory factor-1 gene expression in the liver. Endocrinology. 1998;139:859–866. doi: 10.1210/endo.139.3.5819. [DOI] [PubMed] [Google Scholar]
- Li X, Liu H, Qin L, Tamasi J, Bergenstock M, Shapses S, Feyen JH, Notterman DA, Partridge NC. Determination of dual effects of parathyroid hormone on skeletal gene expression in vivo by microarray and network analysis. J Biol Chem. 2007;282:33086–33097. doi: 10.1074/jbc.M705194200. [DOI] [PubMed] [Google Scholar]
- Lips P, Cooper C, Agnusdei D, Caulin F, Egger P, Johnell O, Kanis JA, Kellingray S, Leplege A, Liberman UA, McCloskey E, Minne H, Reeve J, Reginster JY, Scholz M, Todd C, de Vernejoul MC, Wiklund I. Quality of life in patients with vertebral fractures: validation of the Quality of Life Questionnaire of the European Foundation for Osteoporosis (QUALEFFO). Working Party for Quality of Life of the European Foundation for Osteoporosis. Osteoporos Int. 1999;10:150–160. doi: 10.1007/s001980050210. [DOI] [PubMed] [Google Scholar]
- Lomaga MA, Yeh WC, Sarosi I, Duncan GS, Furlonger C, Ho A, Morony S, Capparelli C, Van G, Kaufman S, van der Heiden A, Itie A, Wakeham A, Khoo W, Sasaki T, Cao Z, Penninger JM, Paige CJ, Lacey DL, Dunstan CR, Boyle WJ, Goeddel DV, Mak TW. TRAF6 deficiency results in osteopetrosis and defective interleukin-1, CD40, and LPS signaling. Genes Dev. 1999;13:1015–1024. doi: 10.1101/gad.13.8.1015. [DOI] [PMC free article] [PubMed] [Google Scholar]
- Lynch MP, Capparelli C, Stein JL, Stein GS, Lian JB. Apoptosis during bone-like tissue development in vitro. J Cell Biochem. 1998;68:31–49. [PubMed] [Google Scholar]
- Macdonald KK, Cheung CY, Anseth KS. Cellular delivery of TGFbeta1 promotes osteoinductive signalling for bone regeneration. J Tissue Eng Regen Med. 2007;1:314–317. doi: 10.1002/term.31. [DOI] [PubMed] [Google Scholar]
- Magnusson MK, Meade KE, Brown KE, Arthur DC, Krueger LA, Barrett AJ, Dunbar CE. Rabaptin-5 is a novel fusion partner to platelet-derived growth factor beta receptor in chronic myelomonocytic leukemia. Blood. 2001;98:2518–2525. doi: 10.1182/blood.v98.8.2518. [DOI] [PubMed] [Google Scholar]
- Maor G, Karnieli E. The insulin-sensitive glucose transporter (GLUT4) is involved in early bone growth in control and diabetic mice, but is regulated through the insulin-like growth factor I receptor. Endocrinology. 1999;140:1841–1851. doi: 10.1210/endo.140.4.6620. [DOI] [PubMed] [Google Scholar]
- McClintick JN, Edenberg HJ. Effects of filtering by present call on analysis of microarray experiments. BMC Bioinformatics. 2006;7:49. doi: 10.1186/1471-2105-7-49. [DOI] [PMC free article] [PubMed] [Google Scholar]
- Mengus G, Fadloun A, Kobi D, Thibault C, Perletti L, Michel I, Davidson I. TAF4 inactivation in embryonic fibroblasts activates TGFbeta signalling and autocrine growth. EMBO J. 2005;24:2753–2767. doi: 10.1038/sj.emboj.7600748. [DOI] [PMC free article] [PubMed] [Google Scholar]
- Nakamura I, Jimi E. Regulation of osteoclast differentiation and function by interleukin-1. Vitam Horm. 2006;74:357–3570. doi: 10.1016/S0083-6729(06)74015-8. [DOI] [PubMed] [Google Scholar]
- Olney RC. Regulation of bone mass by growth hormone. Med Pediatr Oncol. 2003;41:228–234. doi: 10.1002/mpo.10342. [DOI] [PubMed] [Google Scholar]
- Peacock M, Turner CH, Econs MJ, Foroud T. Genetics of osteoporosis. Endocr Rev. 2002;23:378–383. doi: 10.1210/edrv.23.3.0464. [DOI] [PubMed] [Google Scholar]
- Polzer K, Joosten L, Gasser J, Distler JH, Ruiz G, Baum W, Redlich K, Bobacz K, Smolen JS, van den Berg W, Schett G, Zwerina J. IL-1 is essential for systemic inflammatory bone loss. Ann Rheum Dis. 2009 doi: 10.1136/ard.2008.104786. (in press) [DOI] [PubMed] [Google Scholar]
- Ralston SH. Genetic determinants of osteoporosis. Curr Opin Rheumatol. 2005;17:475–479. doi: 10.1097/01.bor.0000166385.62851.92. [DOI] [PubMed] [Google Scholar]
- Ray NF, Chan JK, Thamer M, Melton LJ. Medical expenditures for the treatment of osteoporotic fractures in the United States in 1995: report from the National Osteoporosis Foundation. J Bone Miner Res. 1997;12:24–35. doi: 10.1359/jbmr.1997.12.1.24. [DOI] [PubMed] [Google Scholar]
- Riddick CA, Serio KJ, Hodulik CR, Ring WL, Regan MS, Bigby TD. TGF-beta increases leukotriene C4 synthase expression in the monocyte-like cell line, THP-1. J Immunol. 1999;162:1101–1107. [PubMed] [Google Scholar]
- Rozzo SJ, Allard JD, Choubey D, Vyse TJ, Izui S, Peltz G, Kotzin BL. Evidence for an interferon-inducible gene, Ifi202, in the susceptibility to systemic lupus. Immunity. 2001;15:435–443. doi: 10.1016/s1074-7613(01)00196-0. [DOI] [PubMed] [Google Scholar]
- Schneider HG, Michelangeli VP, Frampton RJ, Grogan JL, Ikeda K, Martin TJ, Findlay DM. Transforming growth factor-beta modulates receptor binding of calciotropic hormones and G protein-mediated adenylate cyclase responses in osteoblast-like cells. Endocrinology. 1992;131:1383–1389. doi: 10.1210/endo.131.3.1324161. [DOI] [PubMed] [Google Scholar]
- Shen H, Zhang YY, Long JR, Xu FH, Liu YZ, Xiao P, Zhao LJ, Xiong DH, Liu YJ, Dvornyk V, Rocha-Sanchez S, Liu PY, Li JL, Conway T, Davies KM, Recker RR, Deng HW. A genome-wide linkage scan for bone mineral density in an extended sample: evidence for linkage on 11q23 and Xq27. J Med Genet. 2004;41:743–751. doi: 10.1136/jmg.2004.020396. [DOI] [PMC free article] [PubMed] [Google Scholar]
- Smyth GK. Linear models and empirical Bayes methods for assessing differential expression in microarray experiments. Stat Appl Genet Mol Biol. 2004;3:1–26. doi: 10.2202/1544-6115.1027. [DOI] [PubMed] [Google Scholar]
- Sozzi G, Miozzo M, Di Palma S, Minelli A, Calderone C, Danesino C, Pastorino U, Pierotti MA, Della Porta G. Involvement of the region 13q14 in a patient with adamantinoma of the long bones. Hum Genet. 1990;85:513–515. doi: 10.1007/BF00194227. [DOI] [PubMed] [Google Scholar]
- Stone KL, Seeley DG, Lui LY, Cauley JA, Ensrud K, Browner WS, Nevitt MC, Cummings SR. BMD at multiple sites and risk of fracture of multiple types: long-term results from the Study of Osteoporotic Fractures. J Bone Miner Res. 2003;18:1947–1954. doi: 10.1359/jbmr.2003.18.11.1947. [DOI] [PubMed] [Google Scholar]
- Styrkarsdottir U, Cazier JB, Kong A, Rolfsson O, Larsen H, Bjarnadottir E, Johannsdottir VD, Sigurdardottir MS, Bagger Y, Christiansen C, Reynisdottir I, Grant SF, Jonasson K, Frigge ML, Gulcher JR, Sigurdsson G, Stefansson K. Linkage of osteoporosis to chromosome 20p12 and association to BMP2. PLoS Biol. 2003;1:E69. doi: 10.1371/journal.pbio.0000069. [DOI] [PMC free article] [PubMed] [Google Scholar]
- Styrkarsdottir U, Halldorsson BV, Gretarsdottir S, Gudbjartsson DF, Walters GB, Ingvarsson T, Jonsdottir T, Saemundsdottir J, Center JR, Nguyen TV, Bagger Y, Gulcher JR, Eisman JA, Christiansen C, Sigurdsson G, Kong A, Thorsteinsdottir U, Stefansson K. Multiple genetic loci for bone mineral density and fractures. N Engl J Med. 2008;358:2355–2365. doi: 10.1056/NEJMoa0801197. [DOI] [PubMed] [Google Scholar]
- Swanton E, Bishop N, Woodman P. Human rabaptin-5 is selectively cleaved by caspase-3 during apoptosis. J Biol Chem. 1999;274:37583–37590. doi: 10.1074/jbc.274.53.37583. [DOI] [PubMed] [Google Scholar]
- Tsai JA, Rong H, Torring O, Matsushita H, Bucht E. Interleukin-1beta upregulates PTHrP-mRNA expression and protein production and decreases TGF-beta in normal human osteoblast-like cells. Calcif Tissue Int. 2000;66:363–369. doi: 10.1007/s002230010074. [DOI] [PubMed] [Google Scholar]
- Turner CH, Roeder RK, Wieczorek A, Foroud T, Liu G, Peacock M. Variability in skeletal mass, structure, and biomechanical properties among inbred strains of rats. J Bone Miner Res. 2001;16:1532–1539. doi: 10.1359/jbmr.2001.16.8.1532. [DOI] [PubMed] [Google Scholar]
- Wada Y, Sato M, Niimi M, Tamaki M, Ishida T, Takahara J. Inhibitory effects of interleukin-1 on growth hormone secretion in conscious male rats. Endocrinology. 1995;136:3936–3941. doi: 10.1210/endo.136.9.7649102. [DOI] [PubMed] [Google Scholar]
- Wang J, Zhou J, Bondy CA. Igf1 promotes longitudinal bone growth by insulin-like actions augmenting chondrocyte hypertrophy. FASEB J. 1999;13:1985–1990. doi: 10.1096/fasebj.13.14.1985. [DOI] [PubMed] [Google Scholar]
- Wilson SG, Reed PW, Bansal A, Chiano M, Lindersson M, Langdown M, Prince RL, Thompson D, Thompson E, Bailey M, Kleyn PW, Sambrook P, Shi MM, Spector TD. Comparison of genome screens for two independent cohorts provides replication of suggestive linkage of bone mineral density to 3p21 and 1p36. Am J Hum Genet. 2003;72:144–155. doi: 10.1086/345819. [DOI] [PMC free article] [PubMed] [Google Scholar]
- Zhou H, Choong PC, Chou ST, Kartsogiannis V, Martin TJ, Ng KW. Transforming growth factor beta 1 stimulates bone formation and resorption in an in-vivo model in rabbits. Bone. 1995;17:443S–448S. doi: 10.1016/8756-3282(95)00324-7. [DOI] [PubMed] [Google Scholar]